

ZFP217 regulates adipogenesis by controlling mitotic clonal expansion in a METTL3-m6A dependent manner
- PMID: 31434544
- PMCID: PMC7567449
- DOI: 10.1080/15476286.2019.1658508
ZFP217 regulates adipogenesis by controlling mitotic clonal expansion in a METTL3-m6A dependent manner
Abstract
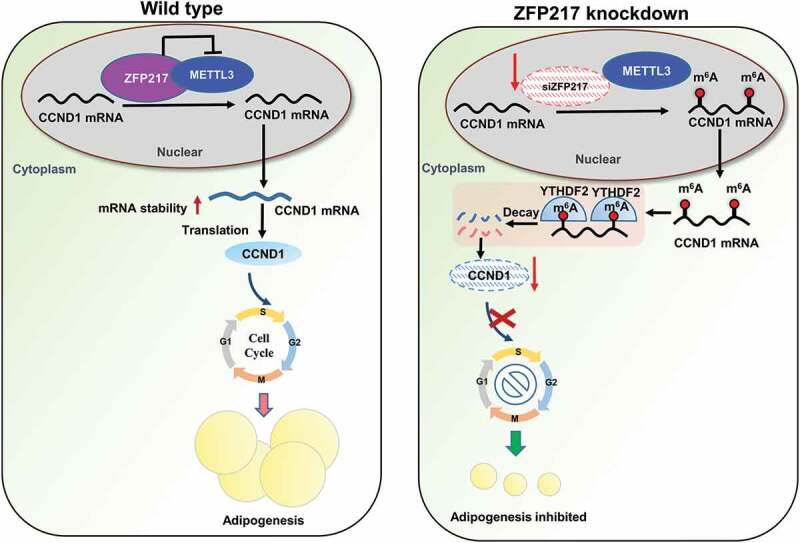
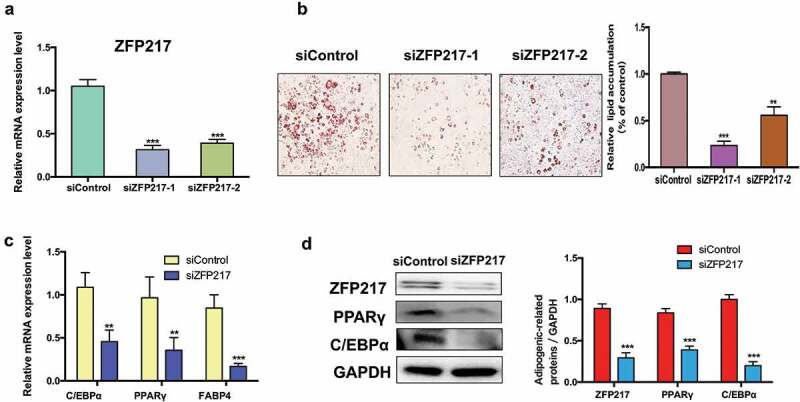
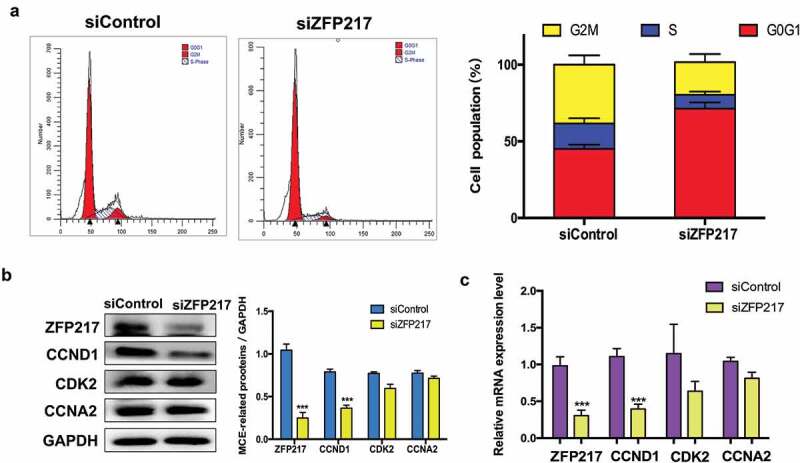
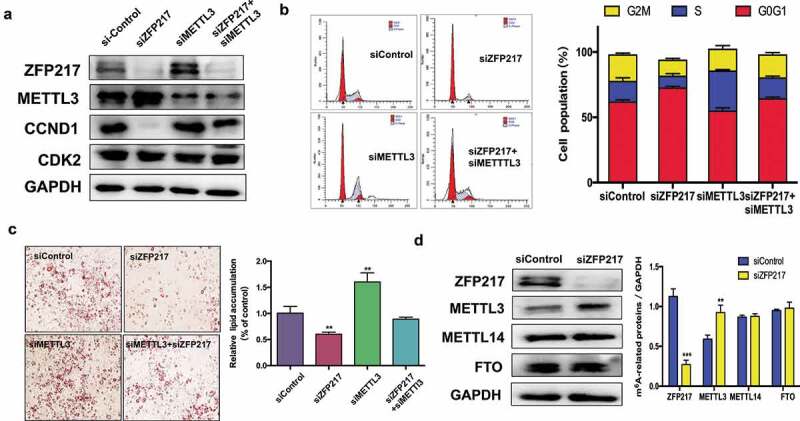
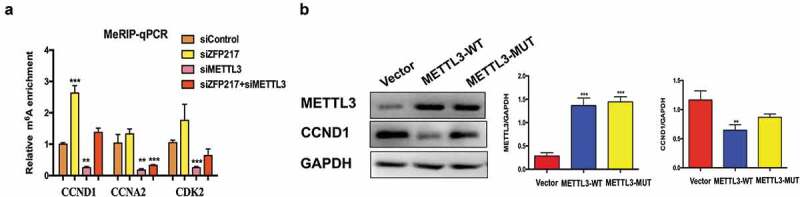
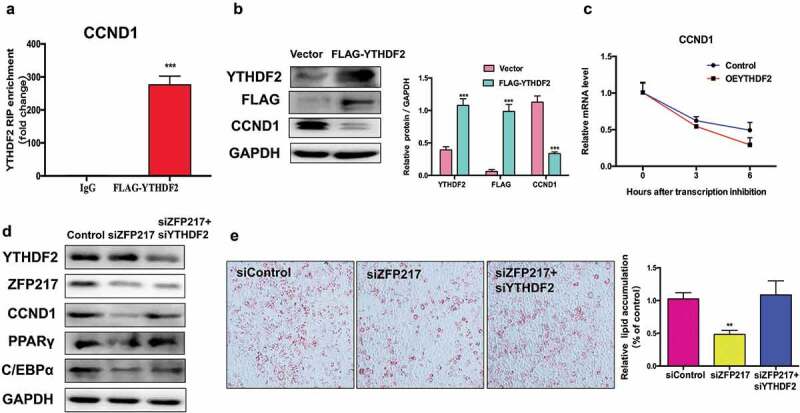
Obesity is becoming a global problem. Research into the detailed mechanism of adipocyte development is crucial for the treatment of excess fat. Zinc finger protein 217 plays roles in adipogenesis. However, the underlying mechanism remains unclear. Here, we demonstrated that ZFP217 knockdown prevented the mitotic clonal expansion process and caused adipogenesis inhibition. Depletion of ZFP217 increased the expression of the m6A methyltransferase METTL3, which upregulated the m6A level of cyclin D1 mRNA. METTL3 knockdown rescued the siZFP217-inhibited MCE and promoted CCND1 expression. YTH domain family 2 recognized and degraded the methylated CCND1 mRNA, leading to the downregulation of CCND1. Consequently, cell-cycle progression was blocked, and adipogenesis was inhibited. YTHDF2 knockdown relieved siZFP217-inhibited adipocyte differentiation. These findings reveal that ZFP217 knockdown-induced adipogenesis inhibition was caused by CCND1, which was mediated by METTL3 and YTHDF2 in an m6A-dependent manner. We have provided novel insight into the underlying molecular mechanisms by which m6A methylation is involved in the ZFP217 regulation of adipogenesis.
Keywords: METTL3; ZFP217; adipogenesis; mRNA m6A; mitotic clonal expansion.
Figures
Similar articles
-
The RNA Methyltransferase Complex of WTAP, METTL3, and METTL14 Regulates Mitotic Clonal Expansion in Adipogenesis.Mol Cell Biol. 2018 Jul 30;38(16):e00116-18. doi: 10.1128/MCB.00116-18. Print 2018 Aug 15. Mol Cell Biol. 2018. PMID: 29866655 Free PMC article.
-
Zfp217 mediates m6A mRNA methylation to orchestrate transcriptional and post-transcriptional regulation to promote adipogenic differentiation.Nucleic Acids Res. 2019 Jul 9;47(12):6130-6144. doi: 10.1093/nar/gkz312. Nucleic Acids Res. 2019. PMID: 31037292 Free PMC article.
-
Inhibitory efficacy of lutein on adipogenesis is associated with blockage of early phase regulators of adipocyte differentiation.Biochim Biophys Acta Mol Cell Biol Lipids. 2021 Jan;1866(1):158812. doi: 10.1016/j.bbalip.2020.158812. Epub 2020 Sep 11. Biochim Biophys Acta Mol Cell Biol Lipids. 2021. PMID: 32920140
-
Molecular Regulation of Adipogenesis and Potential Anti-Adipogenic Bioactive Molecules.Int J Mol Sci. 2016 Jan 19;17(1):124. doi: 10.3390/ijms17010124. Int J Mol Sci. 2016. PMID: 26797605 Free PMC article. Review.
-
ZNF217: the cerberus who fails to guard the gateway to lethal malignancy.Am J Cancer Res. 2021 Jul 15;11(7):3378-3405. eCollection 2021. Am J Cancer Res. 2021. PMID: 34354851 Free PMC article. Review.
Cited by
-
m6A-binding proteins: the emerging crucial performers in epigenetics.J Hematol Oncol. 2020 Apr 10;13(1):35. doi: 10.1186/s13045-020-00872-8. J Hematol Oncol. 2020. PMID: 32276589 Free PMC article. Review.
-
mRNA m5C controls adipogenesis by promoting CDKN1A mRNA export and translation.RNA Biol. 2021 Nov 12;18(sup2):711-721. doi: 10.1080/15476286.2021.1980694. Epub 2021 Sep 27. RNA Biol. 2021. PMID: 34570675 Free PMC article.
-
N6-Methyladenosine in Cell-Fate Determination of BMSCs: From Mechanism to Applications.Research (Wash D C). 2024 Apr 25;7:0340. doi: 10.34133/research.0340. eCollection 2024. Research (Wash D C). 2024. PMID: 38665846 Free PMC article.
-
Epigenetic regulation of N6-methyladenosine modifications in obesity.J Diabetes Investig. 2021 Aug;12(8):1306-1315. doi: 10.1111/jdi.13571. Epub 2021 Jun 3. J Diabetes Investig. 2021. PMID: 33979018 Free PMC article. Review.
-
Partial Deficiency of Zfp217 Resists High-Fat Diet-Induced Obesity by Increasing Energy Metabolism in Mice.Int J Mol Sci. 2021 May 20;22(10):5390. doi: 10.3390/ijms22105390. Int J Mol Sci. 2021. PMID: 34065474 Free PMC article.
References
-
- Lee SW, Son JY, Kim JM, et al. Body fat distribution is more predictive of all-cause mortality than overall adiposity. Diabetes Obesity Metab. 2018;20:141–147. - PubMed
-
- Buzaglo-Azriel L, Kuperman Y, Tsoory M, et al. Loss of muscle MTCH2 increases whole-body energy utilization and protects from diet-induced obesity. Cell Rep. 2017;18:1335–1336. - PubMed
-
- Esteve RM. Adipose tissue: cell heterogeneity and functional diversity. Endocrinol Nutr. 2014;61:100–112. - PubMed
Publication types
MeSH terms
Substances
Grants and funding
LinkOut - more resources
Full Text Sources
Other Literature Sources
Molecular Biology Databases
Research Materials