. 2019 Aug 20;28(8):2140-2155.e6.
doi: 10.1016/j.celrep.2019.07.059.

Combination PD-1 and PD-L1 Blockade Promotes Durable Neoantigen-Specific T Cell-Mediated Immunity in Pancreatic Ductal Adenocarcinoma

Affiliations

Combination PD-1 and PD-L1 Blockade Promotes Durable Neoantigen-Specific T Cell-Mediated Immunity in Pancreatic Ductal Adenocarcinoma

Adam L Burrack et al. Cell Rep. .

Abstract

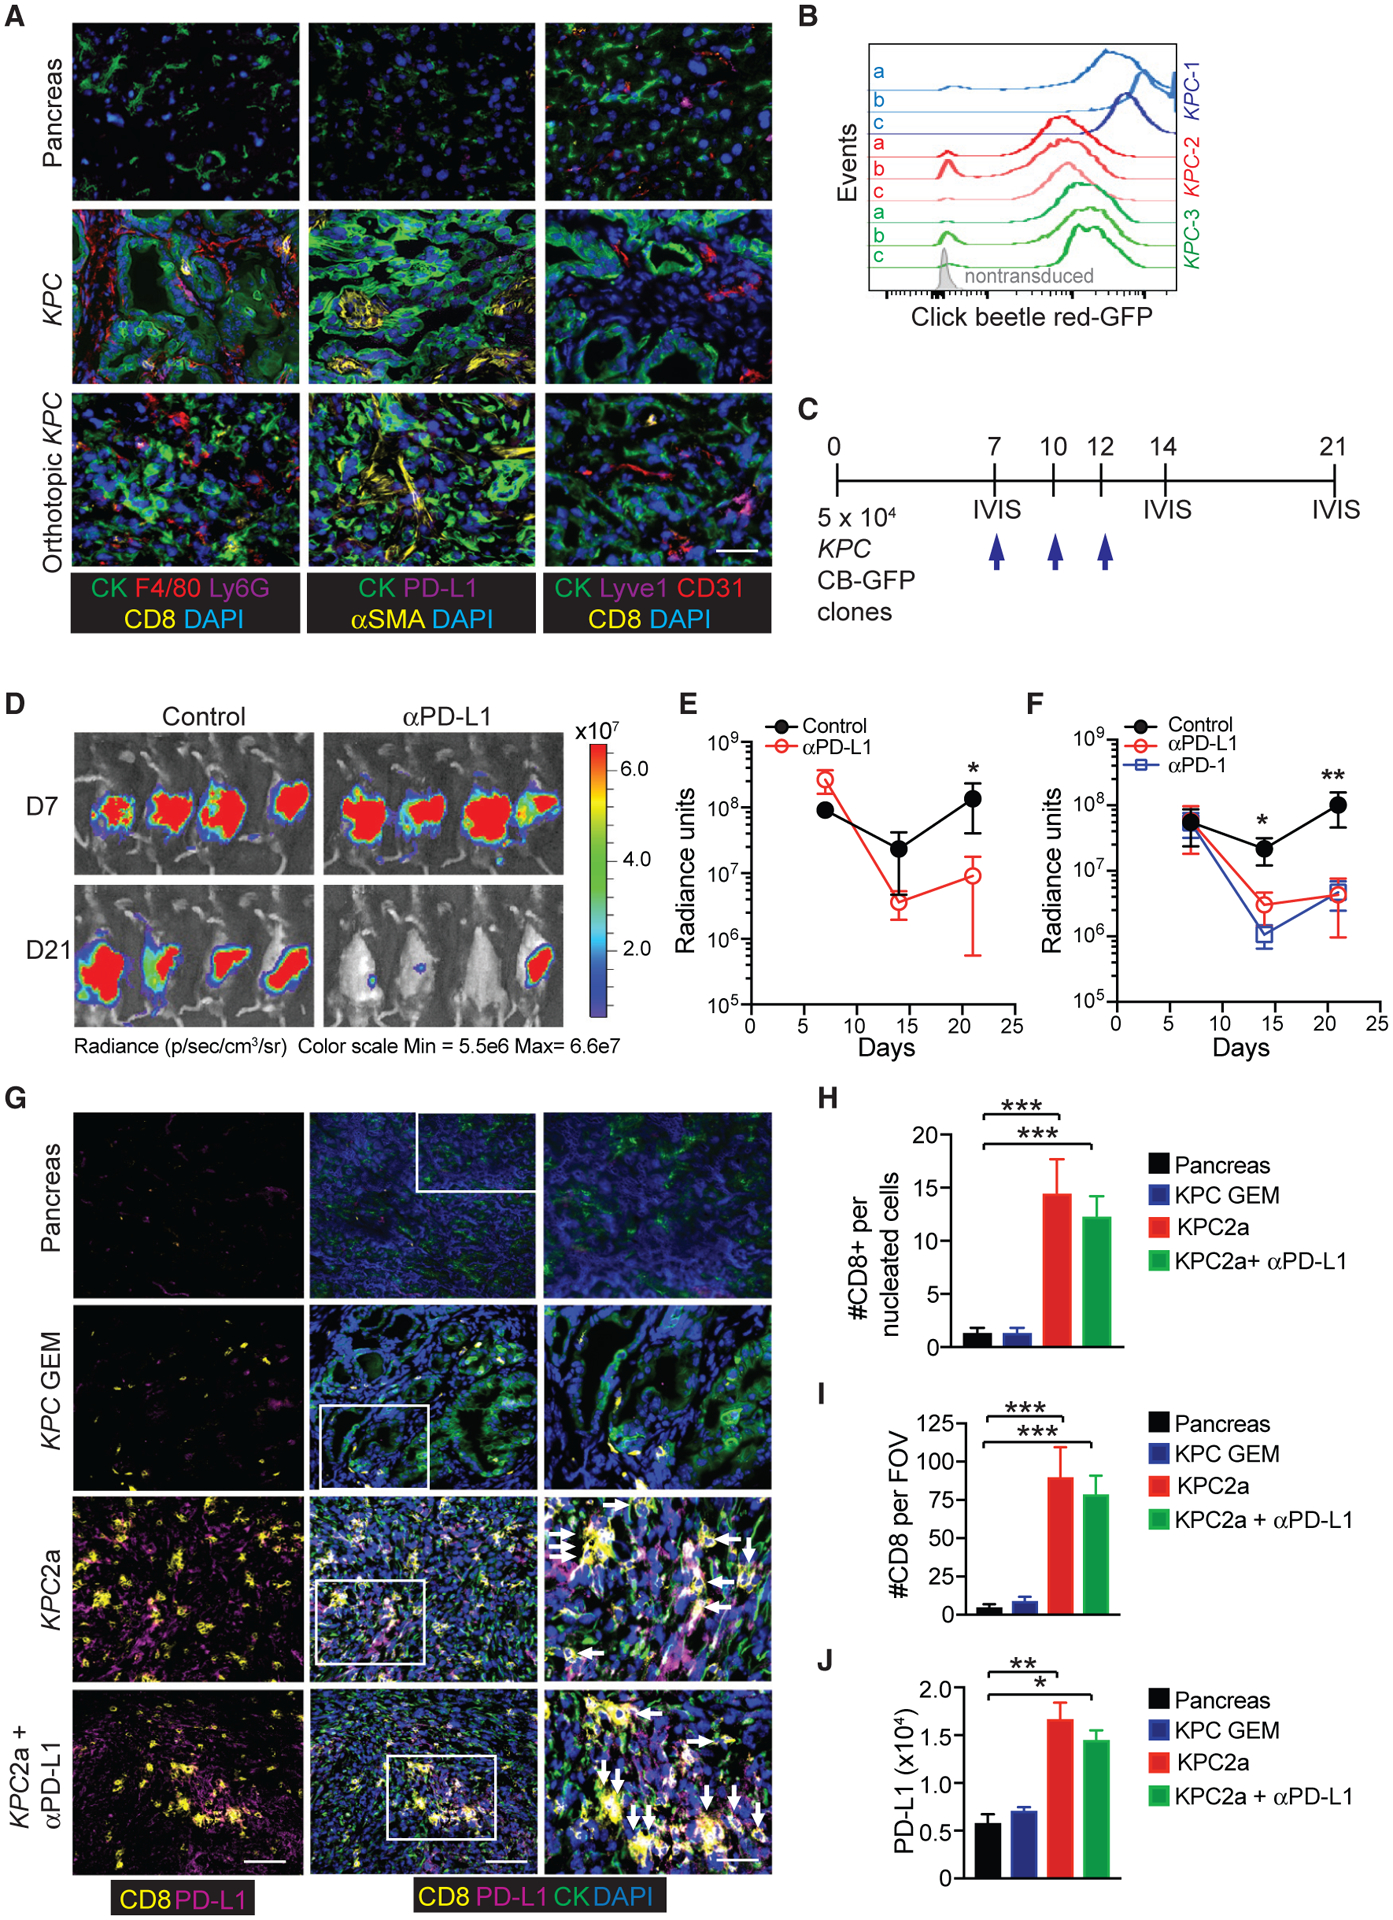
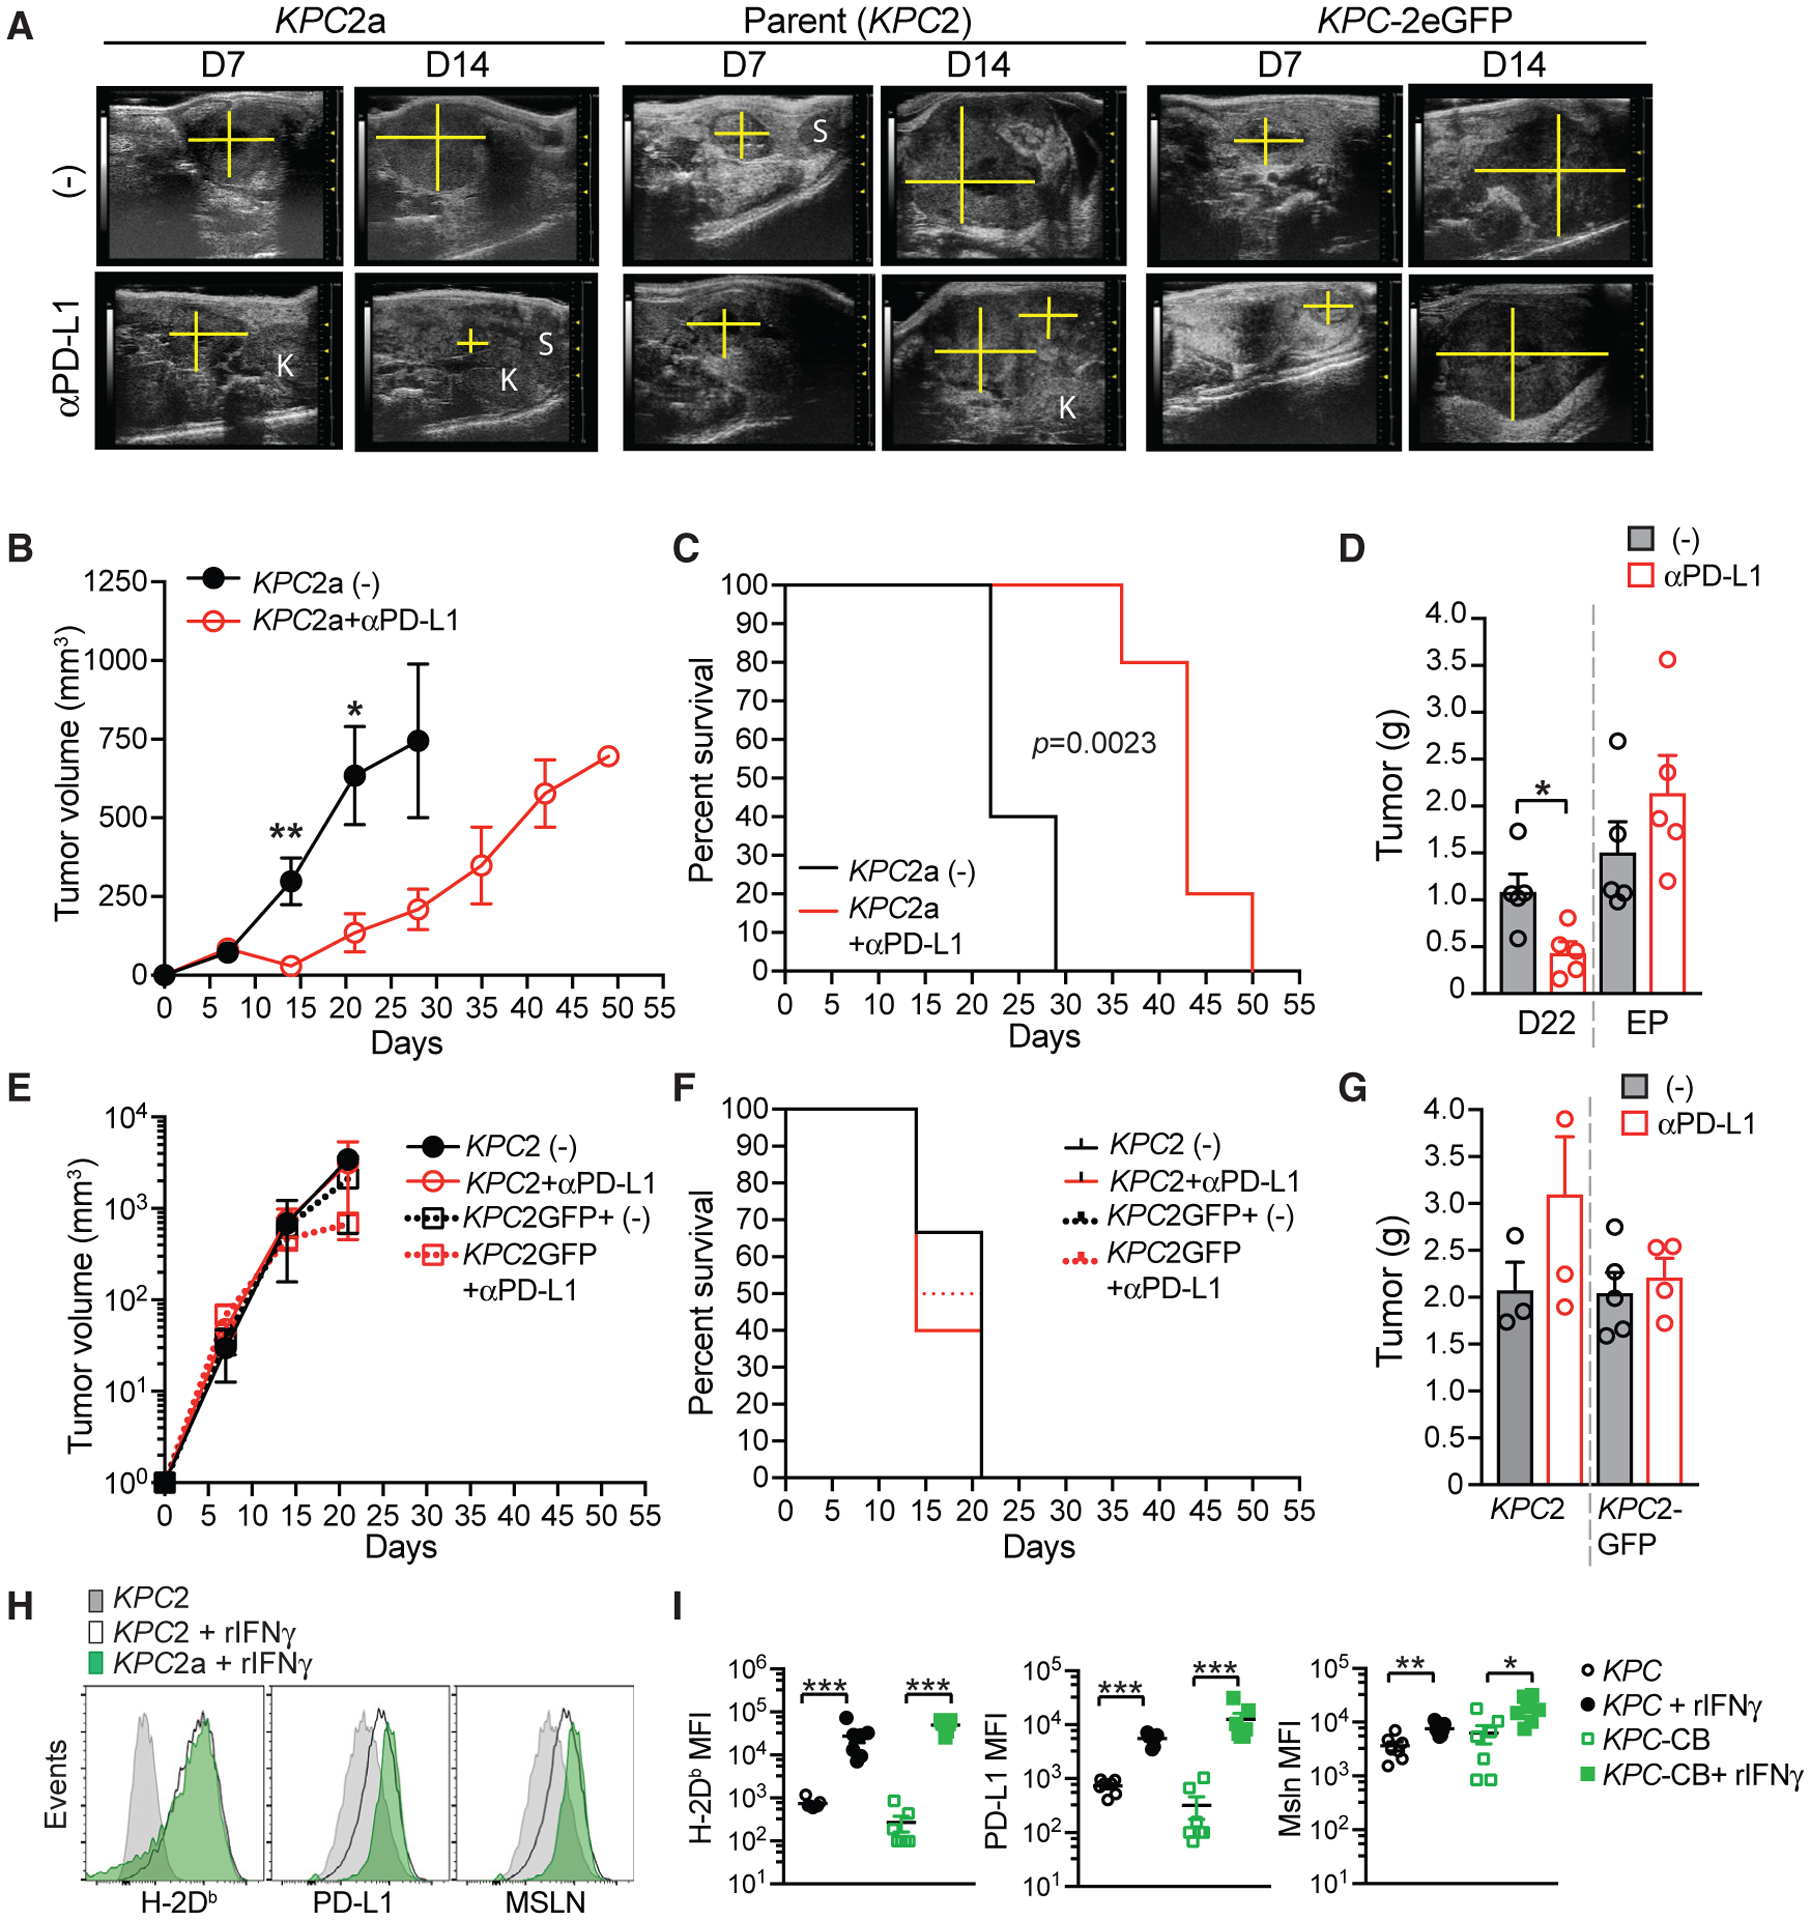
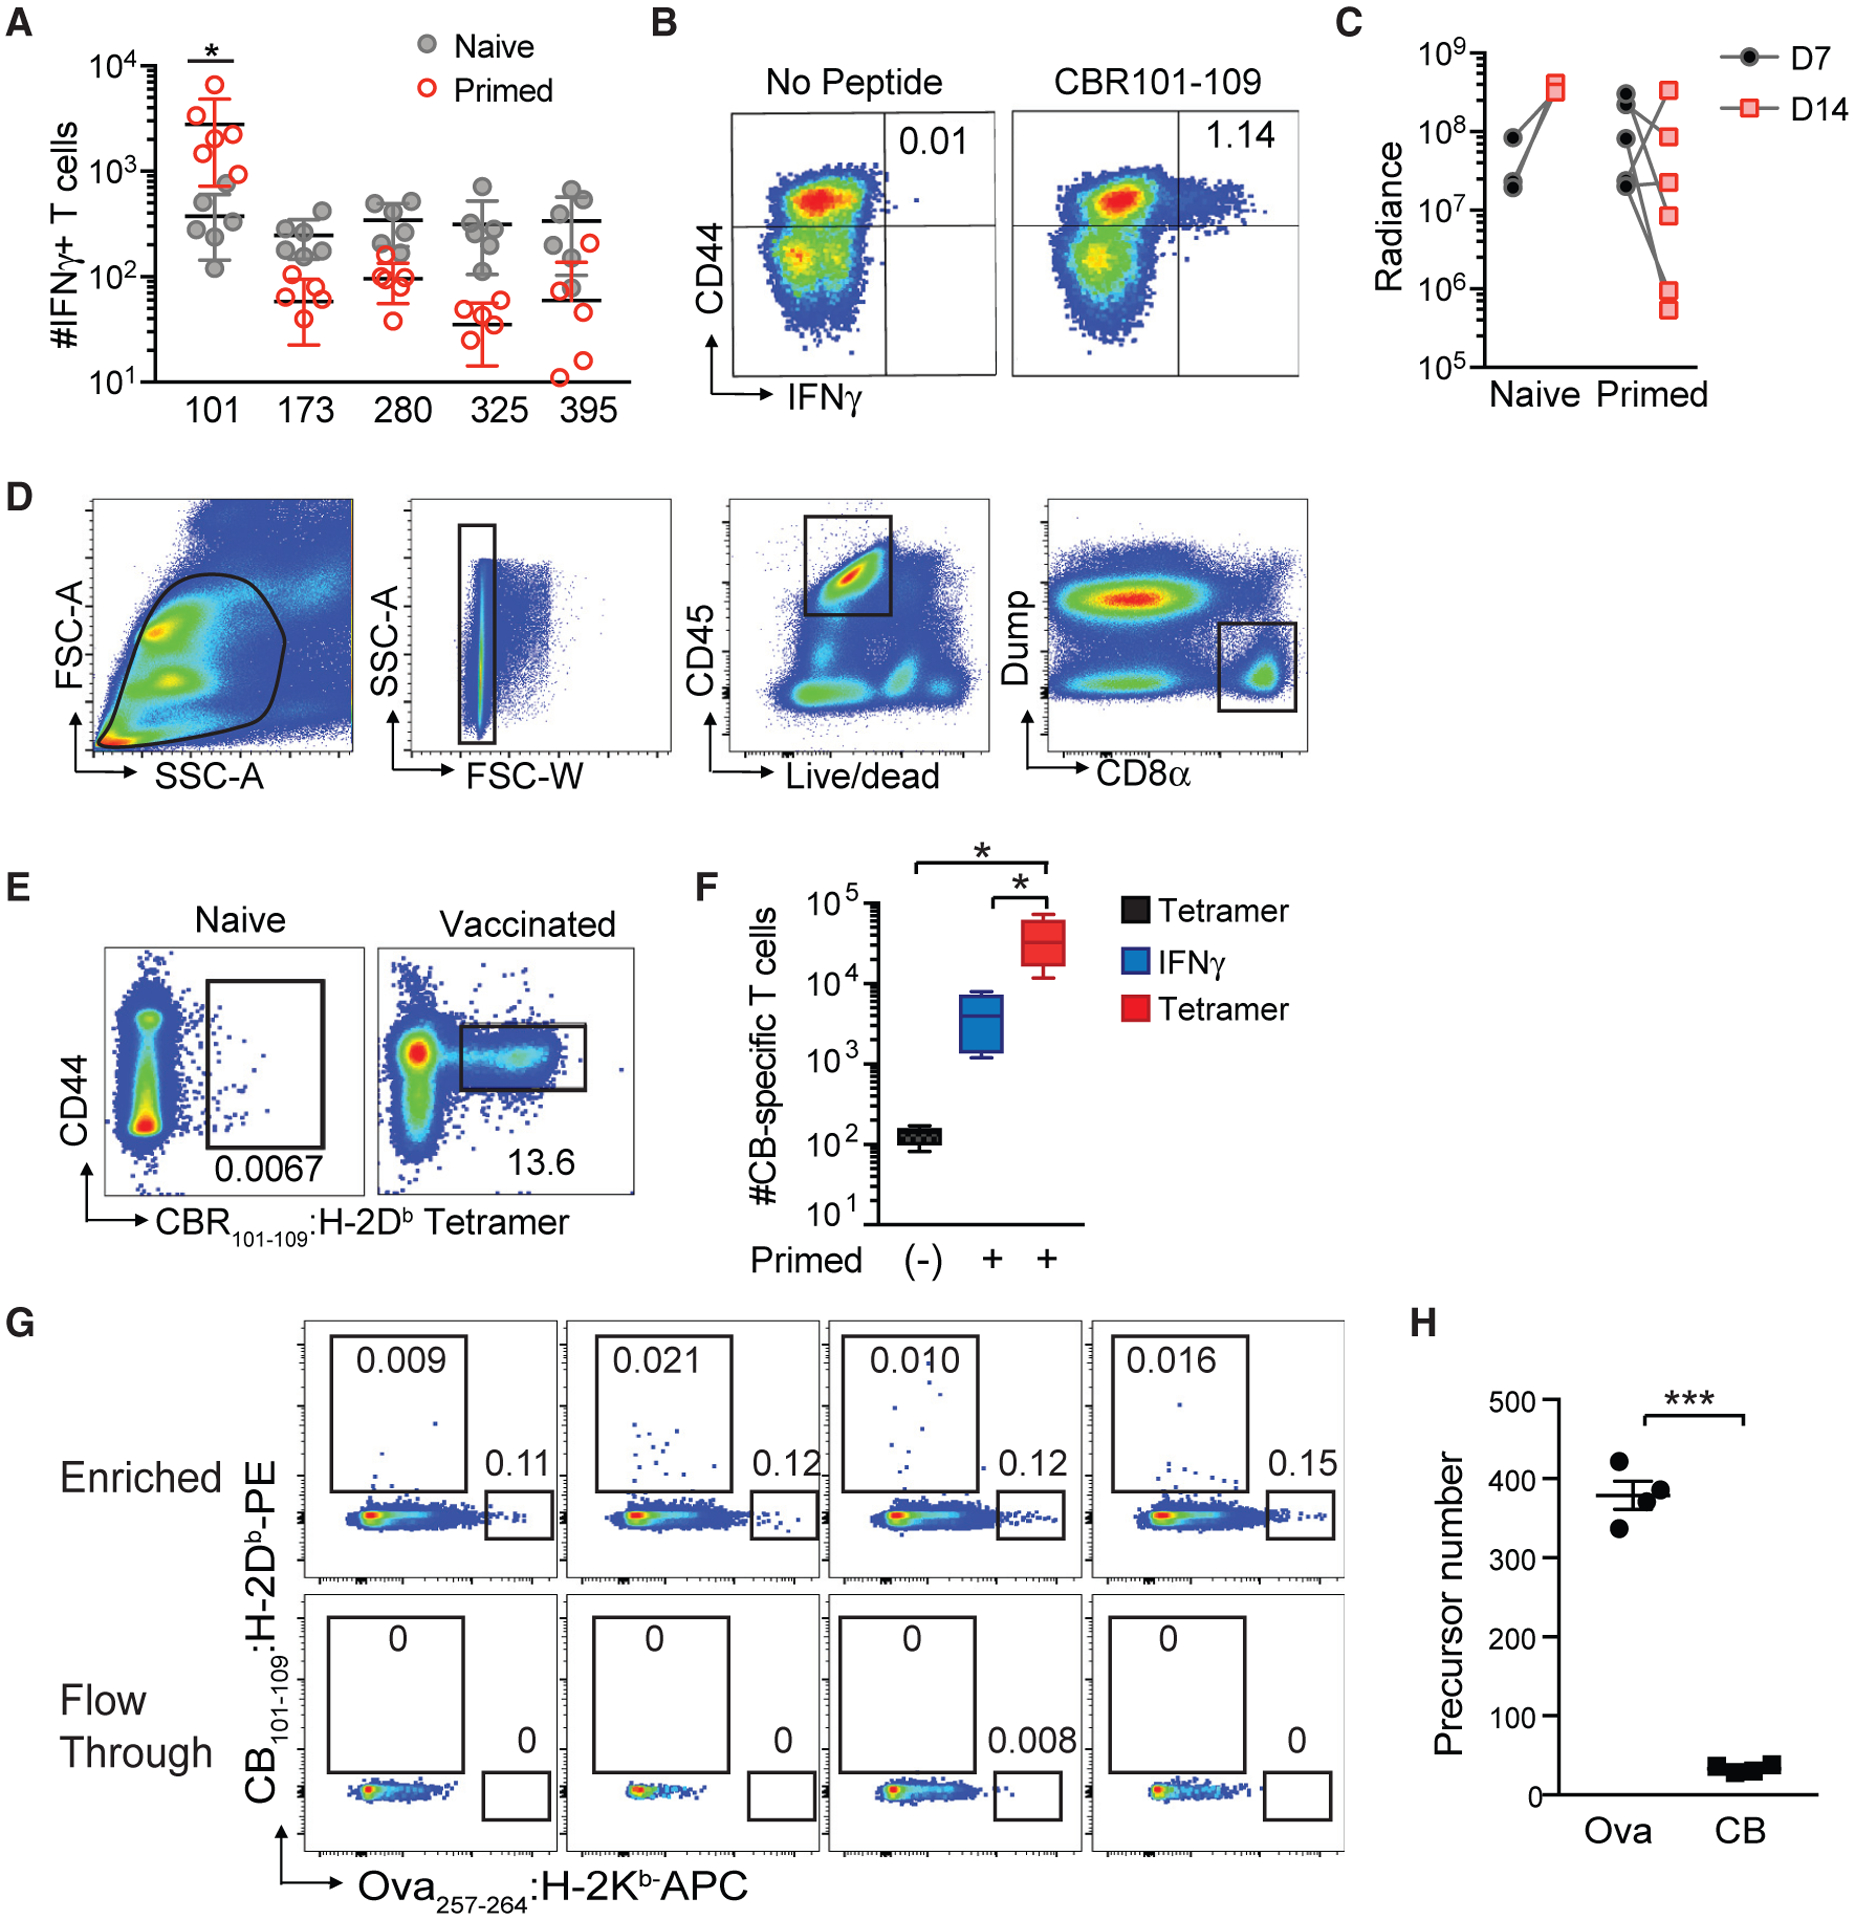
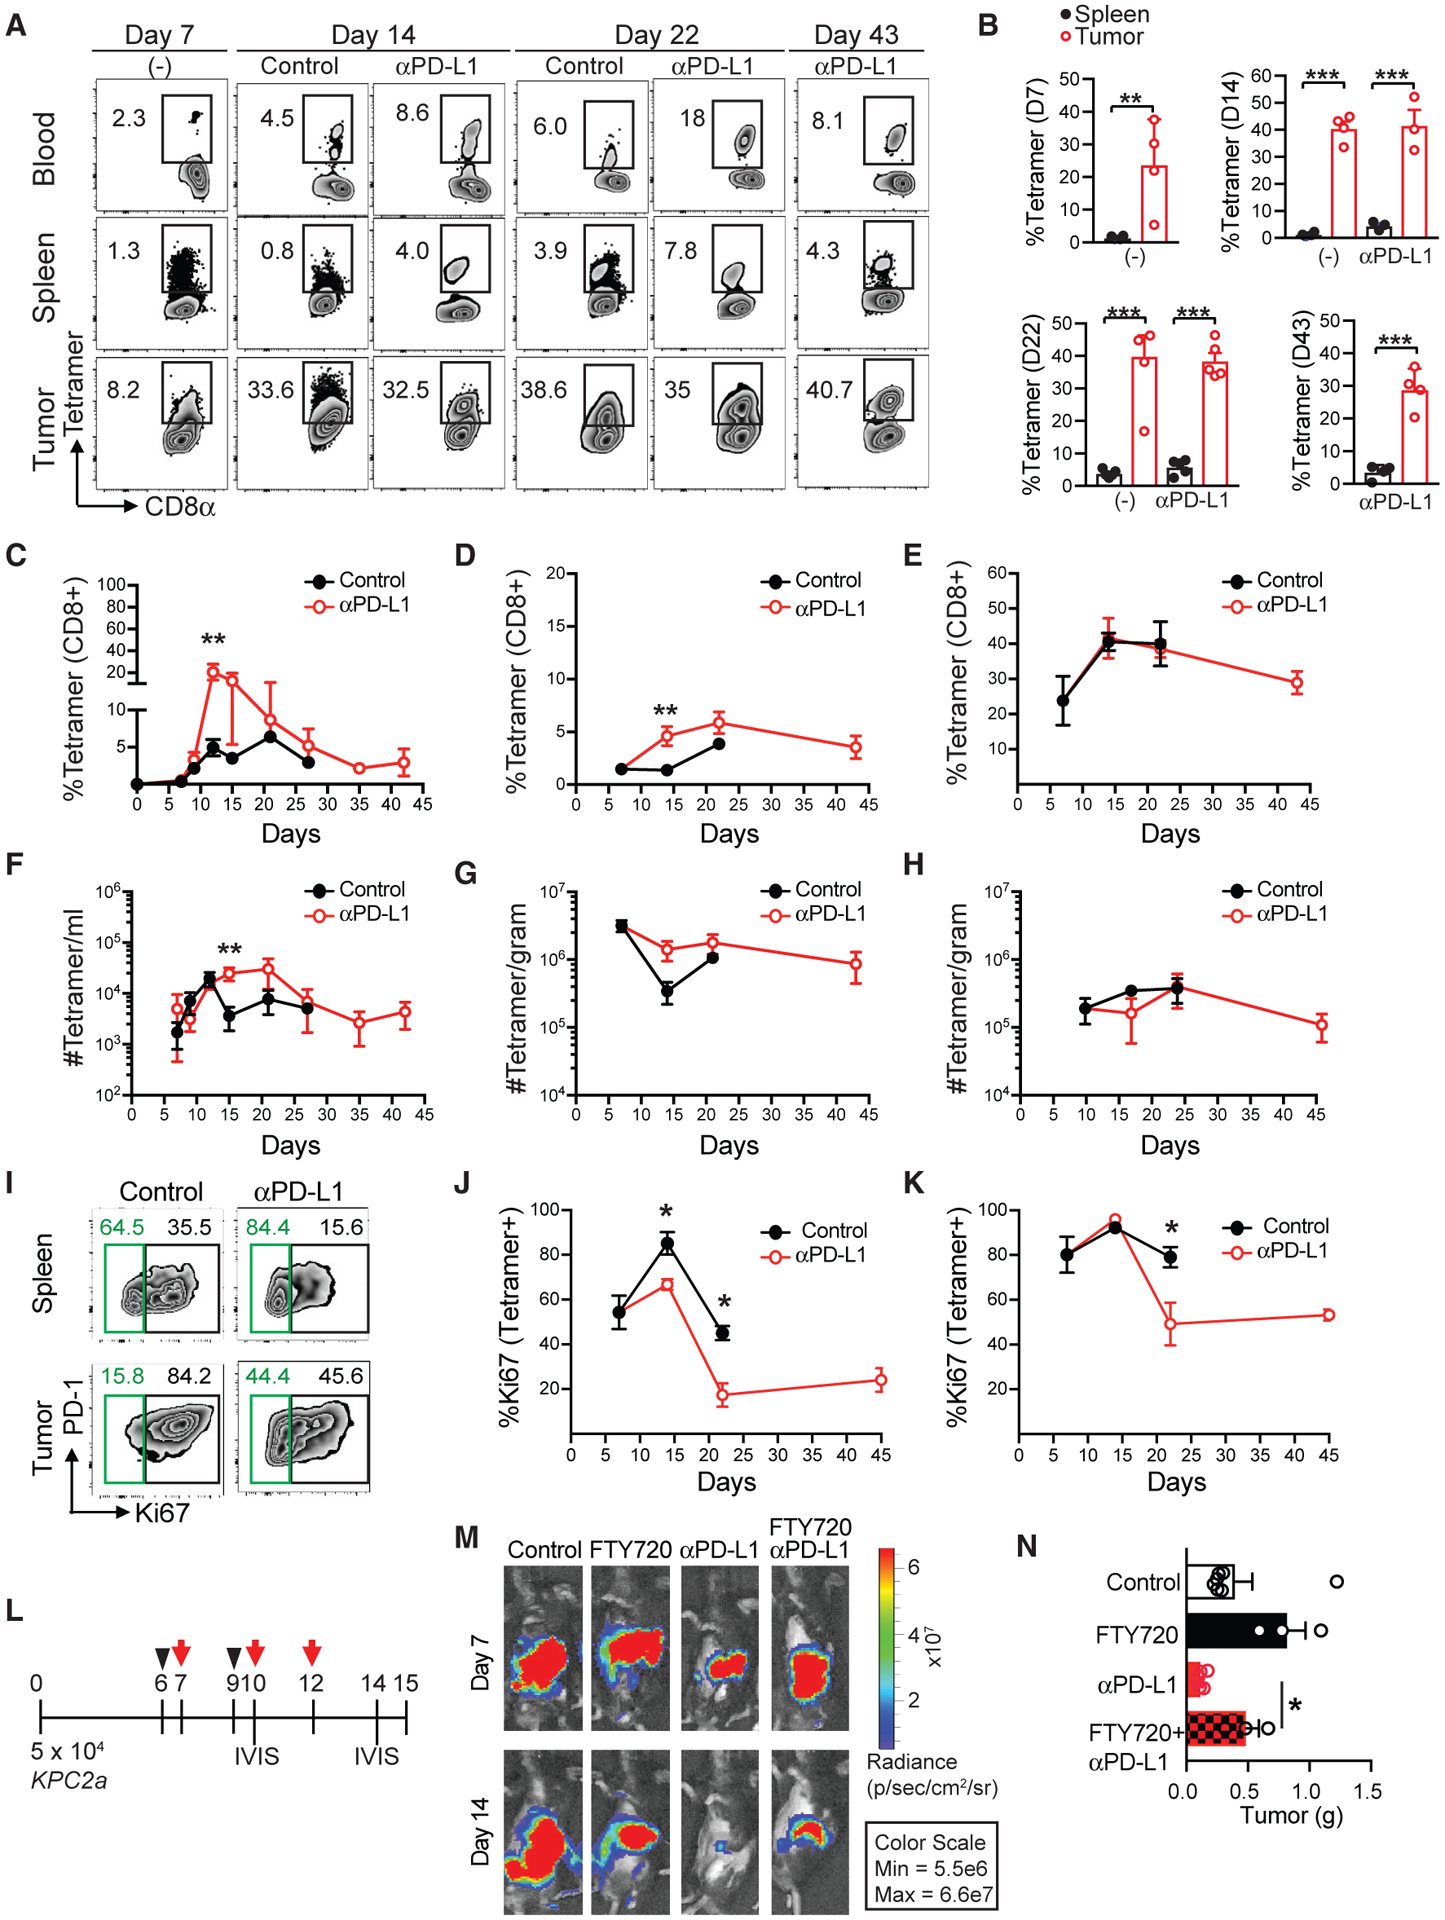
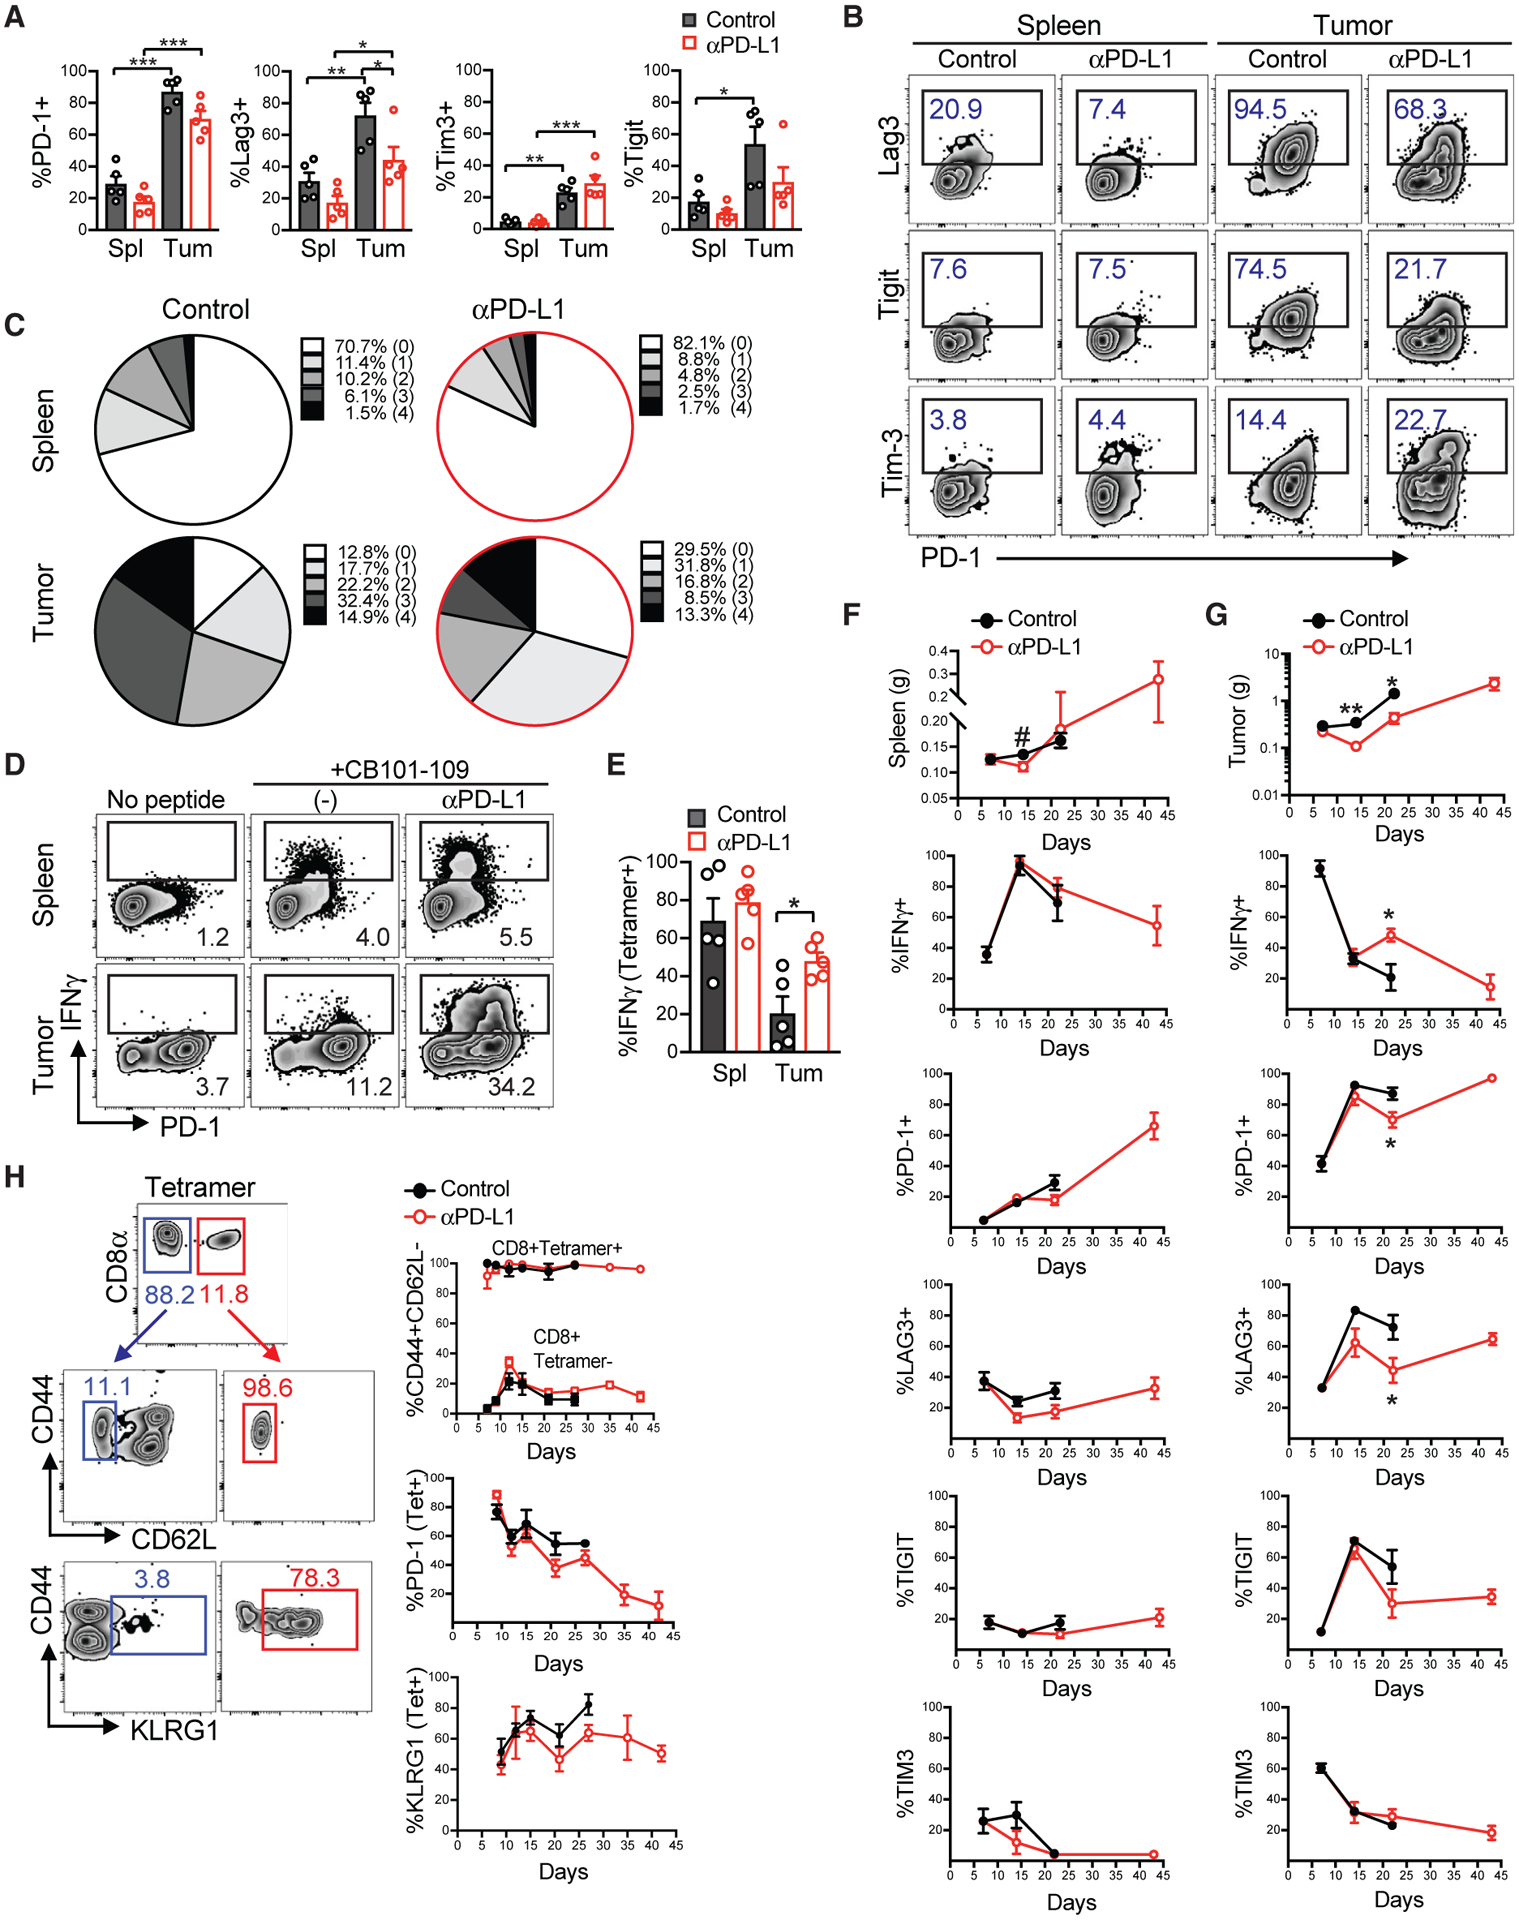
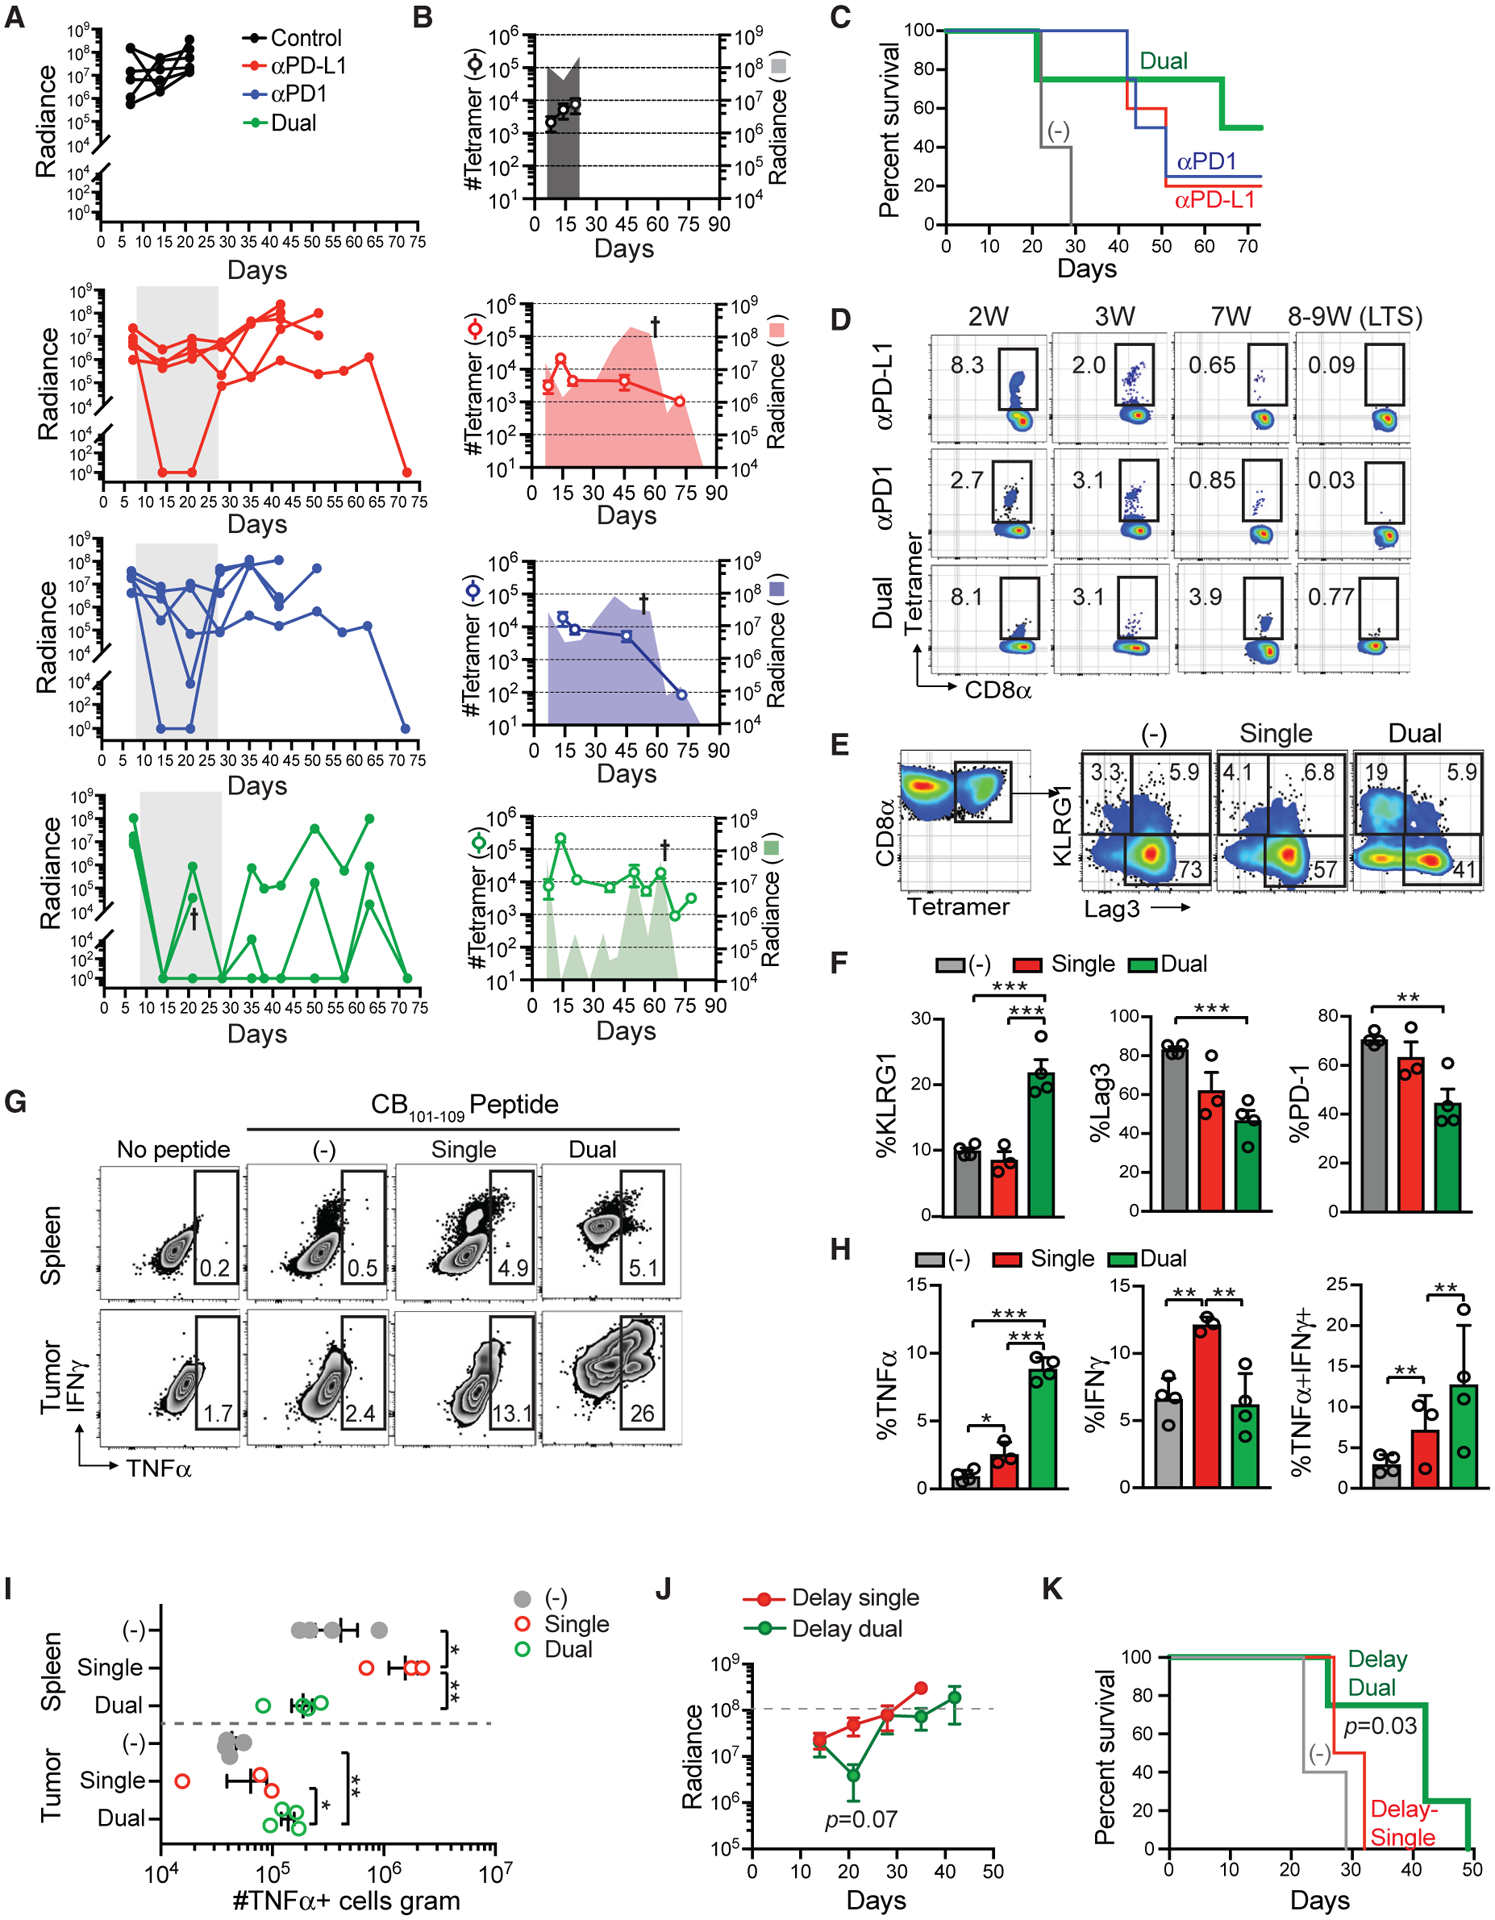
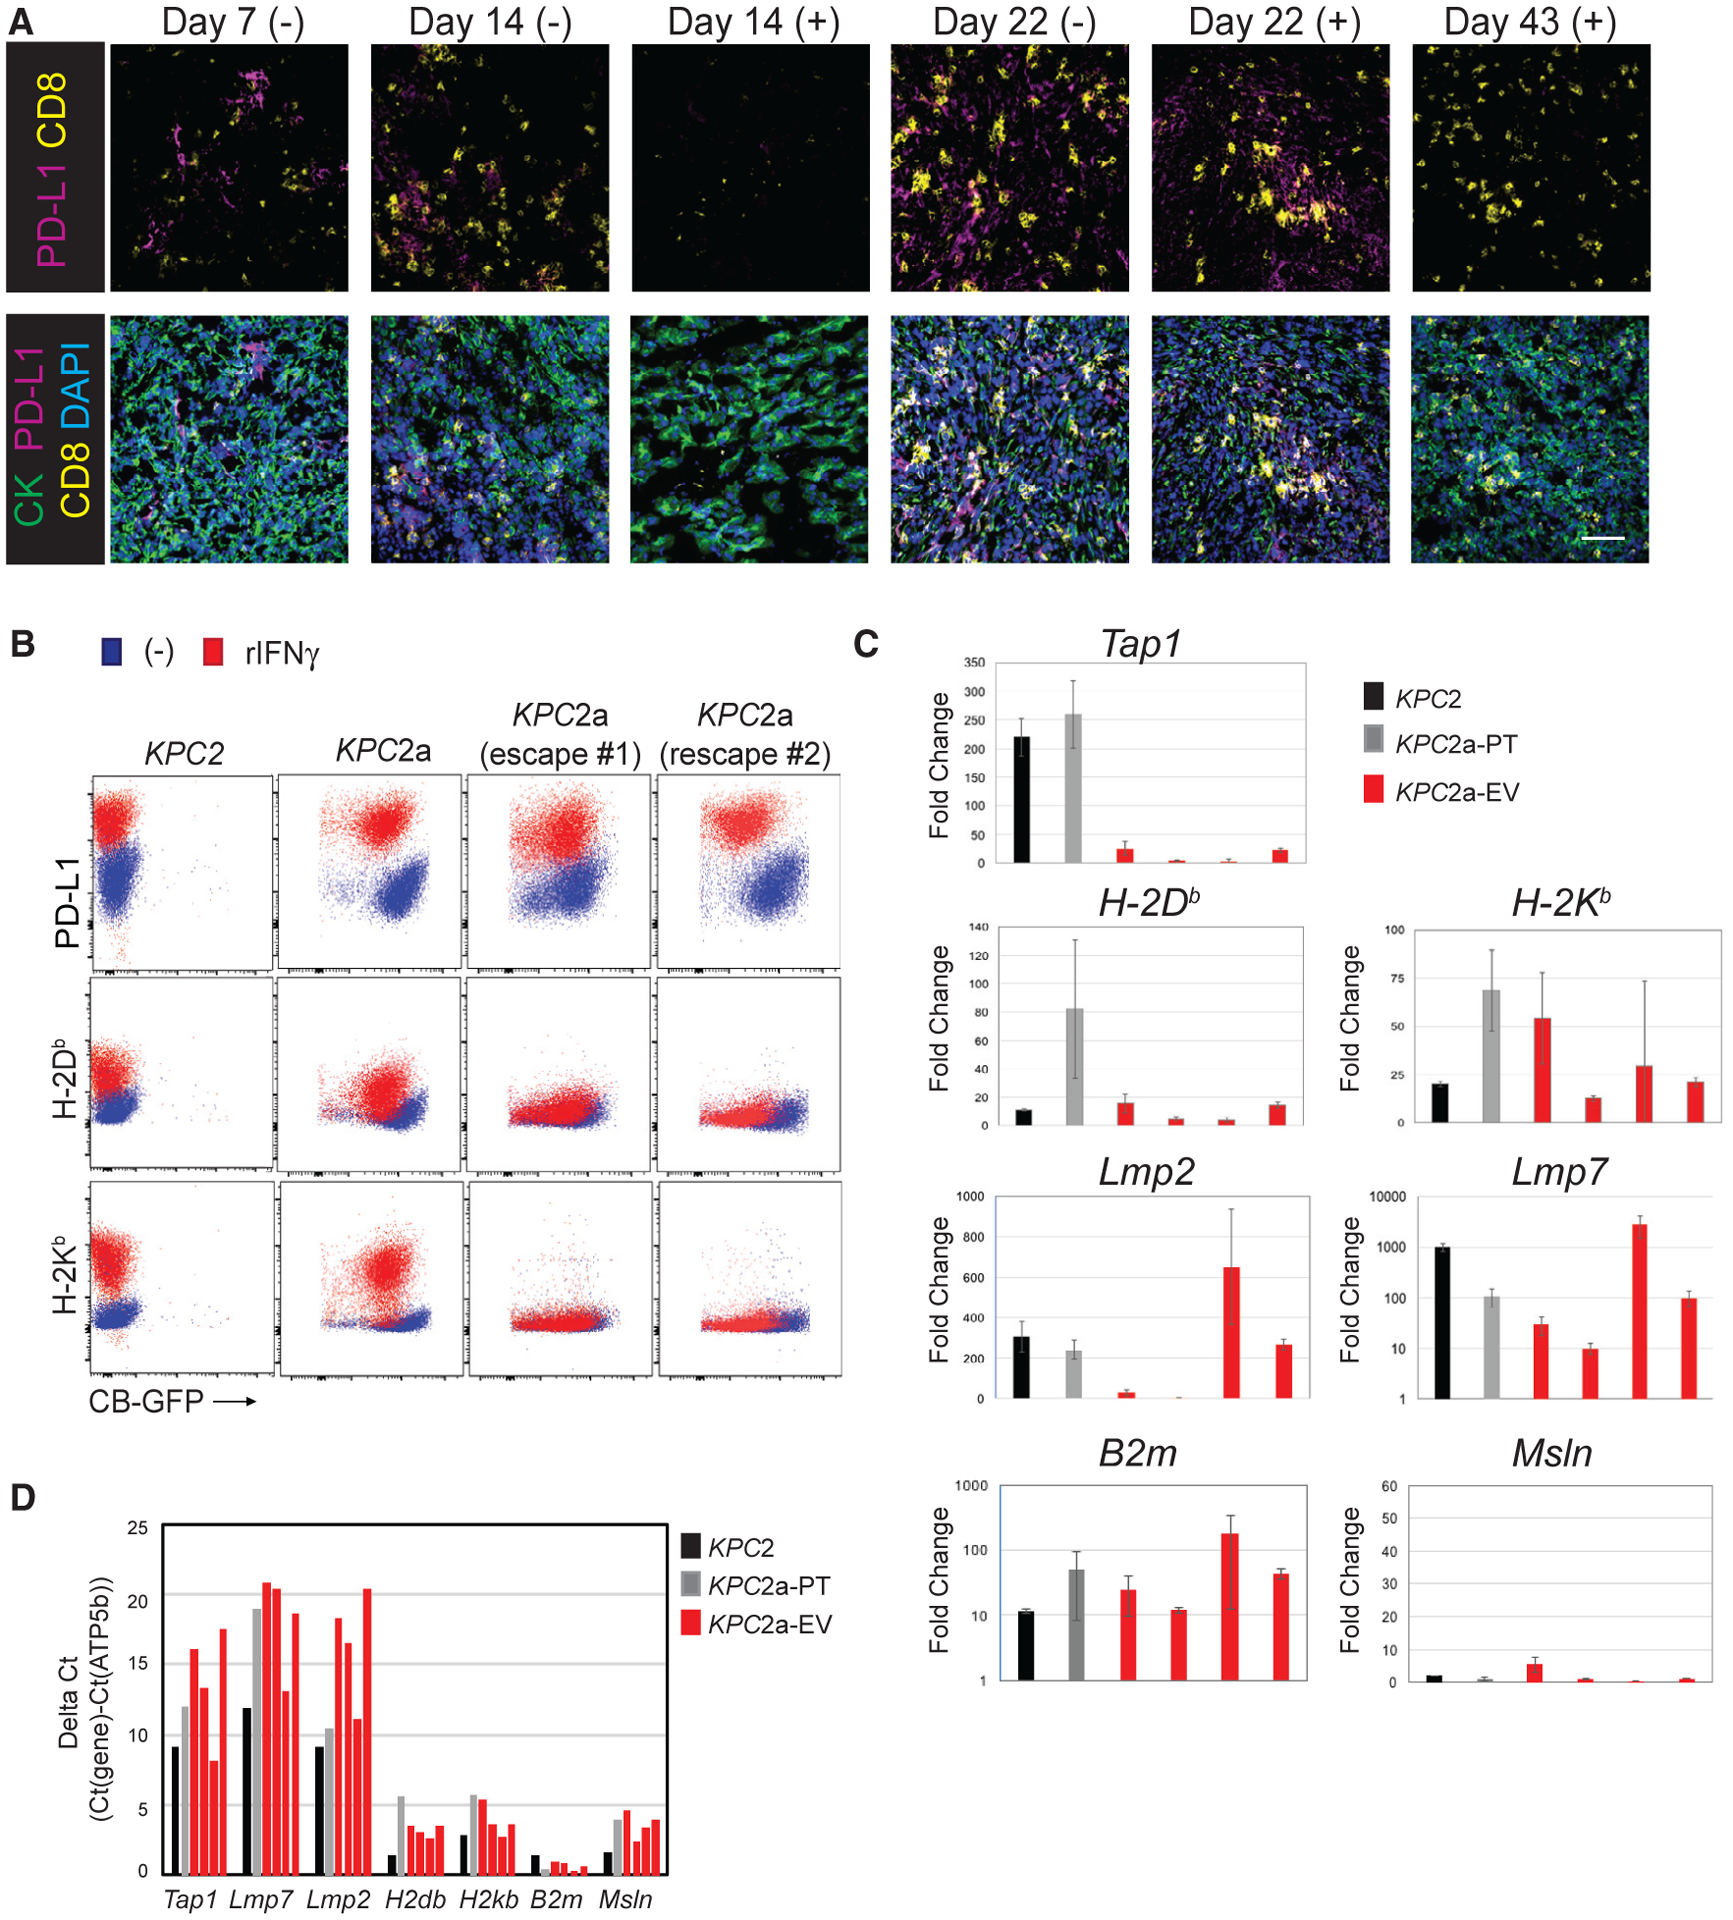
Pancreatic ductal adenocarcinoma (PDA) is a lethal cancer resistant to immunotherapy. We create a PDA mouse model and show that neoantigen expression is required for intratumoral T cell accumulation and response to immune checkpoint blockade. By generating a peptide:MHC tetramer, we identify that PDA induces rapid intratumoral, and progressive systemic, tumor-specific T cell exhaustion. Monotherapy PD-1 or PD-L1 blockade enhances systemic T cell expansion and induces objective responses that require systemic T cells. However, tumor escape variants defective in IFNγ-inducible Tap1 and MHC class I cell surface expression ultimately emerge. Combination PD-1 + PD-L1 blockade synergizes therapeutically by increasing intratumoral KLRG1+Lag3-TNFα+ tumor-specific T cells and generating memory T cells capable of expanding to spontaneous tumor recurrence, thereby prolonging animal survival. Our studies support that PD-1 and PD-L1 are relevant immune checkpoints in PDA and identify a combination for clinical testing in those patients with neoantigen-specific T cells.

Keywords: PD-1; PD-L1; PDA; T cells; acquired resistance; immunotherapy; neoepitope; pancreatic cancer.


Conflict of interest statement

DECLARATION OF INTERESTS

The authors declare no competing interests.

Figures

Figure 1.
Figure 1.. Generation of an Immunotherapy-Responsive Pancreas Cancer Animal Model
(A) Representative immunofluorescent (IF) staining of wild-type mouse pancreas (top row), primary tumors isolated from a genetically engineered KPC mouse (middle row), and a polyclonal KPC TECs following orthotopic implantation into B6 pancreas at 3 weeks post-implantation (bottom row). Images depict cytokeratin+ (CK) tumor cells, CD8+ T cells, F4/80+ macrophages, Ly6G+ neutrophils, PD-L1, αSMA cancer-associated fibroblast (CAFs), CD31+ endothelial cells, and Lyve-1+ lymphatic venules. Scale bar, 25 μM. (B) Histogram overlay of CB-eGFP+ KPC clones generated from three independent KPC mice. Shown are representative clones (n = 3) from the three independent polyclonal KPC tumor epithelial cell lines (KPC1–3). (C) Timeline for orthotopic tumor cell injection, αPD-L1 treatments (blue arrows), and IVIS imaging. (D) Representative IVIS imaging of tumor bioluminescence at 7 days (prior to treatment) and 14 days following the initial αPD-L1 injection (day 21 post-tumor). (E) Radiance of tumor bioluminescence following orthotopic injection of a CB+KPC clone (KPC3b) and following αPD-L1 treatment. Data are mean ± SEM. *p < 0.05 (unpaired two-tailed Student’s t test). n = 5 mice per group. (F) Radiance of tumor bioluminescence following orthotopic injection of a CB+KPC clone (KPC2a) and following treatment with either αPD-1 or αPD-L1. Data are mean ± SEM. *p < 0.05 and **p < 0.005 (unpaired two-tailed Student’s t test). n = 5 mice per group. (G) Representative IF of CD8+ T cells, cytokeratin (CK+) tumor cells, and PD-L1 in wild-type mouse pancreas, primary tumor isolated from a genetically engineered KPC mouse, and KPC2a (CB+) orthotopic tumors isolated from B6 mice ± αPD-L1. Scale bars, 50 μM (left and middle columns) and 10 μM (right column, inset). (H) CD8+ T cell number per all nucleated cells in IF sections. Data are mean ± SEM. n = 3–5 mice per group. (I) CD8+ T cell number per field of view in IF sections. Data are mean ± SEM. n = 3–5 mice per group. (J) PD-L1 intensity was quantified through pixel intensity measurement by Fiji 2.0. Data in (H)–(J) are mean ± SEM. *p < 0.05, **p < 0.005, and ***p < 0.005 (one-way ANOVA, with a post hoc test to correct for multiple comparisons). Data are representative of n = 3–6 mice per group. See also Figure S1.
Figure 2.
Figure 2.. CB Expression Is Required for Immune Checkpoint Blockade Response
(A) Representative ultrasound images of pancreatic tumors in B6 mice orthotopically implanted with KPC2a (CB-eGFP+), KPC2 parental, or KPC2-eGFP tumor cells. Pancreas mass, yellow cross section; K, kidney; S, spleen. (B) Mean tumor volume ± SEM. n = 5 mice per cohort. *p < 0.05 and **p < 0.005 (unpaired two-tailed Student’s t test). (C) Kaplan-Meier survival curve of mice bearing orthotopic tumors. Significance was determined using a log rank (Mantel-Cox) test. n = 5 per group. (D) Mean tumor weight in grams ± SEM at day 22 or at endpoint (EP; tumors > 500 mm3). Each dot is an independent mouse. n = 5 mice per group. *p < 0.05 (unpaired two-tailed Student’s t test). (E) Mean tumor volume ± SEM of KPC2 parental or KPC-eGFP+ cells. n = 3–6 mice per group. (F) Kaplan-Meier survival curve of mice bearing KPC2 parental or KPC-eGFP+ orthotopic tumors ± αPD-L1. n = 3–6 mice per group. (G) Mean tumor weight in grams ± SEM at day 22 or at endpoint (EP; tumors > 500 mm3). Each dot is an independent mouse. n = 3–6 mice per group. (H) Representative histograms of the indicated cell surface proteins in KPC2 parental and KPC2a clones ± 48 h pre-treatment with recombinant mouse IFNγ. (I) Mean fluorescence intensity (MFI) of H-2Db, PD-L1, and mesothelin (Msln) expression by independent KPC parental tumor cells (n = 3) and their respective CB+ clones (KPC-CB) ± IFNγ. Each dot is an independent clone. Statistical significance was determined using Student’s t test to compare the induction of protein expression following IFNγ. *p < 0.05, **p < 0.005, and ***p < 0.005. Representative of two independent experiments.
Figure 3.
Figure 3.. Identification of an Immunodominant CB H-2Db Restricted Epitope
(A) Number of IFNγ-producing T cells per spleen from naive or peptide/αCD40/PolyI:C vaccinated C57BL/6 mice following ex vivo re-stimulation with the indicated peptide. Each dot is an independent mouse. n = 6 per group. *p < 0.05 (unpaired two-tailed Student’s t test). (B) Representative CD44 and IFNγ staining of splenic CD8+ T cells following ex vivo stimulation with CB101–109 peptide. Plots are gated on live, CD45+CD8+ T cells. (C) Tumor radiance from control or vaccinated B6 mice on days 7 (D7) and 14 (D14). (D) Gating strategy for validating fluorescently labeled CB101–109:H-2Db -tetramer-binding CD8+ T cells. (E) Representative CD44 and CB101–109:H-2Db -tetramer staining of splenocytes isolated from naive and CB101–109-immunized mice at day 7 post-vaccination. Plots are gated on live, CD45+ CD8+ Dump− T cells as shown in Figure 3D. n = 6 mice per group. (F) Mean number of CB101–109-specific T cells per spleen in naive (−) or vaccinated B6 mice was determined by tetramer staining or measuring IFNγ-producing T cells in response to CB101–109 peptide ex vivo ± SEM. n = 4 mice per group. *p < 0.05 (one-way ANOVA, with a post hoc test to correct for multiple comparisons). (G) Representative plots of CB101–109:H-2Db and Ova257–264 :H-2Kb tetramer staining of naive B6 splenocytes following tetramer staining and magnetic bead-based tetramer enrichment. Gates are on live CD45+ CD8+ Dump− T cells. (H) Number of CB101–109:H-2Db- and Ova257–264:H-2Kb-specific T cells in naive B6 mice. Each dot is an independent mouse, and data are mean ± SEM. ***p < 0.0005 (unpaired two-tailed Student’s t test). See also Table S1 and Figure S2.
Figure 4.
Figure 4.. Immune Checkpoint Blockade Efficacy Requires the Recruitment of Systemic CB101–109:H-2Db-Specific T Cells
(A) Representative CB101–109:H-2Db-tetramer staining of blood, splenic, or intratumoral CD8+ T cells ± αPD-L1 at the indicated time points post-tumor implantation. (B) Mean frequency of tetramer+ T cells of total CD8+ T cells in spleen (spl) or tumor (Tu) ± SEM on days 7, 14, 22, and 43 post-tumor implantations. n = 4 or 5 mice per group. **p < 0.005 and ***p < 0.0005 (unpaired two-tailed Student’s t test). (C–E) Mean frequency of tetramer+ T cells of total CD8+ T cells ± αPD-L1 in blood (C), spleen (D), and tumor (E). Error bars are SEM. n = 3–6 mice per group. *p < 0.05 and **p < 0.005 (unpaired two-tailed Student’s t test). (F–H) Mean CB101–109:H-2Db-specific T cell number in blood (F), spleen (G), and tumor (H) following tumor implantation. Error bars are SEM. n = 3–6 mice per group. **p < 0.005 (unpaired two-tailed Student’s t test). (I) Representative plots of PD-1 and Ki67 staining gated on tetramer+CD8+ T cells at day 14. (J and K) Proportion of CD8+tetramer+ T cells that express Ki67 in spleen (J) and tumor (K). Error bars are SEM. n = 4 or 5 mice per group. *p < 0.05 (unpaired two-tailed Student’s t test). (L) Timeline for FTY720 treatment (black arrowhead) and αPD-L1 (red arrow). (M) Representative images of tumor radiance at 7 and 14 days post-KPC2a injection. n = 3 mice per group. (N) Tumor weight in grams at 14 days post-orthotopic KPC2a injection. n = 3 mice per group. *p < 0.05 (one-way ANOVA, with a post hoc test to correct for multiple comparisons). Data are mean ± SEM. See also Figure S3.
Figure 5.
Figure 5.. Rapid Intratumoral and Progressive Systemic Dysfunction of Neoantigen-Specific T Cells
(A) Frequency of PD-1, Lag3, Tim3, and TIGIT expression by tetramer+ T cells in the spleen (Spl) and tumor (Tum) at day 22 post-tumor implantation. Each dot is an independent mouse, and data are mean ± SEM. *p < 0.05, **p < 0.05, and ***p < 0.005 (one-way ANOVA, with a post hoc test to correct for multiple comparisons). (B) Representative plots of markers quantified in (A). (C) Mean frequency of CB101–109:H-2Db-specific CD8+ T cells that express none (0), one (PD-1), or co-express 2, 3, or 4 inhibitory receptors at day 22. (D) Proportion of total CD8+ T cells producing IFNγ following ex vivo re-stimulation with CB101–109 peptide at day 22. (E) Number of tetramer+ T cells producing IFNγ at day 22. Data are mean ± SEM, and each dot is an independent mouse. *p < 0.05 (one-way ANOVA, with a post hoc test to correct for multiple comparisons). (F) Progressive phenotypic and functional changes in splenic tetramer+ CD8+ T cells in mice bearing KPC2a tumors ± αPD-L1. Data are mean ± SEM. n = 4 or 5 mice per group. (G) Progressive phenotypic and functional changes in intratumoral tetramer+ CD8+ T cells. Data are mean ± SEM. *p < 0.05 (unpaired two-tailed Student’s t test). n = 4 or 5 mice per group. (H) Analysis of the indicated antigens on circulating tetramer+ T cells following αPD-L1 treatment. Data are mean ± SEM. n = 4 or 5 mice per group. See also Figure S4.
Figure 6.
Figure 6.. Combined PD-L1 + PD1 Blockade Promotes Tumor Eradication and T Cell Persistence in the Absence of Antigen
(A) Radiance of tumor growth in mice treated with either αPD-L1 or αPD1, combination αPD-L1 + αPD1 (dual). Gray box indicates treatment period. Each line is an independent mouse. Arrow indicates unexpected death. (B) Number of tetramer+ T cells per milliliter in blood and mean tumor radiance. Symbol indicates that some mice were euthanized because of tumor growth. Data are mean ± SEM for tetramer number. Data are mean for tumor radiance. (C) Kaplan-Meier survival curve of mice in (A) and (B). n = 4 or 5 mice per group. (D) Proportion of tetramer+ T cells (gated on live CD45+CD8+ T cells) in blood at the weeks (W) post-tumor. LTS, long-term survivors. (E) Proportion of intratumoral tetramer+ T cells that express KLRG1 and/or Lag3 at day 14. Single, αPD-L1 only. (F) Quantification of groups in (E). Data are mean ± SEM. *p < 0.05, **p < 0.005, and ***p < 0.0005 (one-way ANOVA with a Tukey post hoc test). (G) Proportion of CD8+ T cells that produce TNFα following CB101–109 peptide re-stimulation ex vivo. (H) Proportion of CD8+ T that produce the indicated cytokines from tumors in mice treated with single (αPD-L1) or dual (αPD-L1 + αPD-1) blockade at day 14. Data are mean ± SEM. *p < 0.05, **p < 0.005, and ***p < 0.0005 (one-way ANOVA with a Tukey post hoc test). (I) Number of CD8+ T cells per gram that produce TNFα from mice treated with single or dual therapy at day 14. Each dot is an independent mouse. Data are mean ± SEM. *p < 0.05, **p < 0.005, and ***p < 0.0005 (one-way ANOVA with a Tukey post hoc test). See also Figure S5. (J) Tumor radiance following delayed single (αPD-L1) or delayed dual (αPD-L1 + αPD-1) blockade beginning day 14 post-tumor implantation. Significant difference in tumor size at day 21 was assessed using an unpaired two-tailed Student’s t test. Data are mean ± SEM. (K) Kaplan-Meier survival curve of mice in treated as in (J). Control group is the same animals shown in (C). Survival prolongation for delay dual (MST 42 days) versus untreated (MST 22 days) was determined by a log rank test. See also Figure S5.
Figure 7.
Figure 7.. Tumor Escape Variants Fail to Express MHC I because of a Defect in Tap1 following IFNγ
(A) IF staining for tumor cells (CK+), PD-L1, and CD8 in KPC2a tumors in control (−) or αPD-L1 (+) at the indicated time points. Tumors were not easily identifiable in the mice that received αPD-L1 at day 14. Scale bar, 50 μM. (B) Cell surface expression of indicated proteins ± IFNγ treatment in parental KPC2 cells, KPC2a clone prior to implantation (pre-transfer), and two independent KPC2a escape variants. Representative of n = 2 independent experiments. (C) Fold induction of antigen processing and/or presentation genes following IFNγ treatment in parental KPC2 cells, KPC2a pre-transfer (KPC2a-PT), and four independently re-derived KPC2a escape variants (KPC2a-EV). Data are mean ± SEM. (D) Gene expression in cell lines from Figure 7C without IFNγ treatment normalized to housekeeping gene ATP5b. Note that a higher the delta Ct indicates lower target gene expression relative to ATP5b. All qPCR data were performed in triplicate.

Similar articles

Cited by

References

    1. Ahonen CL, Doxsee CL, McGurran SM, Riter TR, Wade WF, Barth RJ, Vasilakos JP, Noelle RJ, and Kedl RM (2004). Combined TLR and CD40 triggering induces potent CD8+ T cell expansion with variable dependence on type I IFN. J. Exp. Med 199, 775–784. - PMC - PubMed
    1. Altman JD, Moss PA, Goulder PJ, Barouch DH, McHeyzer-Williams MG, Bell JI, McMichael AJ, and Davis MM (1996). Phenotypic analysis of antigen-specific T lymphocytes. Science 274, 94–96. - PubMed
    1. Bailey P, Chang DK, Nones K, Johns AL, Patch AM, Gingras MC, Miller DK, Christ AN, Bruxner TJ, Quinn MC, et al.; Australian Pancreatic Cancer Genome Initiative (2016). Genomic analyses identify molecular subtypes of pancreatic cancer. Nature 531, 47–52. - PubMed
    1. Balachandran VP, quksza M, Zhao JN, Makarov V, Moral JA, Remark R, Herbst B, Askan G, Bhanot U, Senbabaoglu Y, et al.; Australian Pancreatic Cancer Genome Initiative; Garvan Institute of Medical Research; Prince of Wales Hospital; Royal North Shore Hospital; University of Glasgow; St Vincent’s Hospital; QIMR Berghofer Medical Research Institute; University of Melbourne, Centre for Cancer Research; University of Queensland, Institute for Molecular Bioscience; Bankstown Hospital; Liverpool Hospital; Royal Prince Alfred Hospital, Chris O’Brien Lifehouse; Westmead Hospital; Fremantle Hospital; St John of God Healthcare; Royal Adelaide Hospital; Flinders Medical Centre; Envoi Pathology; Princess Alexandria Hospital; Austin Hospital; Johns Hopkins Medical Institutes; ARC-Net Centre for Applied Research on Cancer (2017). Identification of unique neoantigen qualities in long-term survivors of pancreatic cancer. Nature 551, 512–516. - PMC - PubMed
    1. Bellone G, Turletti A, Artusio E, Mareschi K, Carbone A, Tibaudi D, Robecchi A, Emanuelli G, and Rodeck U (1999). Tumor-associated transforming growth factor-beta and interleukin-10 contribute to a systemic Th2 immune phenotype in pancreatic carcinoma patients. Am. J. Pathol 155, 537–547. - PMC - PubMed

Publication types

MeSH terms