. 2019 Dec;38(49):7367-7383.
doi: 10.1038/s41388-019-0957-5. Epub 2019 Aug 16.

Rapamycin-upregulated miR-29b promotes mTORC1-hyperactive cell growth in TSC2-deficient cells by downregulating tumor suppressor retinoic acid receptor β (RARβ)

Affiliations

Rapamycin-upregulated miR-29b promotes mTORC1-hyperactive cell growth in TSC2-deficient cells by downregulating tumor suppressor retinoic acid receptor β (RARβ)

Heng-Jia Liu et al. Oncogene. 2019 Dec.

Abstract

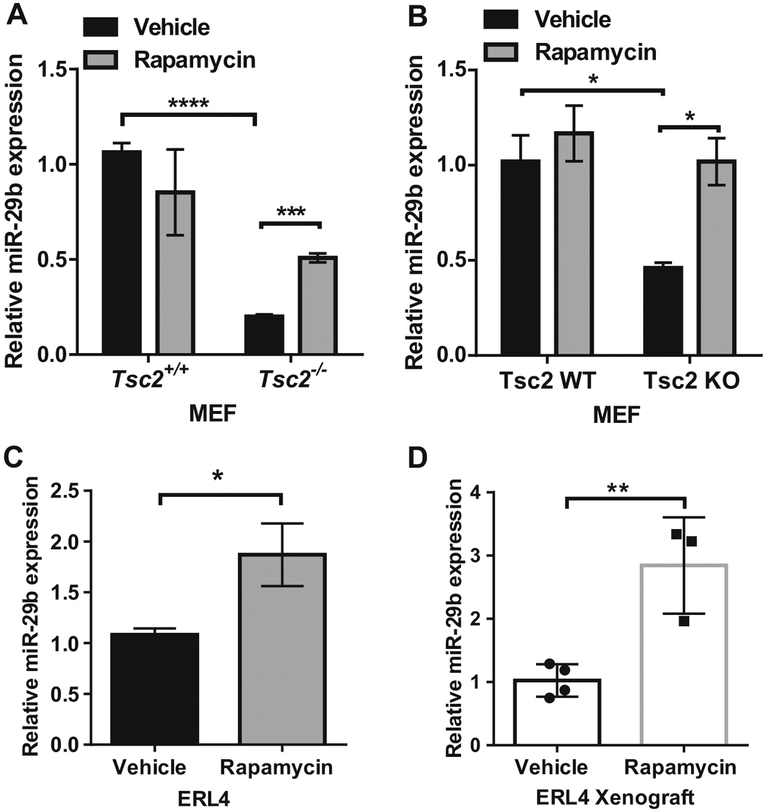
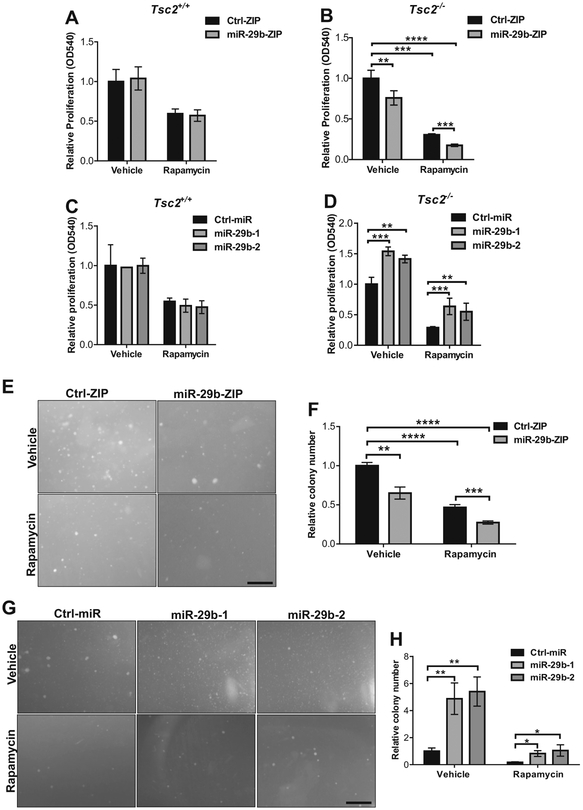
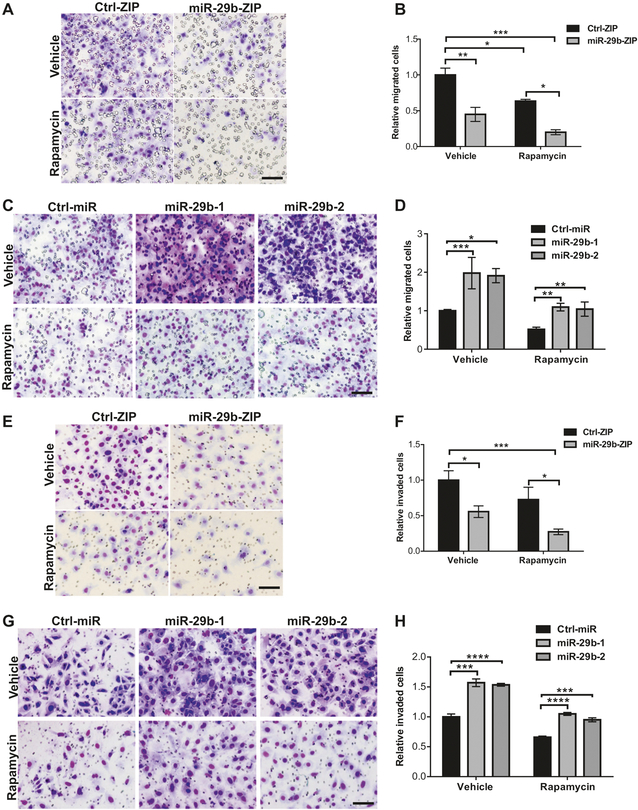
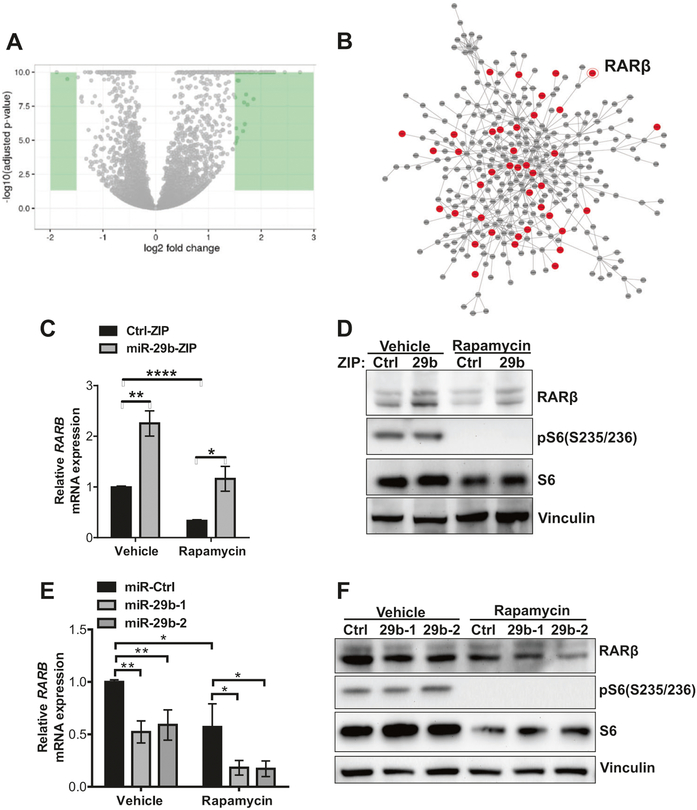
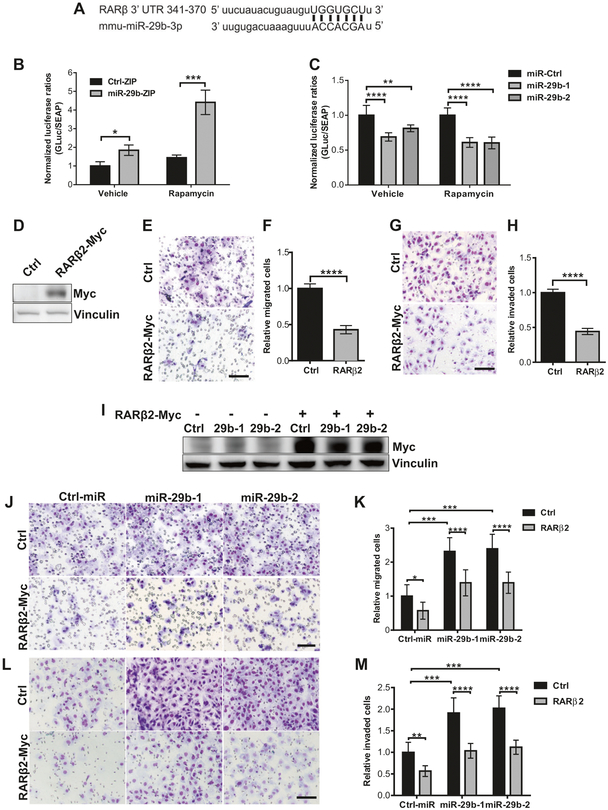
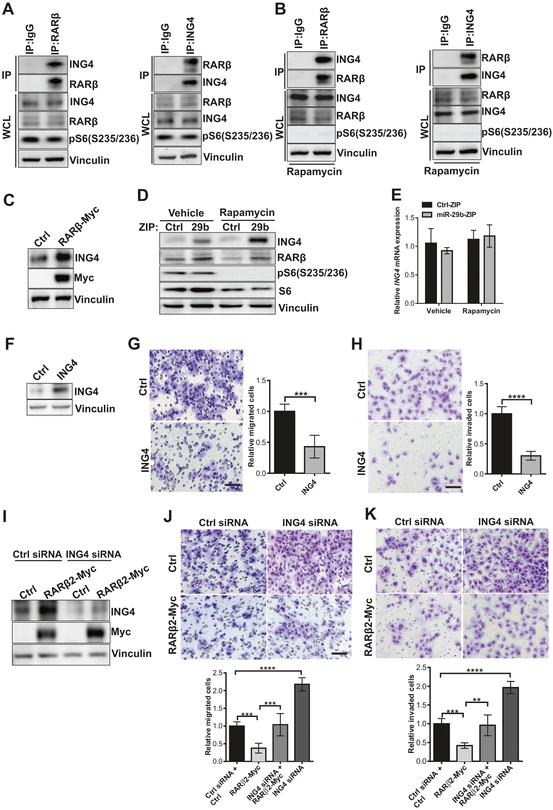
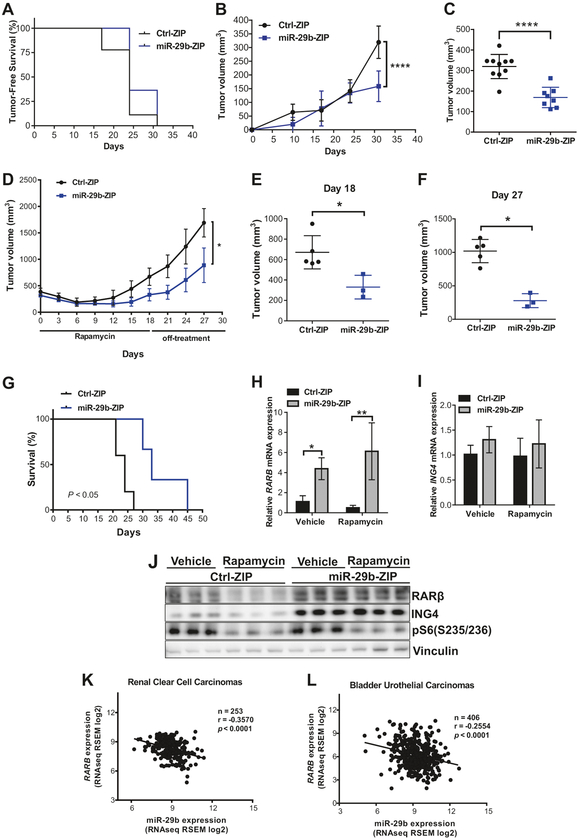
miR-29b has been identified as a rapamycin-induced microRNA (miRNA) in Tsc2-deficient, mTORC1-hyperactive cells. The biological significance of this induction of miR-29b is unknown. We have found that miR-29b acts as an oncogenic miRNA in Tsc2-deficient cells: inhibition of miR-29b suppressed cell proliferation, anchorage-independent cell growth, cell migration, invasion, and the growth of Tsc2-deficient tumors in vivo. Importantly, the combination of miR-29b inhibition with rapamycin treatment further inhibited these tumor-associated cellular processes. To gain insight into the molecular mechanisms by which miR-29b promotes tumorigenesis, we used RNA sequencing to identify the tumor suppressor retinoid receptor beta (RARβ) as a target gene of miR-29b. We found that miR-29b directly targeted the 3'UTR of RARβ. Forced expression of RARβ reversed the effects of miR-29b overexpression in proliferation, migration, and invasion, indicating that it is a critical target. miR-29b expression correlated with low RARβ expression in renal clear cell carcinomas and bladder urothelial carcinomas, tumors associated with TSC gene mutations. We further identified growth family member 4 (ING4) as a novel interacting partner of RARβ. Overexpression of ING4 inhibited the migration and invasion of Tsc2-deficient cells while silencing of ING4 reversed the RARβ-mediated suppression of cell migration and invasion. Taken together, our findings reveal a novel miR-29b/RARβ/ING4 pathway that regulates tumorigenic properties of Tsc2-deficient cells, and that may serve as a potential therapeutic target for TSC, lymphangioleiomyomatosis (LAM), and other mTORC1-hyperactive tumors.


Conflict of interest statement

Conflict of interest The authors declare that they have no conflict of interest.

Figures

Fig. 1
Fig. 1
Rapamycin upregulates miR-29b expression in Tsc2-deficient but not Tsc2 wild-type cells in vitro and in vivo. miR-29b expression was assessed by RT-qPCR in Tsc2+/+ or Tsc2−/− MEFs (a), Wild-type or Tsc2 knockout MEFs (b), and in Tsc2-deficient rat ERL4 cells (c), treated with vehicle (DMSO) or rapamycin (20 nM) for 24 h. Data are presented as mean fold change in miR-29b expression ± SD relative to Tsc2+/+ MEFs, Tsc2 WT MEFs, or ERL4 treated with vehicle. Results are from n = 3 biological replicates. Data are presented as mean ± SD. Data for bar graphs were calculated using two-way ANOVA followed by Bonferroni’s posttest for multiple comparisons. d Mice bearing ERL4 xenograft tumors were treated intraperitoneally with rapamycin (3 mg/kg) or vehicle every other day for 6 days (vehicle: n = 3, rapamycin: n = 4). Tumors were harvested 4 h after the last treatment and miR-29b expression was examined by RT-qPCR. Data are presented as mean ± SD. Statistical significance was determined by Mann–Whitney’s U test. *P < 0.05; **P < 0.01; ***P < 0.001; ****P < 0.0001
Fig. 2
Fig. 2
miR-29b regulates cell growth in Tsc2-deficient, but not Tsc2 wild-type cells. Cell proliferation was assessed by crystal violet staining in Tsc2+/+ (a) or Tsc2−/− (b) MEFs stably expressing miR-29b-ZIP or Ctrl-ZIP following treatment with rapamycin (20 nM) or vehicle (DMSO) for 72 h. Data are presented as mean fold change in OD 540 ± SD relative to Ctrl-ZIP cells treated with vehicle of n = 3 biological replicates. Cell proliferation was assessed by crystal violet staining in Tsc2+/+ (c) or Tsc2−/− (d) MEFs stably overexpressing pre-miR-29b-1 (miR-29b-1), pre-miR-29b-2 (miR-29b-2) or Ctrl-miR following treatment with rapamycin (20 nM) or vehicle (DMSO) for 72 h. Data are presented as mean fold change in OD 540 ± SD relative to Ctrl-miR cells treated with vehicle of three independent experiments. e Representative images of Tsc2−/− MEFs stably expressing Ctrl-ZIP or miR-29b-ZIP grown in soft agar with addition of vehicle (DMSO) or rapamycin (5 nM) for 2 weeks. f Data are presented as mean fold change in colony number ± SD relative to Ctrl-ZIP treated with vehicle of n = 3 biological replicates. g Representative images of Tsc2−/− MEFs stably overexpressing pre-miR-29b-1 (miR-29b-1), pre-miR-29b-2 (miR-29b-2), or Ctrl-miR grown in soft agar with addition of vehicle (DMSO) or rapamycin (5 nM) for 2 weeks. h Data are presented as mean fold change in colony number ± SD relative to Ctrl-miR treated with vehicle of n = 3 biological replicates. Data for bar graphs were calculated using two-way ANOVA followed by Bonferroni’s posttest for multiple comparisons. Scale bar = 500 μm. *P < 0.05; **P < 0.01; ***P < 0.001
Fig. 3
Fig. 3
miR-29b regulates cell migration and invasion in Tsc2-deficient cells. a Representative images of the transwell assay with decreased migration towards 10% FBS-containing growth medium of Tsc2−/− MEFs with miR-29b inhibition (miR-29b-ZIP) treated with vehicle (DMSO) or rapamycin (20 nM) for 6 h. b Mean fold change of the number of migrated cells ± SD relative to vehicle-treated Ctrl-ZIP of n = 3 biological replicates. c Representative images of the transwell assay with increased migration towards 10% FBS-containing growth medium of Tsc2−/− MEFs stably overexpressing miR-29b-1 or miR-29b-2. d Mean fold change of number of migrated cells ± SD relative to vehicle-treated Ctrl-miR of n = 3 biological replicates. e Representative images of the Boyden chamber invasion assay, showing decreased invasive capacity of Tsc2−/− MEFs with miR-29b inhibition (miR-29b-ZIP) treated with vehicle (DMSO) or rapamycin (20 nM) for 24 h. f Mean fold change of number of invaded cells ± SD relative to vehicle-treated Ctrl-ZIP of n = 3 biological replicates. g Representative images of the Boyden chamber invasion assay, showing increased invasive capacity of Tsc2−/− MEFs stably overexpressing miR-29b-1 or miR-29b-2. h Mean fold change of number of invaded cells ± SD relative to vehicle-treated Ctrl-miR of n = 3 biological replicates. Data for bar graphs were calculated using two-way ANOVA followed by Bonferroni’s posttest for multiple comparisons. Scale bar = 85 μm. *P < 0.05; **P < 0.01; ***P < 0.001; ****P < 0.0001
Fig. 4
Fig. 4
RNA sequencing identifies RARβ is a candidate target of miR-29b. a Volcano plot comparing changes in gene expression (as log2 fold change of fragments per kilobase of transcript per million mapped reads) of Tsc2−/− MEFs stably expressing miR-29-ZIP versus Ctrl-ZIP treated with rapamycin (20 nM) for 24 h. Green color highlights genes that were differentially regulated by log2 fold change > 1.5. b Interactome analysis of transcripts that are differentially regulated by miR-29b knockdown. Red indicates predicted direct targets and gray indicates indirect targets of miR-29b. c–f RARβ mRNA and protein levels were assessed in Tsc2−/− MEFs stably expressing miR-29b-ZIP or Ctrl-ZIP (c, d), or overexpressing miR-29b-1, miR-29b-2, or miR-Ctrl (e–f) treated with vehicle (DMSO) or rapamycin (20 nM) for 24 h. Data are presented as mean fold change ± SD relative to vehicle-treated controls of n = 3 biological replicates. Data for bar graphs were calculated using two-way ANOVA followed by Bonferroni’s posttest for multiple comparisons. *P <0.05; **P < 0.01; ****P <0.0001
Fig. 5
Fig. 5
RARβ is a direct and functionally important target of miR-29b. a Sequence of mouse RARβ 3′UTR (nucleotide 341–370) showing the putative miR-29b-3p-binding site. Matching regions are indicated by lines. Dual-luciferase assay of Tsc2−/− MEFs stably expressing miR-29b-ZIP or Ctrl-ZIP (b), or overexpressing miR-29b-1, miR-29b-2 or miR-Ctrl (c) transfected with secreted Gaussia luciferase constructs containing the 3′UTR of RARβ for 24 h. Cells were then treated with vehicle (DMSO) or rapamycin (20 nM) for another 24 h. Secreted Gaussia luciferase activity was normalized to secreted alkaline phosphatase activity. Data are presented as relative luciferase activity ± SD relative to Ctrl-ZIP or Ctrl-miR treated with vehicle or rapamycin of n = 3 biological replicates. Data for bar graphs were calculated using one-way ANOVA followed by Bonferroni’s posttest for multiple comparisons. d Western blot analysis of Tsc2−/− MEFs transiently transfected with control vector or RARβ2-Myc-DDK. Vinculin was used as a loading control. e Representative images of migrated Tsc2−/− MEFs transiently transfected with control vector or RARβ2-Myc-DDK towards 10% FBS-containing growth medium. f Mean fold change of number of migrated cells ± SD relative to vector controls of n = 3 biological replicates and statistical significance was determined by two-tailed student’s t-test. g Representative images Boyden chamber invasion assays of Tsc2−/− MEFs transiently overexpressing RARβ2-Myc-DDK showing decreased cell invasion. h Mean fold change of number of invaded cells ± SD relative to vector controls of n = 3 biological replicates and statistical significance was determined by two-tailed student’s t-test. i Western blot analysis showing successful restoration of RARβ2 in Tsc2−/− MEFs overexpressing miR-29b-1 or miR-29b-2 transfected with RARβ2-Myc-DDK. Vinculin was used as a loading control. j Representative images of the transwell migration assay of Tsc2−/− MEFs overexpressing miR-29b-1 or miR-29b-2 with and without restoration of RARβ2. k Mean fold change of number of migrated cells ± SD relative to vector controls/control siRNA of n = 3 biological replicates. l Representative images of Boyden chamber invasion assays demonstrating RARβ restoration decreased the invasion of Tsc2−/− MEFs overexpressing miR-29b-1 or miR-29b-2. m Mean fold change of number of migrated cells ± SD relative to vector controls/control siRNA of n = 3 biological replicates. Scale bar = 85 μm. Data for bar graphs were calculated using two-way ANOVA followed by Bonferroni’s posttest for multiple comparisons. *P < 0.05; **P < 0.01; ***P < 0.001; ****P < 0.0001
Fig. 6
Fig. 6
ING4 physically interacts with RARβ. a Western blots of Tsc2 −/− MEFs lysed and immunoprecipitated with RARβ, ING4, or rabbit IgG overnight, then incubated with Protein G Sepharose for 2 h. Immunoprecipitated proteins (IP) or whole cell lysates (WCL) were immunoblotted with RARβ, ING4, pS6, or vinculin. Results are representative of three independent experiments. b Tsc2−/− MEFs stably expressing miR-29b-ZIP were treated with rapamycin (20 nM) for 24 h. Cells were lysed, immunoprecipitated, and immunoblotted as described in a. c Tsc2−/− MEFs transiently transfected with control vector or RARβ2-Myc-DDK were analyzed by immunoblotting using Myc, ING4 or vinculin antibodies. d Immunoblot analysis of ING4 protein expression in Tsc2−/− MEFs stably expressing miR-29b-ZIP or Ctrl-ZIP treated with vehicle or rapamycin (20 nM) for 24 h. e ING4 mRNA expression was assessed by RT-qPCR in Tsc2−/− MEFs stably expressing miR-29b-ZIP or Ctrl-ZIP treated with vehicle or rapamycin (20 nM) for 24 h. Data are presented as mean ± SD relative to vehicle-treated Ctrl-ZIP of n = 3 biological replicates. Data for bar graphs were calculated using two-way ANOVA followed by Bonferroni’s posttest for multiple comparisons. f Tsc2−/− MEFs transiently transfected with control vector or ING4 were analyzed by immunoblotting using ING4 or vinculin antibodies. g Migration of Tsc2−/− MEFs transiently transfected with control vector or ING4 towards 10% FBS-containing growth medium. Data are presented as mean ± SD relative to vehicle-treated Ctrl of n = 3 biological replicates. Statistical significance was determined by two-tailed student’s t-test. h Invasion of Tsc2−/− MEFs overexpressing ING4 or control towards 10% FBS-containing growth medium. Data are presented as mean ± SD relative to vehicle-treated Ctrl of n = 3 biological replicates. Statistical significance was determined by two-tailed student’s t-test. i Tsc2−/− MEFs transiently transfected with the indicated constructs and/or siRNA were analyzed by immunoblotting using ING4, myc or vinculin antibodies. j Migration of Tsc2−/− MEFs transiently transfected with the indicated constructs and/or siRNA towards 10% FBS-containing growth medium. Data are presented as mean ± SD relative to vehicle-treated Ctrl siRNA + Ctrl of n = 3 biological replicates. Statistical significance was determined by one-way ANOVA followed by Bonferroni’s posttest for multiple comparisons. k Invasion of Tsc2−/− MEFs transiently transfected with the indicated constructs and/or siRNA towards 10% FBS-containing growth medium. Data are presented as mean ± SD relative to vehicle-treated Ctrl siRNA + Ctrl of n = 3 biological replicates. Statistical significance was determined by one-way ANOVA followed by Bonferroni’s posttest for multiple comparisons. Scale bar = 85 μm. **P < 0.01; ***P < 0.001; ****P <0.0001
Fig. 7
Fig. 7
miR-29b functions as an oncomiR in vivo and miR-29b levels are inversely correlated with RARβ expression in human tumors. a–c Mice were subcutaneously injected with 2 × 10⁶ Tsc2-deficient ERL4 cells expressing miR-29b-ZIP or Ctrl-ZIP. miR-29b-ZIP (n = 19) expressing tumors showed no difference in tumor-free survival compared with Ctrl-ZIP (n = 20). Statistical significance was determined by Log-rank test (a). Tumor growth was analyzed by caliper measurement over 30 days (b). Mean tumor volume ± SD 30 days post injection indicated miR-29b-ZIP-expressing cells formed smaller tumors. Statistical significance was determined by Mann–Whitney’s U test (c). d–g miR-29b-ZIP (n = 3) or Ctrl-ZIP (n = 5) tumors 300–400 mm3 in size were subjected to rapamycin treatment (3 mg/kg, every 2 days for 3 weeks and 9 treatments in total). Tumor growth was analyzed by caliper measurement during rapamycin treatment and 9 days following rapamycin cessation and data are presented as mean ± SD. Statistical significance was determined by Mann–Whitney’s U test (d). Mean individual tumor volume ± SD 18 days after rapamycin treatment began. Statistical significance was determined by Mann–Whitney’s U test (e). The average tumor volume difference of miR-29b-ZIP or Ctrl-ZIP after the last rapamycin treatment (day 18) and the final measurement (day 27) is shown and data are presented as mean ± SD. Statistical significance was determined by Mann–Whitney’s U test (f). Survival analysis of mice-bearing miR-29b-ZIP or Ctrl-ZIP tumors treated by rapamycin and statistical significance was determined by Log-rank test (g). h–i miR-29b-ZIP or Ctrl-ZIP tumors 300–400 mm3 in size were subjected to short-term vehicle or rapamycin treatment (3 mg/kg, every 2 days for 3 treatments). Tumor RNA was extracted and analyzed for mRNA expression of RARβ (h) or ING4 (i). Data are presented as mean ± SD relative to vehicle-treated Ctrl-ZIP of n = 3. Data for bar graphs were calculated using two-way ANOVA followed by Bonferroni’s posttest for multiple comparisons. Tumor tissue lysates were prepared and analyzed by immunoblotting with RARβ, ING4, pS6, or vinculin antibodies. *P < 0.05; **P < 0.01; ****P < 0.0001. Comparison of miR-29b and RARβ expression levels in renal clear cell carcinomas (n = 253) (k) and bladder urothelial carcinomas (n = 406) (l) from TCGA. Pearson correlation coefficient (r) and values are indicated

Similar articles

Cited by

References

    1. Henske EP, Jozwiak S, Kingswood JC, Sampson JR, Thiele EA. Tuberous sclerosis complex. Nat Rev Dis Prim. 2016;2:16035. - PubMed
    1. Ben-Sahra I, Manning BD. mTORC1 signaling and the metabolic control of cell growth. Curr Opin Cell Biol. 2017;45:72–82. - PMC - PubMed
    1. Cheadle JP, Reeve MP, Sampson JR, Kwiatkowski DJ. Molecular genetic advances in tuberous sclerosis. Hum Genet. 2000;107:97–114. - PubMed
    1. Carsillo T, Astrinidis A, Henske EP. Mutations in the tuberous sclerosis complex gene TSC2 are a cause of sporadic pulmonary lymphangioleiomyomatosis. Proc Natl Acad Sci USA. 2000;97:6085–90. - PMC - PubMed
    1. Rosset C, Netto CBO, Ashton-Prolla P. TSC1 and TSC2 gene mutations and their implications for treatment in tuberous sclerosis complex: a review. Genet Mol Biol. 2017;40:69–79. - PMC - PubMed

Publication types

MeSH terms