

Deprivation of Muscleblind-Like Proteins Causes Deficits in Cortical Neuron Distribution and Morphological Changes in Dendritic Spines and Postsynaptic Densities
- PMID: 31417371
- PMCID: PMC6682673
- DOI: 10.3389/fnana.2019.00075
Deprivation of Muscleblind-Like Proteins Causes Deficits in Cortical Neuron Distribution and Morphological Changes in Dendritic Spines and Postsynaptic Densities
Abstract
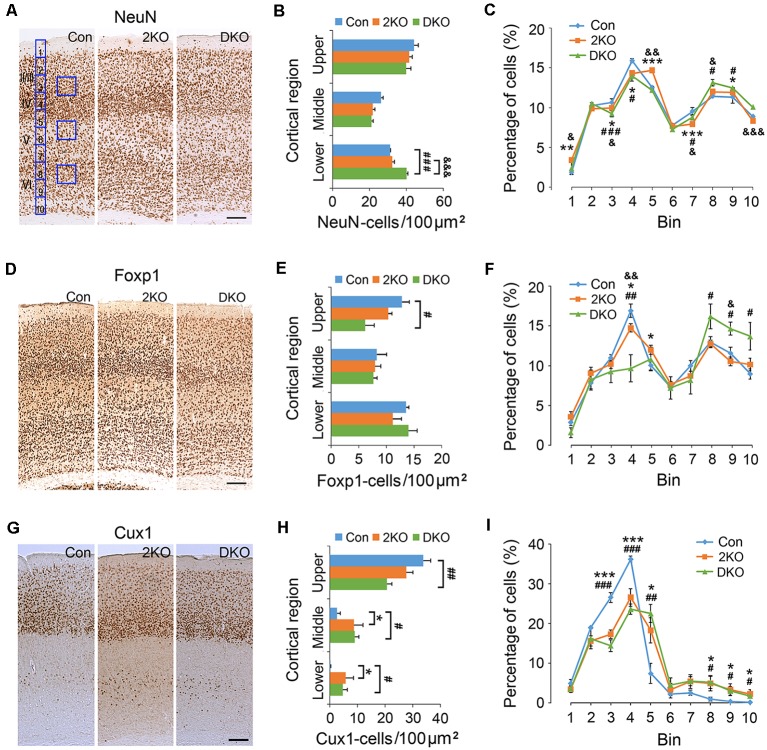
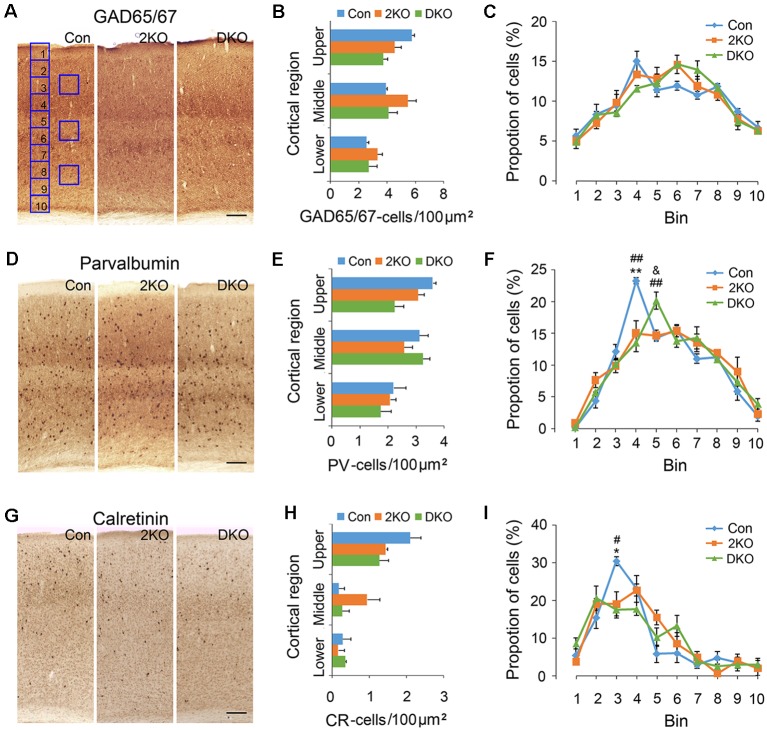
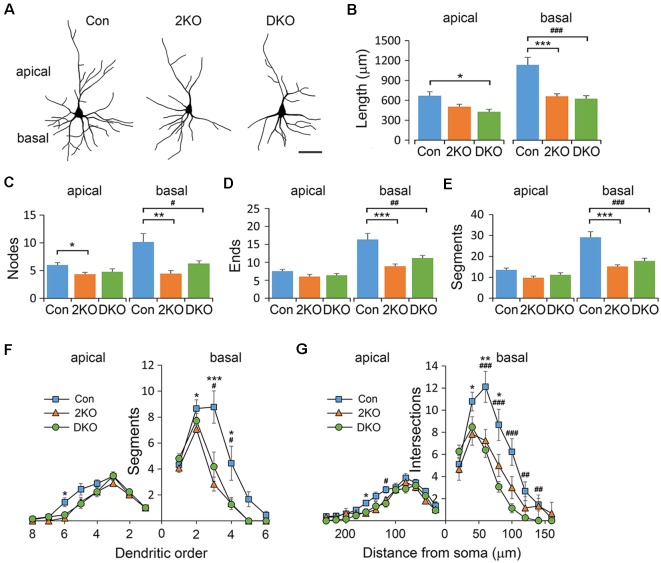
Myotonic dystrophy (Dystrophia Myotonica; DM) is the most common adult-onset muscular dystrophy and its brain symptoms seriously affect patients' quality of life. It is caused by extended (CTG)n expansions at 3'-UTR of DMPK gene (DM type 1, DM1) or (CCTG)n repeats in the intron 1 of CNBP gene (DM type 2, DM2) and the sequestration of Muscleblind-like (MBNL) family proteins by transcribed (CUG)n RNA hairpin is the main pathogenic mechanism for DM. The MBNL proteins are splicing factors regulating posttranscriptional RNA during development. Previously, Mbnl knockout (KO) mouse lines showed molecular and phenotypic evidence that recapitulate DM brains, however, detailed morphological study has not yet been accomplished. In our studies, control (Mbnl1 +/+; Mbnl2 cond/cond; Nestin-Cre -/-), Mbnl2 conditional KO (2KO, Mbnl1 +/+; Mbnl2 cond/cond; Nestin-Cre +/-) and Mbnl1/2 double KO (DKO, Mbnl1 ΔE3/ΔE3; Mbnl2 cond/cond; Nestin-Cre +/-) mice were generated by crossing three individual lines. Immunohistochemistry for evaluating density and distribution of cortical neurons; Golgi staining for depicting the dendrites/dendritic spines; and electron microscopy for analyzing postsynaptic ultrastructure were performed. We found distributional defects in cortical neurons, reduction in dendritic complexity, immature dendritic spines and alterations of postsynaptic densities (PSDs) in the mutants. In conclusion, loss of function of Mbnl1/2 caused fundamental defects affecting neuronal distribution, dendritic morphology and postsynaptic architectures that are reminiscent of predominantly immature and fetal phenotypes in DM patients.
Keywords: cortical neurons; dendrites; interneurons; muscleblind-like knockouts; myotonic dystrophy; postsynaptic densities.
Figures


Similar articles
-
Zebrafish deficient for Muscleblind-like 2 exhibit features of myotonic dystrophy.Dis Model Mech. 2011 May;4(3):381-92. doi: 10.1242/dmm.004150. Epub 2011 Feb 8. Dis Model Mech. 2011. PMID: 21303839 Free PMC article.
-
Mice lacking MBNL1 and MBNL2 exhibit sudden cardiac death and molecular signatures recapitulating myotonic dystrophy.Hum Mol Genet. 2022 Sep 10;31(18):3144-3160. doi: 10.1093/hmg/ddac108. Hum Mol Genet. 2022. PMID: 35567413 Free PMC article.
-
Compound loss of muscleblind-like function in myotonic dystrophy.EMBO Mol Med. 2013 Dec;5(12):1887-900. doi: 10.1002/emmm.201303275. Epub 2013 Oct 8. EMBO Mol Med. 2013. PMID: 24293317 Free PMC article.
-
The Muscleblind family of proteins: an emerging class of regulators of developmentally programmed alternative splicing.Differentiation. 2006 Mar;74(2-3):65-80. doi: 10.1111/j.1432-0436.2006.00060.x. Differentiation. 2006. PMID: 16533306 Review.
-
Muscle wasting in myotonic dystrophies: a model of premature aging.Front Aging Neurosci. 2015 Jul 9;7:125. doi: 10.3389/fnagi.2015.00125. eCollection 2015. Front Aging Neurosci. 2015. PMID: 26217220 Free PMC article. Review.
Cited by
-
MBL-1/Muscleblind regulates neuronal differentiation and controls the splicing of a terminal selector in Caenorhabditis elegans.PLoS Genet. 2024 Oct 18;20(10):e1011276. doi: 10.1371/journal.pgen.1011276. eCollection 2024 Oct. PLoS Genet. 2024. PMID: 39423233 Free PMC article.
-
Mechanisms of repeat-associated non-AUG translation in neurological microsatellite expansion disorders.Biochem Soc Trans. 2021 Apr 30;49(2):775-792. doi: 10.1042/BST20200690. Biochem Soc Trans. 2021. PMID: 33729487 Free PMC article. Review.
-
Brain Pathogenesis and Potential Therapeutic Strategies in Myotonic Dystrophy Type 1.Front Aging Neurosci. 2021 Nov 15;13:755392. doi: 10.3389/fnagi.2021.755392. eCollection 2021. Front Aging Neurosci. 2021. PMID: 34867280 Free PMC article. Review.
-
LD block disorder-specific pleiotropic roles of novel CRHR1 in type 2 diabetes and depression disorder comorbidity.Eur Arch Psychiatry Clin Neurosci. 2023 Dec 14. doi: 10.1007/s00406-023-01710-x. Online ahead of print. Eur Arch Psychiatry Clin Neurosci. 2023. PMID: 38092990
-
RNA-binding Protein MBNL2 regulates Cancer Cell Metastasis through MiR-182-MBNL2-AKT Pathway.J Cancer. 2021 Sep 21;12(22):6715-6726. doi: 10.7150/jca.62816. eCollection 2021. J Cancer. 2021. PMID: 34659561 Free PMC article.
References
LinkOut - more resources
Full Text Sources
Research Materials
Miscellaneous