

Somatic double-hit in MTOR and RPS6 in hemimegalencephaly with intractable epilepsy
- PMID: 31411685
- PMCID: PMC6935386
- DOI: 10.1093/hmg/ddz194
Somatic double-hit in MTOR and RPS6 in hemimegalencephaly with intractable epilepsy
Abstract
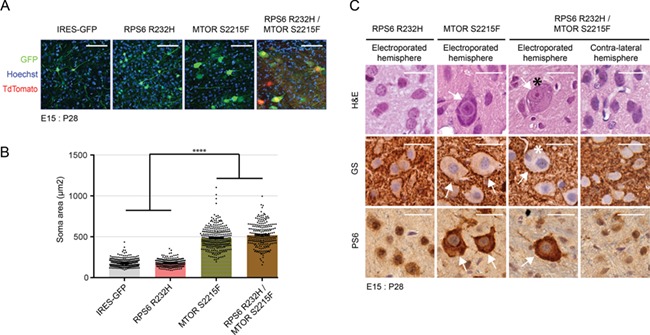
Single germline or somatic activating mutations of mammalian target of rapamycin (mTOR) pathway genes are emerging as a major cause of type II focal cortical dysplasia (FCD), hemimegalencephaly (HME) and tuberous sclerosis complex (TSC). A double-hit mechanism, based on a primary germline mutation in one allele and a secondary somatic hit affecting the other allele of the same gene in a small number of cells, has been documented in some patients with TSC or FCD. In a patient with HME, severe intellectual disability, intractable seizures and hypochromic skin patches, we identified the ribosomal protein S6 (RPS6) p.R232H variant, present as somatic mosaicism at ~15.1% in dysplastic brain tissue and ~11% in blood, and the MTOR p.S2215F variant, detected as ~8.8% mosaicism in brain tissue, but not in blood. Overexpressing the two variants independently in animal models, we demonstrated that MTOR p.S2215F caused neuronal migration delay and cytomegaly, while RPS6 p.R232H prompted increased cell proliferation. Double mutants exhibited a more severe phenotype, with increased proliferation and migration defects at embryonic stage and, at postnatal stage, cytomegalic cells exhibiting eccentric nuclei and binucleation, which are typical features of balloon cells. These findings suggest a synergistic effect of the two variants. This study indicates that, in addition to single activating mutations and double-hit inactivating mutations in mTOR pathway genes, severe forms of cortical dysplasia can also result from activating mutations affecting different genes in this pathway. RPS6 is a potential novel disease-related gene.
© The Author(s) 2019. Published by Oxford University Press. All rights reserved. For Permissions, please email: journals.permissions@oup.com.
Figures


Similar articles
-
Profiling PI3K-AKT-MTOR variants in focal brain malformations reveals new insights for diagnostic care.Brain. 2022 Apr 29;145(3):925-938. doi: 10.1093/brain/awab376. Brain. 2022. PMID: 35355055 Free PMC article.
-
Cortical Dysplasia and the mTOR Pathway: How the Study of Human Brain Tissue Has Led to Insights into Epileptogenesis.Int J Mol Sci. 2022 Jan 25;23(3):1344. doi: 10.3390/ijms23031344. Int J Mol Sci. 2022. PMID: 35163267 Free PMC article. Review.
-
Identification of a somatic mutation in the RHEB gene through high depth and ultra-high depth next generation sequencing in a patient with Hemimegalencephaly and drug resistant Epilepsy.Eur J Med Genet. 2019 Nov;62(11):103571. doi: 10.1016/j.ejmg.2018.11.005. Epub 2018 Nov 8. Eur J Med Genet. 2019. PMID: 30414531
-
Association of MTOR Mutations With Developmental Brain Disorders, Including Megalencephaly, Focal Cortical Dysplasia, and Pigmentary Mosaicism.JAMA Neurol. 2016 Jul 1;73(7):836-845. doi: 10.1001/jamaneurol.2016.0363. JAMA Neurol. 2016. PMID: 27159400 Free PMC article.
-
Infantile tauopathies: Hemimegalencephaly; tuberous sclerosis complex; focal cortical dysplasia 2; ganglioglioma.Brain Dev. 2015 Jun;37(6):553-62. doi: 10.1016/j.braindev.2014.08.010. Epub 2014 Oct 19. Brain Dev. 2015. PMID: 25451314 Review.
Cited by
-
Somatic mosaicism in the diseased brain.Mol Cytogenet. 2022 Oct 21;15(1):45. doi: 10.1186/s13039-022-00624-y. Mol Cytogenet. 2022. PMID: 36266706 Free PMC article. Review.
-
Somatic variants in diverse genes leads to a spectrum of focal cortical malformations.Brain. 2022 Aug 27;145(8):2704-2720. doi: 10.1093/brain/awac117. Brain. 2022. PMID: 35441233 Free PMC article.
-
Hyperactivation of mTORC1 in a double hit mutant zebrafish model of tuberous sclerosis complex causes increased seizure susceptibility and neurodevelopmental abnormalities.Front Cell Dev Biol. 2022 Sep 27;10:952832. doi: 10.3389/fcell.2022.952832. eCollection 2022. Front Cell Dev Biol. 2022. PMID: 36238691 Free PMC article.
-
International consensus recommendations on the diagnostic work-up for malformations of cortical development.Nat Rev Neurol. 2020 Nov;16(11):618-635. doi: 10.1038/s41582-020-0395-6. Epub 2020 Sep 7. Nat Rev Neurol. 2020. PMID: 32895508 Free PMC article. Review.
-
mTOR Pathway Somatic Pathogenic Variants in Focal Malformations of Cortical Development: Novel Variants, Topographic Mapping, and Clinical Outcomes.Neurol Genet. 2023 Oct 26;9(6):e200103. doi: 10.1212/NXG.0000000000200103. eCollection 2023 Dec. Neurol Genet. 2023. PMID: 37900581 Free PMC article.
References
-
- D'Gama A.M. and Walsh C.A. (2018) Somatic mosaicism and neurodevelopmental disease. Nat. Neurosci., 21, 1504–1514. - PubMed
-
- Qin W., Chan J.A., Vinters H.V., Mathern G.W., Franz D.N., Taillon B.E., Bouffard P. and Kwiatkowski D.J. (2010) Analysis of TSC cortical tubers by deep sequencing of TSC1, TSC2 and KRAS demonstrates that small second-hit mutations in these genes are rare events. Brain Pathol., 20, 1096–1105. - PMC - PubMed
-
- Baulac S., Ishida S., Marsan E., Miquel C., Biraben A., Nguyen D.K., Nordli D., Cossette P., Nguyen S., Lambrecq V. et al. (2015) Familial focal epilepsy with focal cortical dysplasia due to DEPDC5 mutations. Ann. Neurol., 77, 675–683. - PubMed
-
- D'Gama A.M., Woodworth M.B., Hossain A.A., Bizzotto S., Hatem N.E., LaCoursiere C.M., Najm I., Ying Z., Yang E., Barkovich A.J. et al. (2017) Somatic mutations activating the mTOR pathway in dorsal telencephalic progenitors cause a continuum of cortical dysplasias. Cell Rep., 21, 3754–3766. - PMC - PubMed
