. 2019 Nov 18;70(21):6337-6348.
doi: 10.1093/jxb/erz359.

Histone acetyltransferase GCN5-mediated regulation of long non-coding RNA At4 contributes to phosphate starvation response in Arabidopsis

Affiliations

Histone acetyltransferase GCN5-mediated regulation of long non-coding RNA At4 contributes to phosphate starvation response in Arabidopsis

Tianya Wang et al. J Exp Bot. .

Abstract

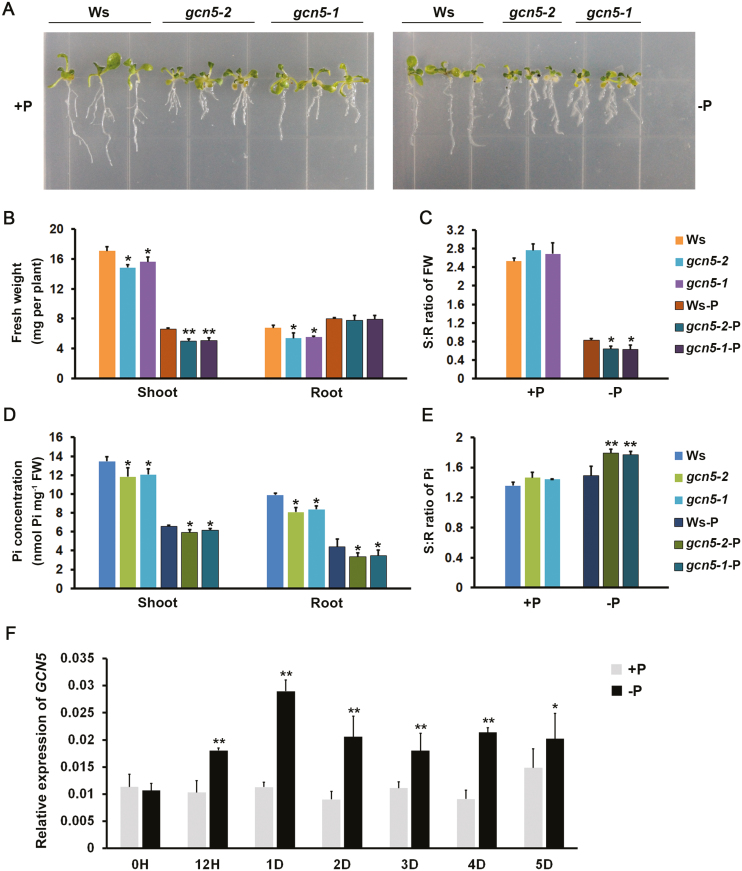
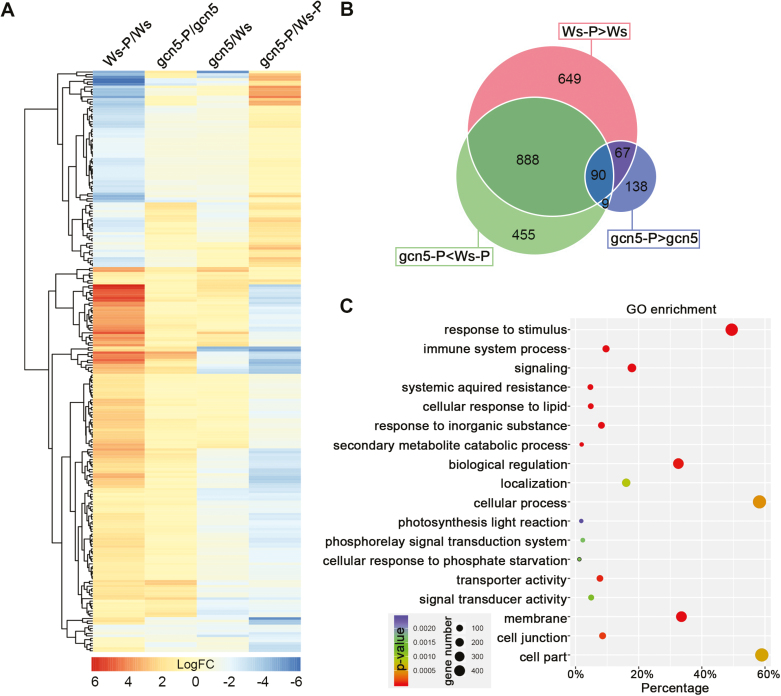
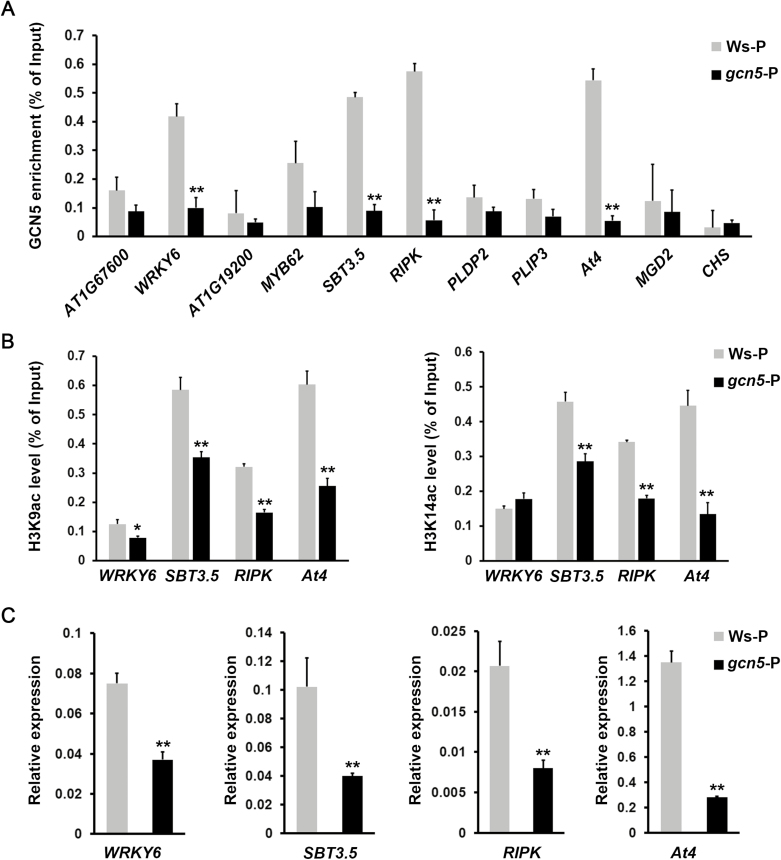
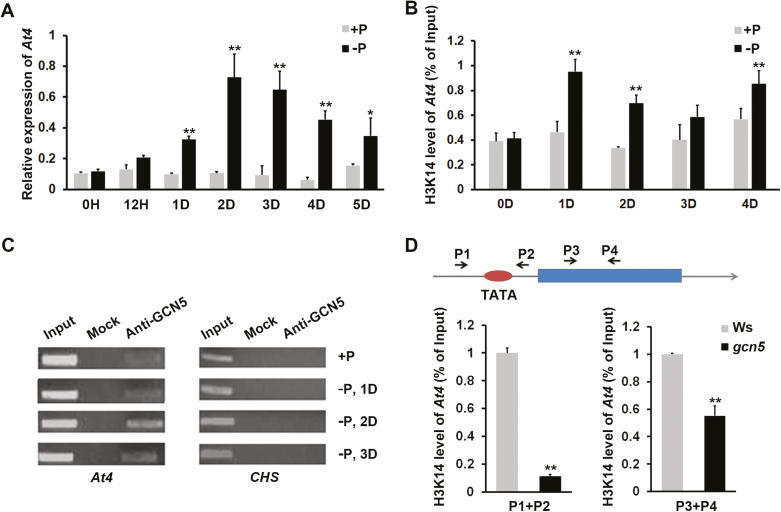
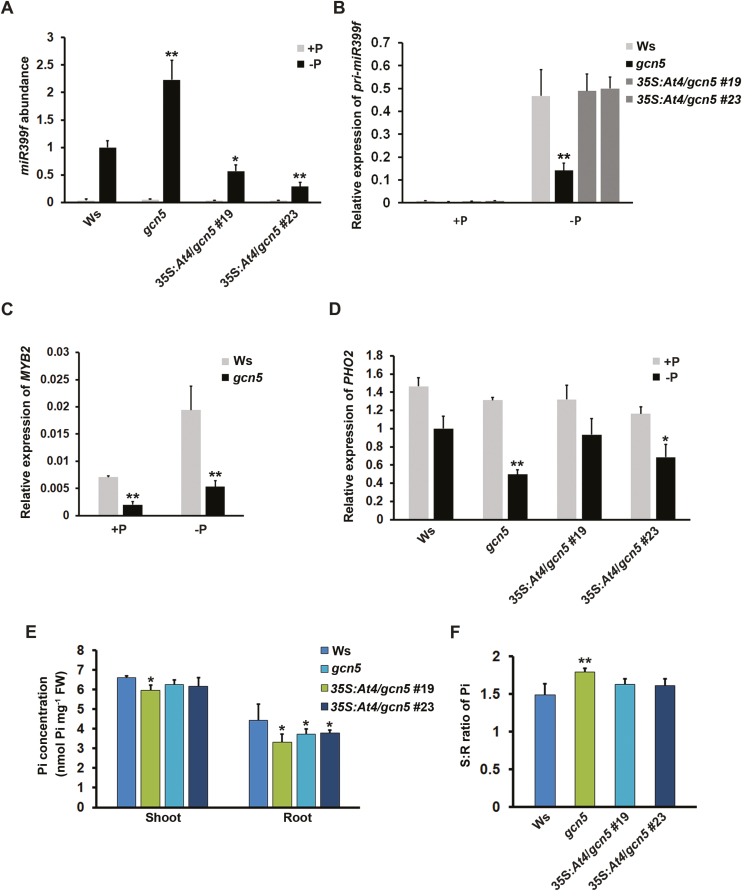
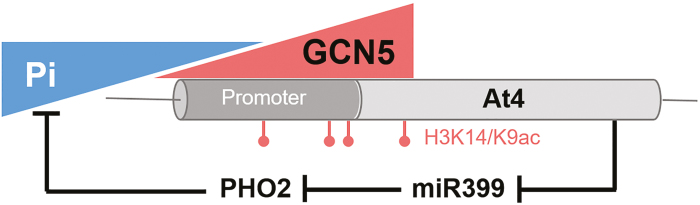
Phosphate availability is becoming a limiting environmental factor that inhibits plant growth and development. Here, we demonstrated that mutation of the histone acetyltransferase GCN5 impaired phosphate starvation responses (PSRs) in Arabidopsis. Transcriptome analysis revealed that 888 GCN5-regulated candidate genes were potentially involved in responding to phosphate starvation. ChIP assay indicated that four genes, including a long non-coding RNA (lncRNA) At4, are direct targets of GCN5 in PSR regulation. In addition, GCN5-mediated H3K9/14 acetylation of At4 determined dynamic At4 expression. Consistent with the function of At4 in phosphate distribution, mutation of GCN5 impaired phosphate accumulation between shoots and roots under phosphate deficiency condition, whereas constitutive expression of At4 in gcn5 mutants partially restored phosphate relocation. Further evidence proved that GCN5 regulation of At4 influenced the miRNA miR399 and its target PHO2 mRNA level. Taken together, we propose that GCN5-mediated histone acetylation plays a crucial role in PSR regulation via the At4-miR399-PHO2 pathway and provides a new epigenetic mechanism for the regulation of lncRNA in plants.

Keywords: Arabidopsis thaliana; At4; GCN5; histone acetylation; lncRNA; phosphate starvation response.


Figures

Fig. 1.
Fig. 1.
GCN5 plays important roles in PSRs in Arabidopsis. (A) Seven-day-old seedlings of Ws, gcn5-1, and gcn5-2 were transferred onto MS plates with sufficient Pi (+P) or deficient Pi (–P) for an additional 6 d. (B) FW and (C) shoot to root ratio (S:R) of the FW of 13-day-old seedlings of Ws, gcn5-1, and gcn5-2 grown under Pi-sufficient or -deficient conditions. Values are the mean of three replicates for each sample. Bars with asterisks are significantly different from the wild-type Ws in each condition (*P<0.05, **P<0.01; Student’s t-test). (D) Pi concentration and (E) S:R ratio of Pi (the ratio of the total amount of Pi in the shoot and root) are shown for shoots and roots of 13-day-old seedlings of Ws and gcn5 grown under Pi-sufficient or -deficient conditions. Values are the mean of three replicates for each sample. Bars with asterisks are significantly different from the corresponding wild-type Ws in each condition (*P<0.05, **P<0.01; Student’s t-test). (F) Seven-day-old Ws seedlings were transferred onto MS plates with deficient Pi for 0 h to 5 d. Total RNA was isolated, and qRT-PCR showed the dynamic expression of GCN5. The expression of ACT8 was used to normalize mRNA levels. Error bars represent the SD values from three biological repetitions for each sample, and the experiment was repeated at least three times. Bars with asterisks are significantly different among comparisons of Pi-sufficient and -deficient treatments at different time points (**P<0.01, *P<0.05; Student’s t-test). (This figure is available in color at JXB online.)
Fig. 2.
Fig. 2.
Identification of the potential GCN5 targets for PSRs. (A) Heatmap of the logFC values in ‘Ws-P/Ws’, ‘gcn5-P/gcn5’, ‘gcn5/Ws’, and ‘gcn5-P/gcn5’ of genes that are differentially expressed in all four comparisons. (B) Venn diagram of the determined differentially expressed genes in each comparison, which represented potential GCN5 targets in response to Pi deficiency. (C) Summary of the over-represented GO categories (biological processes; P-value <0.05; Benjamini–Hochberg correction) for the 888 GCN5-regulated candidate genes, using AgriGO v2.0. The number of genes that are associated with that respective GO category and the corresponding P-value are represented as dots. (This figure is available in color at JXB online.)
Fig. 3.
Fig. 3.
Identification of the direct targets of GCN5 and measurement of their acetylation states. Seven-day-old seedlings of Ws and gcn5 mutants were separately transferred onto MS plates with deficient Pi for 3 d. Nuclei were extracted from the cross-linked seedlings, sonicated, and immunoprecipitated with antibodies specific to GCN5, H3K9ac, and H3K14ac, respectively. Primers were designed at the core promoter region. (A) ChIP assay (anti-GCN5) to identify the direct target of GCN5. Asterisks indicated significant differences in enrichment in the gcn5 mutant compared with that in wild-type Ws. CHS, whose expression is not affected by GCN5, was used as a negative control. (B) ChIP assay (anti-H3K9ac or anti-H3K14ac) to examine the H3K9ac or H3K14ac states of the four GCN5 target genes. Asterisks indicated significant differences in histone acetylation level in the gcn5 mutant compared with that in wild-type Ws. (C) qRT-PCR to show the expression of GCN5 target genes. Error bars represent SD values from three biological repetitions for each sample, and the experiment was repeated at least three times (**P<0.01; Student’s t-test).
Fig. 4.
Fig. 4.
GCN5 directly regulates At4 dynamic expression through histone acetylation under Pi deficiency conditions. (A) Seven-day-old Ws seedlings were transferred onto MS plates with sufficient Pi (+P) or deficient Pi (–P) for 0 h to 5 d. Total RNA was isolated, and qRT-PCR showed the dynamic expression of At4 transcripts. The expression of ACT8 was used to normalize mRNA levels. Error bars represent SD values from three biological repetitions for each sample, and the experiment was repeated at least three times (*P<0.05, **P<0.01; Student’s t-test). (B) We examined the H3K14 acetylation state on the At4 promoter of Ws in normal conditions and after 0, 1, 2, 3, and 4 d of Pi deficiency treatments. Error bars represent SD values from three biological repetitions for each sample, and the experiment was repeated at least three times (**P<0.01; Student’s t-test). (C) ChIP was performed to examine the enrichment of GCN5 on the At4 promoter; CHS was used as a negative control. (D) ChIP was performed to examine the H3K14ac state on the At4 promoter and gene body region before Pi-deprived treatment; P1–P2 and P3–P4 indicated the primers designed for promoter and gene body examinations, respectively. Error bars represent SD values from three biological repetitions for each sample, and the experiment was repeated at least three times (**P<0.01; Student’s t-test). (This figure is available in color at JXB online.)
Fig. 5.
Fig. 5.
Examination of miR399 and PHO2 transcript abundance and Pi concentration in shoots and roots. Total RNA were isolated from 13-day-old seedlings of Ws, gcn5, and 35S:At4/gcn5 transgenic lines grown under Pi-sufficient or -deficient conditions. (A) The miR399f abundance was detected by stem–loop qRT–PCR. (B) Transcript abundance of pri-miR399f expression in Ws, gcn5, and 35S:At4/gcn5 transgenic lines was detected by qRT-PCR. (C) The expression level of MYB2 was detected by qRT-PCR in Ws and gcn5 under normal conditions. (D) Examination of PHO2 mRNA in Ws, gcn5, and 35S:At4/gcn5 transgenic lines grown under Pi-sufficient or -deficient conditions was performed by qRT-PCR. The expression of ACT8 was used to normalize mRNA levels. Error bars represent SD values from three biological repetitions for each sample, and the experiment was repeated at least three times (*P<0.05, **P<0.01; Student’s t-test). (E) Pi concentration and (F) S:R ratio of Pi (the ratio of the total amount of Pi in the shoot and root) are shown for shoots and roots of 13-day-old seedlings in Ws, gcn5, and 35S:At4/gcn5 plants grown under Pi-deficient conditions. Values are the mean of three replicates for each sample. Bars with asterisks are significantly different from the corresponding wild-type Ws in each comparison (*P<0.05, **P<0.01; Student’s t-test). (This figure is available in color at JXB online.)
Fig. 6.
Fig. 6.
A simple model for GCN5 regulation of PSR in Arabidopsis. Pi deficiency could induce the expression of GCN5, which facilitates the expression of the GCN5 direct target At4 by up-regulating its H3K14/K9 acetylation levels. Concomitantly, followed by the inhibition of miR399, the PHO2 mRNA level was increased, resulting in the impairment of Pi accumulation in plants. The two triangles represent the external Pi supply and the histone acetyltransferase GCN5. The schematic of lncRNA At4 (light gray) and its promoter region (dark gray) shows histone H3K14/K9ac modifications. Solid black arrows represent the GCN5-involved regulation of the PSR pathway. (This figure is available in color at JXB online.)

Similar articles

Cited by

References

    1. Aharoni A, Dixit S, Jetter R, Thoenes E, van Arkel G, Pereira A. 2004. The SHINE clade of AP2 domain transcription factors activates wax biosynthesis, alters cuticle properties, and confers drought tolerance when overexpressed in Arabidopsis. The Plant Cell 16, 2463–2480. - PMC - PubMed
    1. Ahmad A, Zhang Y, Cao XF. 2010. Decoding the epigenetic language of plant development. Molecular Plant 3, 719–728. - PMC - PubMed
    1. Aung K, Lin SI, Wu CC, Huang YT, Su CL, Chiou TJ. 2006. pho2, a phosphate overaccumulator, is caused by a nonsense mutation in a microRNA399 target gene. Plant Physiology 141, 1000–1011. - PMC - PubMed
    1. Baek D, Kim MC, Chun HJ, et al. . 2013. Regulation of miR399f transcription by AtMYB2 affects phosphate starvation responses in Arabidopsis. Plant Physiology 161, 362–373. - PMC - PubMed
    1. Bari R, Datt Pant B, Stitt M, Scheible WR. 2006. PHO2, microRNA399, and PHR1 define a phosphate-signaling pathway in plants. Plant Physiology 141, 988–999. - PMC - PubMed

Publication types

MeSH terms