. 2020 Apr 1;112(4):343-355.
doi: 10.1093/jnci/djz155.

Role of Asparagine Endopeptidase in Mediating Wild-Type p53 Inactivation of Glioblastoma

Affiliations

Role of Asparagine Endopeptidase in Mediating Wild-Type p53 Inactivation of Glioblastoma

Yingying Lin et al. J Natl Cancer Inst. .

Abstract

Background: Isocitrate dehydrogenase wild-type (WT) glioblastoma (GBM) accounts for 90% of all GBMs, yet only 27% of isocitrate dehydrogenase WT-GBMs have p53 mutations. However, the tumor surveillance function of WT-p53 in GBM is subverted by mechanisms that are not fully understood.

Methods: We investigated the proteolytic inactivation of WT-p53 by asparaginyl endopeptidase (AEP) and its effects on GBM progression in cancer cells, murine models, and patients' specimens using biochemical and functional assays. The sera of healthy donors (n = 48) and GBM patients (n = 20) were examined by enzyme-linked immunosorbent assay. Furthermore, effects of AEP inhibitors on GBM progression were evaluated in murine models (n = 6-8 per group). The statistical significance between groups was determined using two-tailed Student t tests.

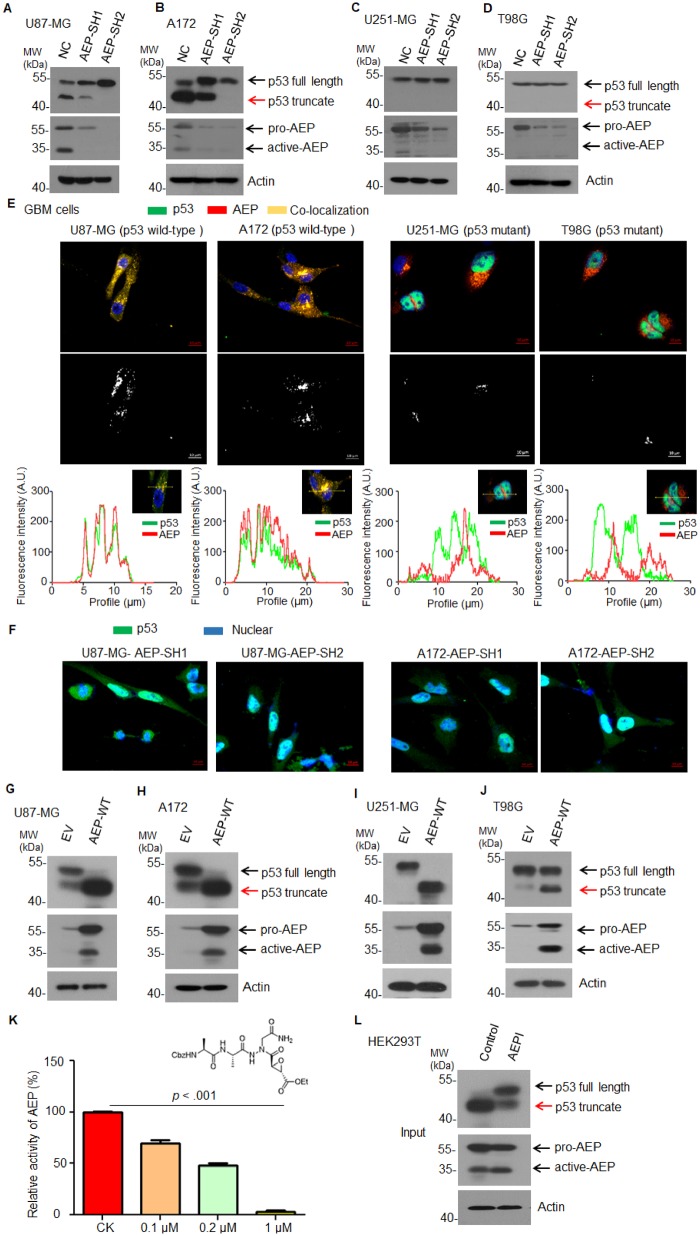
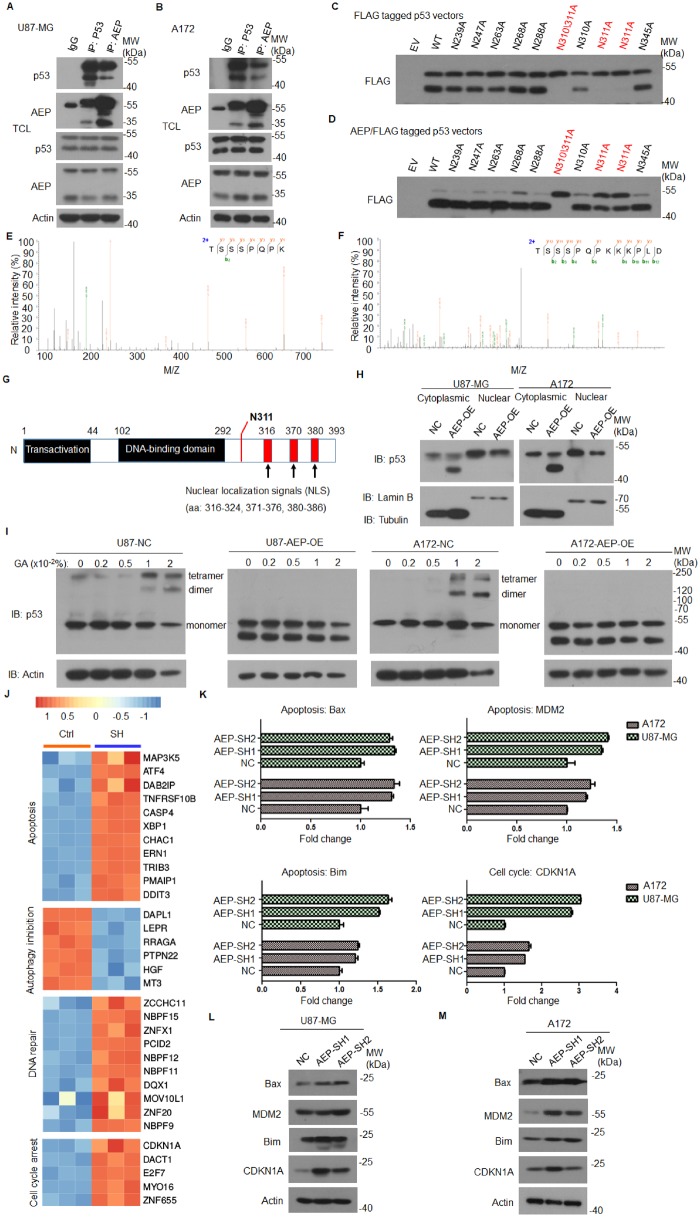
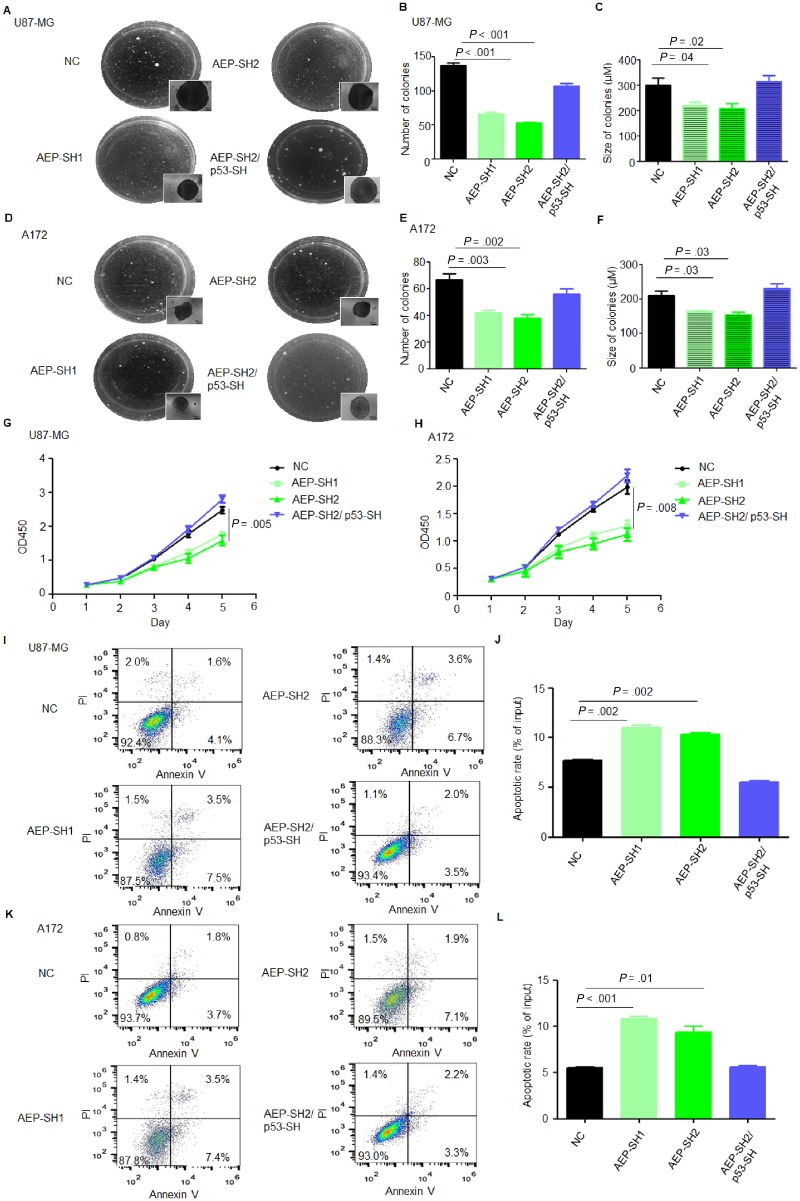
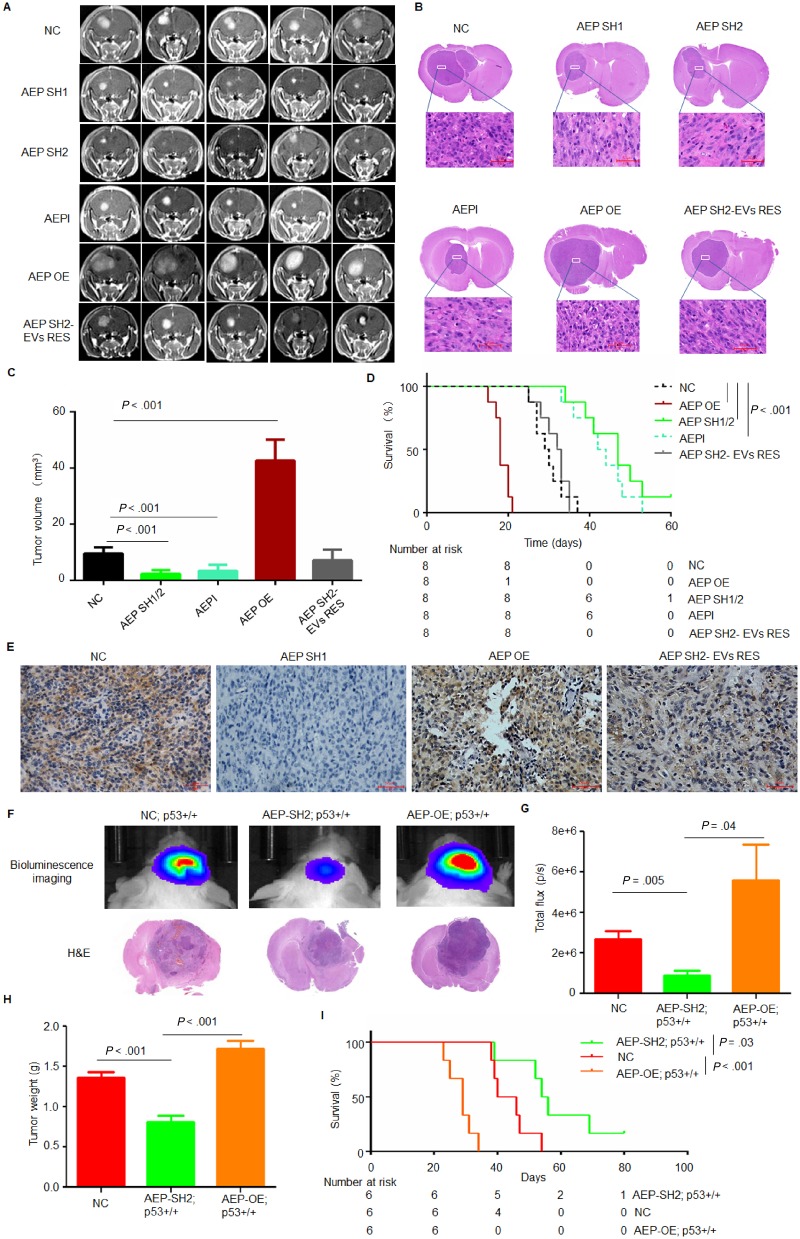
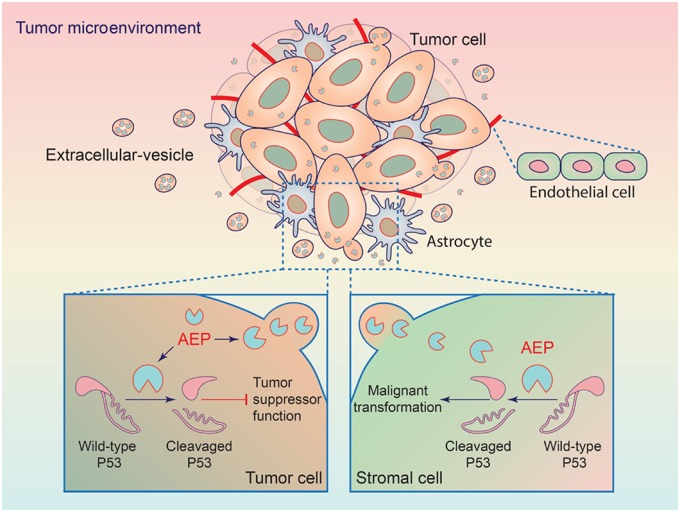
Results: We demonstrate that AEP binds to and directly cleaves WT-p53, resulting in the inhibition of WT-p53-mediated tumor suppressor function in both tumor cells and stromal cells via extracellular vesicle communication. High expression of uncleavable p53-N311A-mutant rescue AEP-induced tumorigenesis, proliferation, and anti-apoptotic abilities. Knock down or pharmacological inhibition of AEP reduced tumorigenesis and prolonged survival in murine models. However, overexpression of AEP promoted tumorigenesis and shortened the survival time. Moreover, high AEP levels in GBM tissues were associated with a poor prognosis of GBM patients (n = 83; hazard ratio = 3.94, 95% confidence interval = 1.87 to 8.28; P < .001). A correlation was found between high plasma AEP levels and a larger tumor size in GBM patients (r = 0.6, P = .03), which decreased dramatically after surgery.

Conclusions: Our results indicate that AEP promotes GBM progression via inactivation of WT-p53 and may serve as a prognostic and therapeutic target for GBM.


Figures

Figure 1.
Figure 1.
Effect of AEP on p53 in GBM cells. A) Immunoblot analysis of p53, AEP, and actin in U87-MG cells with or without AEP silencing. B) Immunoblot analysis of p53, AEP, and actin in A172 cells with or without AEP silencing. C) Immunoblot analysis of p53, AEP, and actin in U251-MG cells with or without AEP silencing. D) Immunoblot analysis of p53, AEP, and actin in T98G cells with or without AEP silencing. E) Immunofluorescence analysis of p53 and AEP in U87-MG, A172, U251-MG, and T98G cells (magnification: 400×; scale bar = 10 μm). The middle graph shows the colocalized signals between the green signal (p53) and the red signal (AEP). The intensity profile plots also analyzed using image J software. F) Immunofluorescence analysis of p53 in U87-MG and A172 cells with AEP silencing (magnification: 400×; scale bar = 10 μm). G) Immunoblot analysis of p53, AEP, and actin in U87-MG cells with or without AEP overexpression. H) Immunoblot analysis of p53, AEP, and actin in A172 cells with or without AEP overexpression. I) Immunoblot analysis of p53, AEP, and actin in U251-MG cells with or without AEP overexpression. J) Immunoblot analysis of p53, AEP, and actin in T98G cells with or without AEP overexpression. K) Structure and activity analysis of AEPI. Data are presented as mean (SD). The two-tailed Student t test was used to analyze the differences between the groups. L) Immunoblot analysis of p53 and AEP in AEP-overexpressing HEK293T cells with or without AEPI treatment. AEP = asparaginyl endopeptidase; AEPI = AEP inhibitor; EV = empty vector; GBM = glioblastoma; MW = molecular weight; NC = negative control; SH = short hairpin; WT = wild type.
Figure 2.
Figure 2.
Interaction between AEP and WT p53 in GBM. A) Co-immunoprecipitation analysis of AEP and p53 in U87-MG cells. B) Co-immunoprecipitation analysis of AEP and p53 in A172 cells. C) Immunoblot analysis of FLAG-tagged p53 in HEK293T cells transfected with WT p53 and a series of mutations of its asparagine residues. D) Immunoblot analysis of FLAG-tagged p53 in HEK293T cells transfected with AEP and WT p53 or a series of mutations of its asparagine residues. E and F) Mass spectrometry analysis of recombinant p53 fragmented by AEP. The detected Mass Spectrometer/Mass Spectrometer peptides spectra are listed. Protein samples were in-gel digested with trypsin (E) or Glu-C (F), respectively. G) Domain analysis of p53 with nuclear localization signals located at its C-terminal. H) Subcellular fractionation of cytoplasmic and nuclear to gain quantitative insight into the amount of p53 that is relocated to the cytoplasm. I) The oligomeric forms of p53 were analyzed in GBM cells with or without AEP-OE. J) Heatmap of a subset of p53 downstream genes differentially regulated in AEP-silenced cells. K) Reverse transcriptase polymerase chain reaction (RT-PCR) analysis of BAX, MDM2, Bim, and CDKN1A expression in U87-MG and A172 cells with or without AEP knockdown. Data are presented as mean (SD). The two-tailed Student t test was used to analyze the differences between the groups. L and M) Immunoblot analysis of BAX, MDM2, Bim, and CDKN1A in U87-MG and A172 cells with or without AEP silencing. AEP = asparaginyl endopeptidase; EV = empty vector; GBM = glioblastoma; MW = molecular weight; NC = negative control; OE = overexpression; SH = short hairpin; TCL = total cell lysate; WT = wild type.
Figure 3.
Figure 3.
Effect of AEP inhibition on p53 wild-type GBM cell malignant functions. A) Colony formation assay of U87-MG cells with the negative control (NC), AEP silencing, or AEP plus p53 silencing (magnification: 400×; scale bar = 50 μm). B and C) Statistical analysis of the (B) number and (C) size of the colonies shown in (A). D) Colony formation assay of A172 cells with the NC, AEP silencing, or AEP plus p53 silencing (magnification: 400×; scale bar = 50 μm). E and F) Statistical analysis of the (E) number and (F) size of the colonies shown in (D). G) CCK8 analysis of U87-MG cells with the NC, AEP silencing, or AEP plus p53 silencing. H) CCK8 analysis of A172 cells with the NC, AEP silencing, or AEP plus p53 silencing. I and J) Apoptosis analysis of U87-MG cells with the NC, AEP silencing, or AEP plus p53 silencing. K and L) Apoptosis analysis of A172 cells with the NC, AEP silencing, or AEP plus p53 silencing. Data are presented as mean (SD). The two-tailed Student t test was used to analyze the differences between the groups. AEP = asparaginyl endopeptidase; GBM = glioblastoma; NC = negative control; PI = Propidium Iodide; SH = short hairpin.
Figure 4.
Figure 4.
Effect of AEP overexpression on p53 wild-type GBM cell malignant functions. A) Colony formation assay of U87-MG cells with AEP overexpression or AEP plus p53 N311A overexpression (magnification: 400×; scale bar = 50 μm). B and C) Statistical analysis of the (B) number and (C) size of colonies shown in (A). D) Colony formation assay of A172 cells with AEP overexpression or AEP plus p53 N311A overexpression (magnification: 400×; scale bar = 50 μm). E and F) Statistical analysis of the (E) number and (F) size of colonies shown in (D). G) CCK8 analysis of U87-MG cells with AEP overexpression or AEP plus p53 N311A overexpression. H) CCK8 analysis of A172 cells with AEP overexpression or AEP plus p53 N311A overexpression. I and J) Apoptosis analysis of U87-MG cells with AEP overexpression or AEP plus p53 N311A overexpression. K and L) Apoptosis analysis of A172 cells with AEP overexpression or AEP plus p53 N311A overexpression. Data are presented as mean (SD). The two-tailed Student t test was used to analyze the differences between the groups. AEP = asparaginyl endopeptidase; GBM = glioblastoma; NC = negative control; OE = overexpression; PI = Propidium Iodide.
Figure 5.
Figure 5.
Effect of AEP-containing EVs derived from GBM cells on stromal cell functions. A) Immunoblot analysis of p53, AEP, and actin in HEB cells cultured with or without GBM cell-conditioned medium. B) Immunoblot analysis of p53, AEP, and actin in HUVECs cultured with or without GBM cell-conditioned medium. C) Immunoelectron microscopy analysis of AEP in extracellular vesicles released by U87-MG cells (magnification: 33000×; scale bar = 250 nm). D) Immunoelectron microscopy analysis of AEP in extracellular vesicles released by A172 cells (magnification, 46000×; scale bar = 100 nm). E) Immunoblot analysis of p53, AEP, and actin in HEB cells cultured with or without GBM cell-derived extracellular vesicles. F) Immunoblot analysis of p53, AEP, and actin in HUVECs cultured with or without GBM cell-derived extracellular vesicles. G and H) Tube formation assay of HUVECs with or without p53 silencing cultured with conditioned medium derived from wild-type GBM cells or AEP-suppressed GBM cells (magnification: 100×; scale bar = 50 μm). Data are presented as mean (SD). The two-tailed Student t test was used to analyze the differences between the groups. I and J) Transwell assay of HEB cells with or without p53 silencing cultured with conditioned medium derived from wild-type GBM cells or AEP-suppressed GBM cells (magnification: 200×; scale bar = 100 μm). Data are presented as mean (SD). The two-tailed Student t test was used to analyze the differences between the groups. AEP = asparaginyl endopeptidase; CM = culture medium; EVs = extracellular vesicles; GBM = glioblastoma; HEB = human normal glial cells; HUVEC = human umbilical vein endothelial cells; MW = molecular weight; NC = negative control; SH = short hairpin.
Figure 6.
Figure 6.
Effect of AEP on GBM progression in vivo. A) Representative axial magnetic resonance images of xenograft GBM tumors orthotopically inoculated with U87-NC, U87-AEP-SH, or U87-AEP-OE cells on day 16 postimplantation. Mice inoculated with U87-NC were treated with AEPI (1 mg/mL) by tail vein injection. Mice inoculated with U87-AEP-SH were treated with EVs collected from U87-NC cells by tail vein injection. B) Representative H&E images of every group are shown (magnification: 400×; scale bar = 50 μm). C) The tumor volume was calculated in every group (n = 8 per group). Data are presented as mean (SD). The two-tailed Student t test was used to analyze the differences between the groups. D) Survival time comparison of all groups of mice. The time of death was recorded as days after the GBM cell implantation. The K-M method was used to estimate survival curves. The K-M survival analysis was performed by SPSS15.0. E) Representative immunohistochemistry images of AEP in tumors collected from every group are shown (magnification: 400×; scale bar = 50 μm). F and G) Representative 2-D luminescence images of gliomas induced in p16Ink4a/p19Arf; K-Rasv12; LucR mice with AEP knockdown or overexpression (n = 6 per group). The data are presented as the average radiance efficiency [(photons/s/cm2/steradian)/(μW/cm2)]. Images are presented with the same scale bar. H) The tumor weight of each group is shown. Data are presented as mean (SD). The two-tailed Student t test was used to analyze the differences between the groups. I) Survival time comparison of all groups of mice. The time of death was recorded as days after the Cytomegalovirus promoter-cyclization recombinase (CMV-CRE) lentivirus injection. The K-M method was used to estimate survival curves. The K-M survival analysis was performed by SPSS15.0. AEP = asparaginyl endopeptidase; AEPI = AEP inhibitor; EVs RES = extracellular vesicles rescue; GBM = glioblastoma; H&E = hematoxylin and eosin; K-M = Kaplan-Meier; NC = negative control; OE = overexpression; SH = short hairpin.
Figure 7.
Figure 7.
The influence of AEP expression on survival in GBM. A) Immunoblot analysis of AEP in fresh GBM tissues (n = 4), LGG (n = 4), and normal controls (n = 4). The experiment was repeated three times. B) IHC staining with an antibody to AEP was performed on 83 glioma specimens. Images with representative staining are presented (magnification: 400×; scale bar = 50 μm). C) Representative cases indicating negative, weak, moderate, and strong AEP staining in 67 GBM tissues are shown. The patient tumors were stratified into high and low AEP expression based on median cutoff of continuous H-scoring (cutoff value = 6 score; range = 0–12; magnification: 400×; scale bar = 50 μm). D) K-M curves of AEP expression in GBM tumor tissues in relation to overall survival (n = 83; P < .001). The K-M survival analysis was performed by SPSS13.1. E) ELISA of the AEP concentrations in the sera of GBM patients, low-grade glioma patients, and healthy controls (GBM: n = 20, LGG: n = 16, healthy donors: n = 48). F) ELISA of the AEP concentrations in the sera of GBM patients pre- and postsurgery (n = 15). The two-tailed Student t test was used to analyze the differences between the groups. G) Pearson correlation analysis showed a statistically significant positive correlation between plasma AEP concentration and tumor size (n = 14, r = 0.6; P = .03). H and I) Immunoblot analysis of AEP and p53 in fresh p53-WT/IDH-WT GBM tissues is shown (n = 30). J) The enzymatic activity of AEP in fresh p53-WT/IDH-WT GBM tissues is shown (n = 30). AEP = asparaginyl endopeptidase; dF = differential fluorescence; ELISA = enzyme-linked immunosorbent assay; GBM = glioblastoma; IB = immunoblot; IHC = immunohistochemical; K-M = Kaplan-Meier; LGG = low-grade gliomas; MW = molecular weight; WT = wild type.
Figure 8.
Figure 8.
Model for the mechanism of action of AEP in GBM. Wild-type p53 proteolytic inactivation by AEP in GBM tumor cells (bottom left) promotes tumor cell functions. Additionally, AEP is secreted by GBM tumor cells and endocytosed by stromal cells including astrocytes and endothelial cells to promote the malignant transformation of these cells (bottom right). AEP = asparaginyl endopeptidase; GBM = glioblastoma.

Comment in

Similar articles

Cited by

References

    1. Cancer Genome Atlas Research N. Comprehensive genomic characterization defines human glioblastoma genes and core pathways. Nature. 2008;455(7216):1061–1068. - PMC - PubMed
    1. Kastenhuber ER, Lowe SW.. Putting p53 in context. Cell. 2017;170(6):1062–1078. - PMC - PubMed
    1. Soragni A, Janzen DM, Johnson LM.. A designed inhibitor of p53 aggregation rescues p53 tumor suppression in ovarian carcinomas. Cancer Cell. 2016;29(1):90–103. - PMC - PubMed
    1. Comel A, Sorrentino G, Capaci V, et al. The cytoplasmic side of p53’s oncosuppressive activities. FEBS Lett. 2014;588(16):2600–2609. - PubMed
    1. Louis DN, Perry A, Reifenberger G, et al. The 2016 World Health Organization classification of tumors of the central nervous system: a summary. Acta Neuropathol. 2016;131(6):803–820. - PubMed

Publication types

Substances