. 2019 Sep 26;47(17):9087-9103.
doi: 10.1093/nar/gkz635.

DREAM and RB cooperate to induce gene repression and cell-cycle arrest in response to p53 activation

Affiliations

DREAM and RB cooperate to induce gene repression and cell-cycle arrest in response to p53 activation

Sigrid Uxa et al. Nucleic Acids Res. .

Abstract

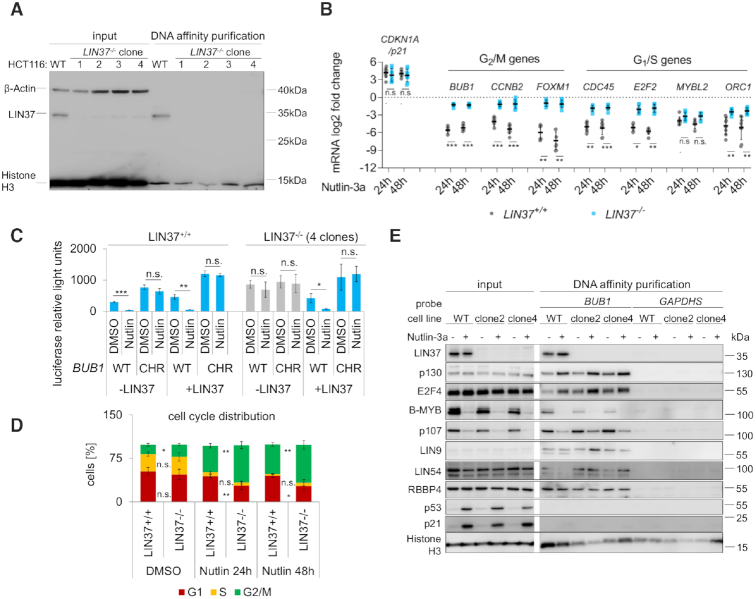
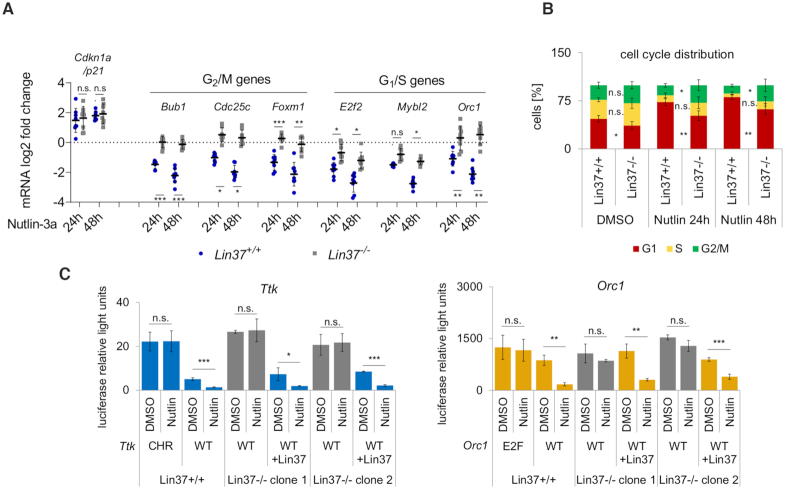
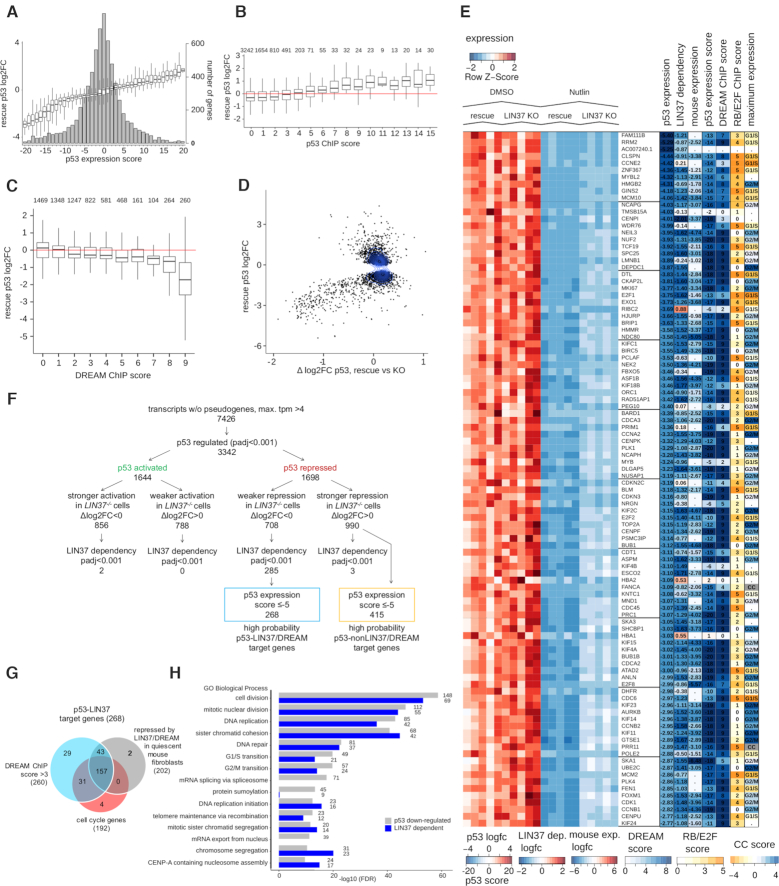
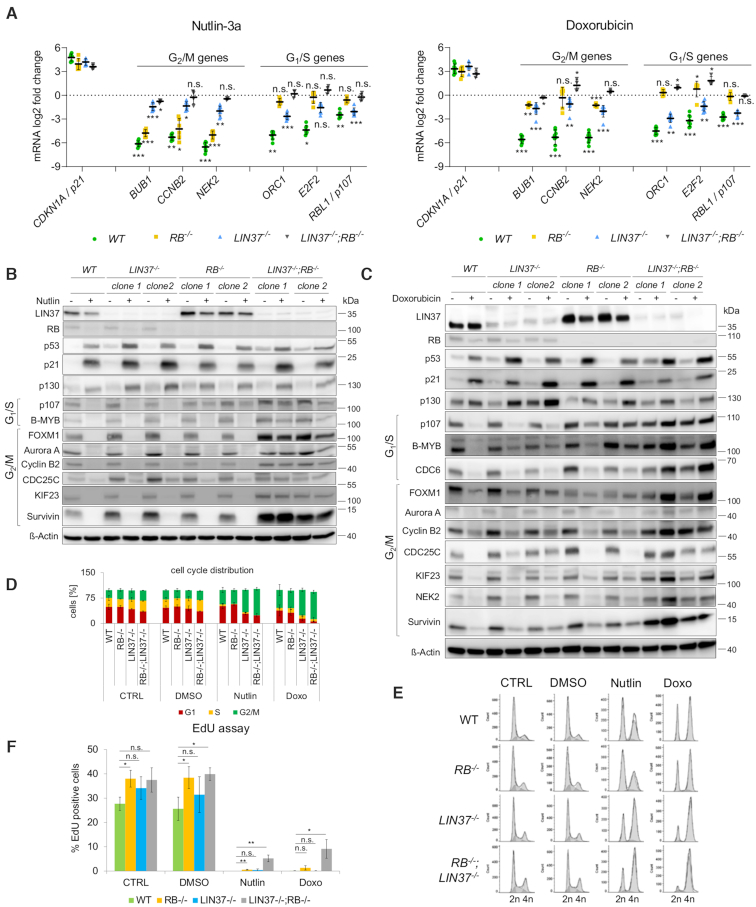
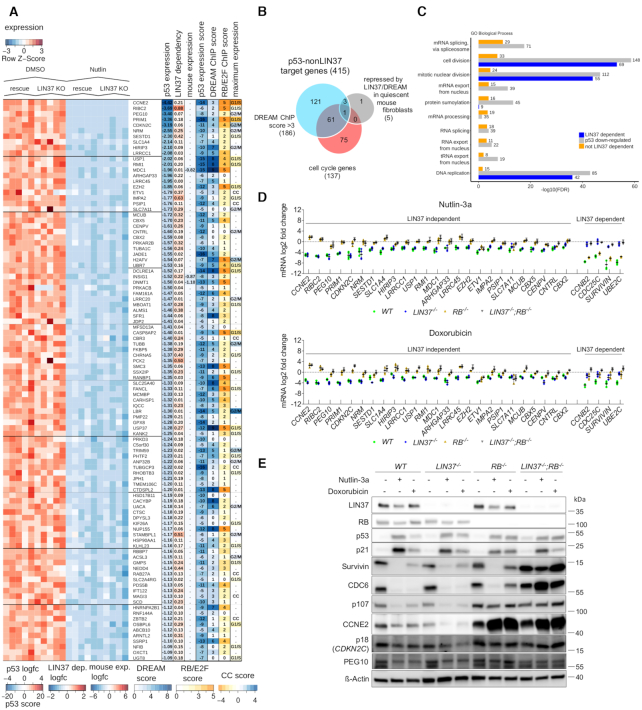
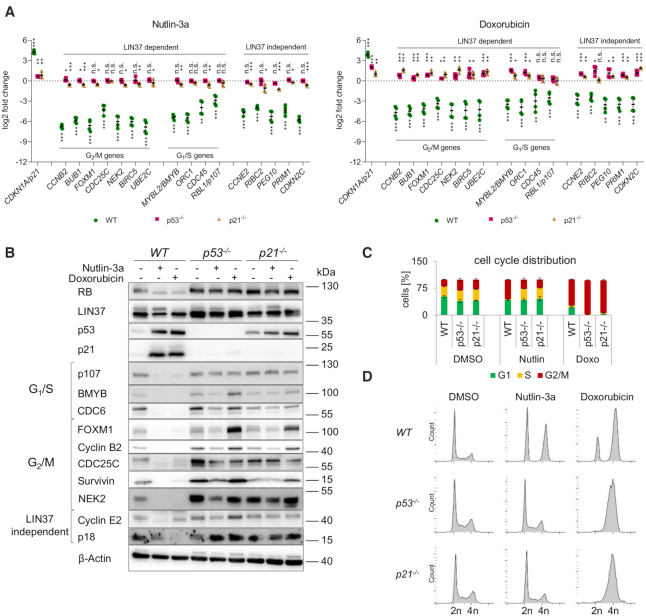
Most human cancers acquire mutations causing defects in the p53 signaling pathway. The tumor suppressor p53 becomes activated in response to genotoxic stress and is essential for arresting the cell cycle to facilitate DNA repair or to initiate apoptosis. p53-induced cell cycle-arrest is mediated by expression of the CDK inhibitor p21WAF1/Cip1, which prevents phosphorylation and inactivation of the pocket proteins RB, p130, and p107. In a hypophosphorylated state, pocket proteins bind to E2F factors forming RB-E2F and DREAM transcriptional repressor complexes. Here, we analyze the influence of RB and DREAM on p53-induced gene repression and cell-cycle arrest. We show that abrogation of DREAM function by knockout of the DREAM component LIN37 results in a reduced repression of cell-cycle genes. We identify the genes repressed by the p53-DREAM pathway and describe a set of genes that is downregulated by p53 independent of LIN37/DREAM. Most strikingly, p53-dependent repression of cell-cycle genes is completely abrogated in LIN37-/-;RB-/- cells leading to a loss of the G1/S checkpoint. Taken together, we show that DREAM and RB are key factors in the p53 signaling pathway to downregulate a large number of cell-cycle genes and to arrest the cell cycle at the G1/S transition.


Figures

Figure 1.
Figure 1.
Loss of LIN37 impairs p53-dependent cell-cycle gene repression and G1/S arrest. (A) Nuclear extracts prepared from HCT116 wild-type cells (WT) and four putative LIN37 knockout (LIN37−/−) clonal HCT116 cell lines were analyzed for LIN37 protein expression (input). In addition, MuvB complex components were purified with a BUB1 promoter probe (DNA affinity purification). The non-DNA-binding protein β-Actin was analyzed to control the specificity of the purification, while histone H3 was probed to prove similar purification efficiencies. (B) HCT116 LIN37+/+ (n = 4) and HCT116 LIN37−/− clonal cell lines (n = 4) were treated with Nutlin-3a for 24 or 48 h. Control cells were treated with DMSO for 48 h. mRNA expression of CDKN1A/p21, G2/M-specific, and G1/S phase genes was analyzed by RT-qPCR. The log2 fold changes of mRNA expression of treated versus control cells are given. Mean values are indicated by black bars. (C) The parental LIN37+/+ HCT116 cell line or LIN37−/− clonal cell lines (n = 4) were transfected with BUB1 wild-type (WT) or DREAM-binding site-deficient (CHR) promoter firefly luciferase reporter constructs together with a LIN37 expression plasmid (+LIN37) or an empty vector control (-LIN37). Promoters were tested for their activity upon treatment with DMSO (solvent control) or Nutlin-3a for 48 h. Promoter activities were normalized to renilla luciferase activity. Mean values ±SD of three biological replicates measured in one wild-type cell line or four LIN37−/− cell lines are given. (D) MuvB complex components were purified from nuclear extracts of the HCT116 parental cell line (WT) and from two independent LIN37−/−lines (clone 2, clone 4) after treatment with Nutlin-3a or DMSO (neg. control) for 24 h. Purification was performed with a fragment of the BUB1 promoter containing a CHR element or with a fragment of the GAPDHS promoter lacking DREAM binding sites to control for background binding. Protein binding of MuvB complex components was analyzed by western blotting. Expression of p53 and p21 was analyzed to control stabilization of p53 upon Nutlin-3a treatment, and histone H3 was probed as a control for DNA affinity purification. One representative experiment is shown. (E) Cell-cycle distribution of the LIN37+/+ and LIN37−/− cell lines analyzed in (A) was measured after propidium iodide staining by flow cytometry. Mean values ±SD of wild-type and LIN37 knockout cell lines (n = 4) are given. Significances in (B), (C) and (E) were calculated with the Student's t-Test (n.s. – not significant, *P ≤ .05, **P ≤ .01, ***P ≤ .001).
Figure 2.
Figure 2.
Loss of Lin37 impairs p53-dependent cell-cycle gene repression and G1/S arrest in mouse C2C12 cells. (A) Wild-type C2C12 clonal cell lines (LIN37+/+, n = 4) and mutant C2C12 Lin37−/− clonal cell lines (n = 4) were treated with Nutlin-3a for 24 or 48 h. Control cells were treated with DMSO for 48 h. mRNA expression of CDKN1A/p21, G2/M-specific, and G1/S phase genes was analyzed by RT-qPCR. The log2 fold changes of mRNA expression of treated vs. control cells are given. Mean values (black bars) of mRNA expression from four cell lines determined with two technical replicates are given. (B) Cell-cycle distribution of the Lin37+/+ and Lin37−/− cell lines analyzed in (A) was measured after propidium iodide staining by flow cytometry. Mean values ±SD of wild-type (Lin37+/+, n = 4) and Lin37 knockout lines (Lin37–/–, n = 4) are shown. (C) The parental C2C12 cell line and the two Lin37−/− clonal cell lines were transfected with Ttk (blue) or Orc1 (yellow) wild-type (WT) or DREAM-binding site-deficient (CHR, E2F sites) promoter firefly luciferase reporter constructs. The reporter plasmids were cotransfected with a Lin37-expression plasmid (+Lin37) or an empty vector (-Lin37). Promoter activities were determined upon treatment with DMSO (control) or Nutlin-3a for 24 h and normalized to renilla luciferase activity as a standard from a cotransfected plasmid. Mean values ±SD of three biological replicates are given. All significances were calculated with the Student's t-Test (n.s. – not significant, *P ≤ .05, **P ≤ .01, ***P ≤ .001).
Figure 3.
Figure 3.
Identification of genes repressed by p53 in a LIN37/DREAM-dependent manner. (A) Box plots (left axis of ordinates): Expression alterations (log2-fold change) in LIN37 rescue cells upon Nutlin-3a treatment vs. p53 expression score compiled from 20 data sets of p53-dependent mRNA expression data. A score of -20 indicates significant repression of a specific gene in 20 data sets. A score of 0 shows that there is no p53-dependent activation and repression or that the sum of significant change from 20 data sets is balanced. A score of +20 indicates activation in all data sets (2). Barplots (right axis of ordinates) show the number of genes with the respective p53 expression score. (B) Expression changes (log2-fold change) in LIN37 rescue cells upon Nutlin-3a treatment vs. p53 ChIP score derived from 15 independent experiments. A score of 15 equals p53 binding to a specific gene detected in all experiments and a score of 0 equals no detectable p53 binding in any experiment (2). The number of genes with the respective ChIP score is shown above the box plots. (C) Expression changes (log2 fold change) in LIN37 rescue cells upon Nutlin-3a treatment vs. DREAM ChIP score derived from nine independent experiments. A score of 9 illustrates binding of DREAM components to a specific gene detected in all experiments and a score of 0 equals no detectable DREAM component binding in any experiment (2). The number of genes with the respective DREAM score is shown above the box plots. (D) Expression change (log2 fold change) upon Nutlin-3a treatment in LIN37 rescue cells vs. difference in expression change upon Nutlin-3a treatment between LIN37 knockout and rescue cells (Δlog2FC p53 rescue versus KO). (E) The 100 genes most substantially downregulated upon Nutlin-3a treatment in LIN37 rescue cells. Left: Expression heatmap (from left to right: DMSO treated LIN37 rescue cells, DMSO treated LIN37−/− cells, Nutlin-3a treated rescue cells, Nutlin-3a treated LIN37−/− cells (5 biological replicates each). Right: Color coded columns showing (left to right): log2 fold change of expression upon Nutlin-3a treatment, difference of log2 fold change after Nutlin-3a treatment between rescue and LIN37−/− cells, log2 fold change between serum-starved rescue and LIN37−/− mouse NIH3T3 fibroblasts (32), DREAM ChIP score, RB-E2F ChIP score, and the peak of expression if cell cycle-related (CC if cell cycle-dependent without clear preference for either G1/S or G2/M) (2). (F) Selection of gene sets based on the transcriptome analysis. The numbers correspond to the genes in the respective groups. (G) Venn diagram of genes downregulated upon Nutlin-3a treatment as defined in (F): Overlap of genes with DREAM ChIP score >3, genes repressed by LIN37/DREAM in serum-starved mouse fibroblast and established cell-cycle genes. (H) False discovery rate (FDR) of top 15 GO term (Gene Ontology Biological Process) enrichments of genes downregulated upon Nutlin-3a treatment. Grey: all downregulated genes, blue: LIN37-dependent downregulation. The respective number of genes is given to the right of the bars.
Figure 4.
Figure 4.
LIN37−/−;RB−/− HCT116 cells lack the ability do downregulate cell-cycle gene expression on mRNA and protein levels in response to p53 activation and exhibit a compromised G1/S checkpoint. (A) HCT116 wild-type (WT, n = 4), RB−/− (n = 3), LIN37−/– (n = 4), and RB−/−;LIN37−/− (n = 2) clonal cell lines were treated with Nutlin-3a or doxorubicin for 48 h. As controls, untreated or DMSO-treated (48 h) cell lines were analyzed. mRNA expression of the CDK inhibitor CDKN1A/p21, G2/M-specific genes, and G1/S phase genes were measured by RT-qPCR. The log2 fold changes of mRNA expression of treated vs. control cells are given. Mean values are indicated by black bars. Protein expression of cell-cycle regulators in response to 48 h of (B) Nutlin-3a or (C) doxorubicin treatment in HCT116 wild-type (WT) and two clonal cell lines each of RB−/−, LIN37−/−, and RB−/−;LIN37−/− HCT116 cells were analyzed by western blot. β-Actin served as a loading control. (D) Cell-cycle distribution of cell lines analyzed in (A) was measured by flow cytometry after propidium iodide staining. Mean values ±SD of wild-type (WT, n = 4) and knockout cell lines (RB–/– (n = 3), LIN37–/–, n = 4, RB–/–;LIN37–/– (n = 2)) are given (n.s. – not significant, *P ≤ .05, **P ≤ .01, ***P ≤ .001). (E) One representative experiment is shown. (F) Amount of S phase cells in untreated (CTRL) or DMSO-, Nutlin-3a-; and doxorubicin- (Doxo) treated wild-type and knockout cells as determined by EdU incorporation assays with 3 biological replicates. Significance was calculated with the Student's t-Test (n.s. – not significant, *P ≤ .05, **P ≤ .01, ***P ≤ .001).
Figure 5.
Figure 5.
Identification of genes repressed by p53 independent of LIN37/DREAM. (A) Heat map of genes downregulated upon Nutlin-3a treatment independently of LIN37. Color code and arrangement of columns as described in Figure 3. (B) Venn diagram of genes downregulated upon Nutlin-3a treatment in a LIN37-independent manner. The overlap of genes with DREAM ChIP score >3, genes repressed by LIN37 in mouse fibroblasts and known cell-cycle genes is shown. (C) False discovery rate (FDR) of top 10 GO term (Gene Ontology Biological Process) enrichment of genes downregulated upon Nutlin-3a treatment (grey), by Nutlin-3a in a LIN37-dependent (blue), and independent (orange) manner. The number of respective genes is written to the right of the bars. (D) HCT116 wild-type (WT) and knockout (LIN37−/−, RB−/−, LIN37−/−;RB−/−) cells were treated with Nutlin-3a or doxorubicin for 48 h. Untreated or DMSO-treated cells served as controls. Expression of the top 25 LIN37 independent genes shown in (A) and of G2/M genes (LIN37 dependent) was analyzed by RT-qPCR. The log2 fold changes of mRNA expression of treated vs. control cells (two biological and two technical replicates) is given. Mean values are illustrated by black bars. (E) HCT116 wild-type (WT) and knockout cells were treated with DMSO, Nutlin-3a, or doxorubicin for 48 h. Protein levels were analyzed by western blot and β-Actin levels served as loading control.
Figure 6.
Figure 6.
p53−/− and p21−/− HCT116 cells cannot downregulate cell-cycle gene expression on mRNA and protein levels in response to treatment with Nutlin-3a or doxorubicin. (A) HCT116 wild-type, p53−/−, and p21−/− cells were treated with DMSO, Nutlin-3a or doxorubicin for 48 h. mRNA expression of CDKN1A/p21, G2/M- and G1/S-specific genes as well as LIN37-independently regulated genes were measured by RT-qPCR. The log2 fold changes of mRNA expression of treated vs. control cells are given. Mean values of two biological and two technical replicates are indicated by black bars. Significances were calculated with the Student's T-Test (n.s. – not significant, *P ≤ .05, **P ≤ .01, ***P ≤ .001). (B) Protein expression in response to 48 h of Nutlin-3a or doxorubicin treatment in HCT116 wild-type (WT), p53−/−, and p21−/− HCT116 cells were analyzed by western blot. β-Actin served as a loading control. (C) Cell-cycle distribution of cell lines analyzed in (A) was measured by flow cytometry after propidium iodide staining. Mean values ±SD of two biological replicates are given. (D) Histograms of one representative experiment shown in (C) are given.

Similar articles

Cited by

References

    1. Kastenhuber E.R., Lowe S.W.. Putting p53 in Context. Cell. 2017; 170:1062–1078. - PMC - PubMed
    1. Fischer M., Grossmann P., Padi M., DeCaprio J.A.. Integration of TP53, DREAM, MMB-FOXM1 and RB-E2F target gene analyses identifies cell cycle gene regulatory networks. Nucleic Acids Res. 2016; 44:6070–6086. - PMC - PubMed
    1. Fischer M. Census and evaluation of p53 target genes. Oncogene. 2017; 36:3943–3956. - PMC - PubMed
    1. Engeland K. Cell cycle arrest through indirect transcriptional repression by p53: I have a DREAM. Cell Death Differ. 2018; 25:114–132. - PMC - PubMed
    1. Nguyen T.T., Grimm S.A., Bushel P.R., Li J., Li Y., Bennett B.D., Lavender C.A., Ward J.M., Fargo D.C., Anderson C.W. et al. .. Revealing a human p53 universe. Nucleic Acids Res. 2018; 46:8153–8167. - PMC - PubMed

Publication types

MeSH terms