Human Cytomegalovirus pUL37x1 Is Important for Remodeling of Host Lipid Metabolism
- PMID: 31391267
- PMCID: PMC6803270
- DOI: 10.1128/JVI.00843-19
Human Cytomegalovirus pUL37x1 Is Important for Remodeling of Host Lipid Metabolism
Abstract
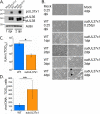
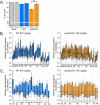
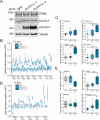
Human cytomegalovirus (HCMV) replication requires host metabolism. Infection alters the activity in multiple metabolic pathways, including increasing fatty acid elongation and lipid synthesis. The virus-host interactions regulating the metabolic changes associated with replication are essential for infection. While multiple host factors, including kinases and transcription factors, important for metabolic changes that occur following HCMV infection have been identified, little is known about the viral factors required to alter metabolism. In this study, we tested the hypothesis that pUL37x1 is important for the metabolic remodeling that is necessary for HCMV replication using a combination of metabolomics, lipidomics, and metabolic tracers to measure fatty acid elongation. We observed that fibroblast cells infected with wild-type (WT) HCMV had levels of metabolites similar to those in cells infected with a mutant virus lacking the UL37x1 gene, subUL37x1. However, we found that relative to WT-infected cells, subUL37x1-infected cells had reduced levels of two host proteins that were previously demonstrated to be important for lipid metabolism during HCMV infection: fatty acid elongase 7 (ELOVL7) and the endoplasmic reticulum (ER) stress-related kinase PERK. Moreover, we observed that HCMV infection results in an increase in phospholipids with very-long-chain fatty acid tails (PL-VLCFAs) that contain 26 or more carbons in one of their two tails. The levels of many PL-VLCFAs were lower in subUL37x1-infected cells than in WT-infected cells. Overall, we conclude that although pUL37x1 is not necessary for network-wide metabolic changes associated with HCMV infection, it is important for the remodeling of a subset of metabolic changes that occur during infection.IMPORTANCE Human cytomegalovirus (HCMV) is a common pathogen that asymptomatically infects most people and establishes a lifelong infection. However, HCMV can cause end-organ disease that results in death in the immunosuppressed and is a leading cause of birth defects. HCMV infection depends on host metabolism, including lipid metabolism. However, the viral mechanisms for remodeling of metabolism are poorly understood. In this study, we demonstrate that the viral UL37x1 protein (pUL37x1) is important for infection-associated increases in lipid metabolism, including fatty acid elongation to produce very-long-chain fatty acids (VLCFAs). Furthermore, we found that HCMV infection results in a significant increase in phospholipids, particularly those with VLCFA tails (PL-VLCFAs). We found that pUL37x1 was important for the high levels of fatty acid elongation and PL-VLCFA accumulation that occur in HCMV-infected cells. Our findings identify a viral protein that is important for changes in lipid metabolism that occur following HCMV infection.
Keywords: cytomegalovirus; human herpesviruses; lipidomics; metabolism; metabolomics.
Copyright © 2019 American Society for Microbiology.
Figures


Similar articles
-
Human Cytomegalovirus Uses a Host Stress Response To Balance the Elongation of Saturated/Monounsaturated and Polyunsaturated Very-Long-Chain Fatty Acids.mBio. 2021 May 4;12(3):e00167-21. doi: 10.1128/mBio.00167-21. mBio. 2021. PMID: 33947752 Free PMC article.
-
Protein phosphatase 1 suppresses PKR/EIF2α signaling during human cytomegalovirus infection.J Virol. 2024 Nov 19;98(11):e0059024. doi: 10.1128/jvi.00590-24. Epub 2024 Oct 29. J Virol. 2024. PMID: 39470211
-
Nitric Oxide Circumvents Virus-Mediated Metabolic Regulation during Human Cytomegalovirus Infection.mBio. 2020 Dec 15;11(6):e02630-20. doi: 10.1128/mBio.02630-20. mBio. 2020. PMID: 33323506 Free PMC article.
-
Human cytomegalovirus riding the cell cycle.Med Microbiol Immunol. 2015 Jun;204(3):409-19. doi: 10.1007/s00430-015-0396-z. Epub 2015 Mar 17. Med Microbiol Immunol. 2015. PMID: 25776080 Review.
-
Bright and Early: Inhibiting Human Cytomegalovirus by Targeting Major Immediate-Early Gene Expression or Protein Function.Viruses. 2020 Jan 16;12(1):110. doi: 10.3390/v12010110. Viruses. 2020. PMID: 31963209 Free PMC article. Review.
Cited by
-
Hypoxia-Inducible Factor 1α (HIF1α) Suppresses Virus Replication in Human Cytomegalovirus Infection by Limiting Kynurenine Synthesis.mBio. 2021 Mar 23;12(2):e02956-20. doi: 10.1128/mBio.02956-20. mBio. 2021. PMID: 33758082 Free PMC article.
-
Shear-Mediated Platelet Activation is Accompanied by Unique Alterations in Platelet Release of Lipids.Cell Mol Bioeng. 2021 Aug 25;14(6):597-612. doi: 10.1007/s12195-021-00692-x. eCollection 2021 Dec. Cell Mol Bioeng. 2021. PMID: 34900013 Free PMC article.
-
African Swine Fever Virus Regulates Host Energy and Amino Acid Metabolism To Promote Viral Replication.J Virol. 2022 Feb 23;96(4):e0191921. doi: 10.1128/JVI.01919-21. Epub 2021 Dec 15. J Virol. 2022. PMID: 34908441 Free PMC article.
-
Liver X Receptor-Inducible Host E3 Ligase IDOL Targets a Human Cytomegalovirus Reactivation Determinant.J Virol. 2023 Jul 27;97(7):e0075823. doi: 10.1128/jvi.00758-23. Epub 2023 Jun 20. J Virol. 2023. PMID: 37338407 Free PMC article.
-
Interrogating Host Antiviral Environments Driven by Nuclear DNA Sensing: A Multiomic Perspective.Biomolecules. 2020 Nov 24;10(12):1591. doi: 10.3390/biom10121591. Biomolecules. 2020. PMID: 33255247 Free PMC article. Review.
References
-
- Mocarski ES, Shenk T, Griffiths P, Pass RF. 2013. Cytomegaloviruses, p 1960–2014. In Knipe DM, Howley PM, Cohen JI, Griffin DE, Lamb RA, Martin MA, Racaniello VR, Roizman B (ed), Fields virology, 6th ed Lippincott Williams & Wilkins, Philadelphia, PA.
-
- Britt W. 2008. Manifestations of human cytomegalovirus infection: proposed mechanisms of acute and chronic disease. Curr Top Microbiol Immunol 325:417–470. - PubMed
-
- Goldmacher VS, Bartle LM, Skaletskaya A, Dionne CA, Kedersha NL, Vater CA, Han JW, Lutz RJ, Watanabe S, Cahir McFarland ED, Kieff ED, Mocarski ES, Chittenden T. 1999. A cytomegalovirus-encoded mitochondria-localized inhibitor of apoptosis structurally unrelated to Bcl-2. Proc Natl Acad Sci U S A 96:12536–12541. doi:10.1073/pnas.96.22.12536. - DOI - PMC - PubMed
Publication types
MeSH terms
Substances
LinkOut - more resources
Full Text Sources
Medical

