. 2019 Aug 5;8(8):837.
doi: 10.3390/cells8080837.

Emerging Role of l-Dopa Decarboxylase in Flaviviridae Virus Infections

Affiliations

Emerging Role of l-Dopa Decarboxylase in Flaviviridae Virus Infections

Efseveia Frakolaki et al. Cells. .

Abstract

l-dopa decarboxylase (DDC) that catalyzes the biosynthesis of bioactive amines, such as dopamine and serotonin, is expressed in the nervous system and peripheral tissues, including the liver, where its physiological role remains unknown. Recently, we reported a physical and functional interaction of DDC with the major signaling regulator phosphoinosite-3-kinase (PI3K). Here, we provide compelling evidence for the involvement of DDC in viral infections. Studying dengue (DENV) and hepatitis C (HCV) virus infection in hepatocytes and HCV replication in liver samples of infected patients, we observed a negative association between DDC and viral replication. Specifically, replication of both viruses reduced the levels of DDC mRNA and the ~120 kDa SDS-resistant DDC immunoreactive functional complex, concomitant with a PI3K-dependent accumulation of the ~50 kDa DDC monomer. Moreover, viral infection inhibited PI3K-DDC association, while DDC did not colocalize with viral replication sites. DDC overexpression suppressed DENV and HCV RNA replication, while DDC enzymatic inhibition enhanced viral replication and infectivity and affected DENV-induced cell death. Consistently, we observed an inverse correlation between DDC mRNA and HCV RNA levels in liver biopsies from chronically infected patients. These data reveal a novel relationship between DDC and Flaviviridae replication cycle and the role of PI3K in this process.

Keywords: dengue virus; hepatitis C virus; l-dopa decarboxylase; phosphoinosite-3-kinase (PI3K).


Conflict of interest statement

The authors declare no conflict of interest. The funders had no role in the design of the study; in the collection, analyses, or interpretation of data; in the writing of the manuscript, or in the decision to publish the results.

Figures
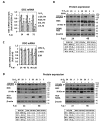
Figure 1
Figure 1
The impact of dengue (DENV) and hepatitis C (HCV) virus infection on the intracellular levels of l-dopa decarboxylase (DDC) mRNA and protein under 20% and 3% v/v O2. (A,B) Huh7 cells, preincubated at 20% or 3% v/v O2 for 18 h, were inoculated with cell-culture produced DENV virus particles (DV-2 16,681 strain, MOI = 1) for 4 h, washed twice with fresh culture medium, and further cultured for the indicated hours post-infection (p.i) under the respective oxygen condition. (A) Reverse transcription quantitative PCR (RT-qPCR) analysis of the intracellular total DDC mRNA levels from Huh7 DENV-infected cells. Values are expressed relative to the ones derived from mock-infected (M) cells under 20% O2 at each time-point. mRNA levels of the housekeeping gene 14-3-3-zeta polypeptide (YWHAZ) were used for normalization. Bars represent mean values from three independent experiments in triplicate. Error bars indicate standard deviations. * p < 0.001 vs. mock, # p < 0.001 vs. 20% O2. (b) (Top) Western blot analysis performed with (from top to bottom) anti-DDC-CT, anti-DENV NS3, or anti-β-actin antibodies. β-actin was used as loading control. Numbers on the right refer to the positions of molecular mass marker proteins. A representative experiment of three independent repetitions is shown. (Bottom) Densitometry analysis data for 120 kDa and 50 kDa DDC (mean values from three independent repetitions) were normalized to β-actin and to the values obtained with mock-infected cells. (C,D) Huh7.5 cells were inoculated for 4 h with cell-culture produced HCV virus (Jc1, MOI = 1) and further cultured for indicated h p.i under the respective oxygen condition. (C) RT-qPCR analysis of the total DDC mRNA levels from Huh7.5 Jc1-infected cells at 20% v/v O2. Values are expressed relative to the ones derived from mock-infected (M) cells at each time-point. YWHAZ mRNA levels were used for normalization. Error bars indicate standard deviations. * p < 0.001 vs. mock. (D) (Top) Western blot analysis of cells preincubated at 20% or 3% v/v O2 for 18 h before virus inoculation was performed using anti-DDC-CT, anti-HCV NS5A, or anti-β-actin antibodies. β-actin was used as loading control. A representative experiment of three independent repetitions is shown. (Bottom) Image quantification of DDC signals (mean values from three independent repetitions), normalized to β-actin and to the values obtained with mock-infected cells.
Figure 2
Figure 2
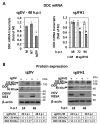
The effect of DENV and HCV genome replication on the intracellular levels of DDC mRNA and protein. (A,B) Huh7 and Huh7-Lunet cells were electroporated with in vitro transcribed subgenomic reporter DENV-2 16,681 RNA (sgDV; left) or HCV JFH1 RNA (sgJFH1; right), respectively (10 μg RNA/4 × 106 cells), and further cultured for the indicated h p.t under 20% O2. Non-transfected (NT) cells or cells mock-electroporated with a capped-polyadenylated Renilla luciferase expressing RNA (M) were used as controls. (A) RT-qPCR analysis of the total DDC mRNA levels of DENV-replicon (left) and HCV-replicon (right) transfected cells. Values are expressed relative to the ones derived from non-transfected (NT) cells or mock-transfected (M) cells, at each time-point. YWHAZ mRNA levels were used for normalization. Bars represent mean values from three independent experiments in triplicate. Error bars indicate standard deviations. * p < 0.001 vs. mock-transfected cells. (B) Western blot analysis using anti-DDC-CT, anti-DENV NS3 (left), or anti-HCV NS5A (right) and anti-β-actin antibodies. β-actin was used as loading control. A representative experiment of three independent repetitions is shown. (Bottom) Image quantification of DDC signals (mean values from three independent repetitions), normalized to β-actin and to the values obtained with mock-transfected cells.
Figure 3
Figure 3
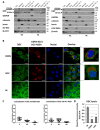
The influence of DENV and HCV infection on the subcellular fractionation and localization of DDC protein. (A) Subcellular distribution of DDC protein as detected by fractionation of Huh7 cells infected with DENV (DV-2 16681, MOI = 1) for 48 h (left), Huh7.5 cells infected with HCV (Jc1, MOI = 1) for 72 h (right) and mock-infected cells. Intracellular distribution of DDC protein in soluble cytosolic (Cyt), membrane-associated (Membr), nuclear (Nuc), and postnuclear insoluble (Post-Nuc) fractions was evaluated by Western blot analysis. GAPDH, calnexin, and lamin A served as specificity markers for the various fractions. The distribution of DENV NS3 and HCV NS5A were also analyzed. β-actin was used as loading control of infected and mock-infected cells. A representative experiment of three independent repetitions is shown for each virus. (BD) The subcellular localization of DDC, as detected by immunofluorescence, in relation to viral proteins in Huh7.5 cells infected with DENV (MOI = 1) for 48 h (upper panel) or Jc1 (MOI = 1) for 72 h (middle panel) or mock-infected cells (lower panel). (B) Immunofluorescence analysis of DDC (green) using anti-DDC C-T antibody, followed by confocal microscopy. DENV NS3 or HCV NS5A proteins were also stained with specific antibodies (red). Nuclei were stained with TO-PRO-3 iodide (blue). On the right, merged images of the green, red, and blue fluorescence are shown. Bar, 20 μΜ. White arrows indicate areas in the infected cells with high viral protein levels where DDC is absent. At the far right, magnifications of single cell images are presented. (C) Colocalization coefficients between DDC and viral proteins. Graphical representation of the Pearson correlation coefficient (R) and Manders’ colocalization coefficient (M1, M2) values between DDC and DENV NS3 (left) or HCV NS5A (right). Each spot represents a single analyzed infected cell. (D) Fold difference of mean DDC fluorescence intensity per cell, between DENV- or HCV-infected and mock-infected cells. Values are expressed relative to the ones derived from mock-infected (M) cells. Bars represent mean values obtained from three experiments (~30 analyzed cells/experiment). Error bars indicate standard deviations. * p < 0.001 vs. mock-infected cells.
Figure 4
Figure 4
The influence of DENV infection on the DDC-PI3K complex. (AC) Whole lysates of Huh7 DENV-infected cells (DV-2 16681, MOI = 1) at 48 h p.i were used in immunoprecipitation experiments, performed with anti-PI3K antibody. Western blot analysis was performed with anti-DDC-CT (A) or anti-PI3K (B) antibodies. Lysates from mock-infected cells were used as control. Lanes 1,2: Eluates of the co-immunoprecipitation (co-IP). Lane 3: Eluate of co-IP without lysate, used as a negative control (NC). Lanes 4, 5: Input cell lysates before co-IP. (C) Image quantification of co-immunoprecipitated DDC and PI3K signals (mean values from three independent repetitions), normalized to the values obtained with mock-transfected cells.
Figure 5
Figure 5
Effect of DDC overexpression on DENV replication. Huh7 or Huh7.5 cells were electroporated with pcDNA3.1(+)-DDC (pDDC) or the control vector, 24 h p.t were inoculated with DV-2 16,681 reporter (DVR2A, MOI = 0.1) or non-reporter (DENV, MOI = 1) virus or HCV Jc1 (MOI = 1) for 4 h, and were lysed at the indicated h p.i. (A) Left: DVR2A replication-derived Renilla luciferase (R-Luc) activity was quantified by chemiluminescence-based assay and expressed as relative light units (RLU) per μg of total protein amount. Right: DENV positive-strand RNA levels were quantified by RT-qPCR and YWHAZ mRNA was used for normalization. (B) Jc1 positive-strand RNA levels were quantified by RT-qPCR and normalized. Bars represent mean values from three independent experiments in triplicate. Error bars indicate standard deviations. * p < 0.01 vs. control, ** p < 0.001 vs. control. (CF) Total DDC mRNA and protein levels in cells electroporated with the pDDC plasmid or the control vector and then DENV-, HCV-, or mock-infected (M) for 48 h. (C) DDC mRNA levels were determined by RT-qPCR and normalized to YWHAZ mRNA. Bars represent mean values from three independent experiments in triplicate. Error bars indicate standard deviations. ** p < 0.001 vs. control vector-transfected cells. (DF) (Top) Western blot analysis was performed in the electroporated cells infected with DENV (D), HCV (E), or mock-infected (F), using anti-DDC-CT, anti-DENV NS3, or anti-HCV NS5A and anti-β-actin antibodies. β-actin was used as loading control. A representative experiment of three independent repetitions is shown. (Bottom) Image quantification of DDC and DENV NS3 or HCV NS5A signals (mean values from three independent repetitions), normalized to β-actin and to the values obtained with control vector-transfected cells.
Figure 6
Figure 6
Effect of the DDC inhibitor carbidopa on DENV and HCV replication and released infectivity. (A,B) Huh7 cells inoculated with DVR2A (MOI = 0.1) and Huh7.5 cells inoculated with JcR2A (MOI = 0.5) for 4 h, were treated, or not (control), with different concentrations of carbidopa for the indicated h p.i. Cells were then lysed and virus replication–derived R-Luc activity was determined (left). Naïve cells were inoculated for 4 h with supernatant from the infected cells treated or not with carbidopa for 48 or 72 h. Cells were lysed at 72 h p.i and R-Luc activity, indicative of the released infectivity levels of the first round of infection, was determined (right). Luciferase levels are expressed as RLU/μg of total protein amount. Values from control cells were set to one for each time point. Bars represent mean values from at least three independent experiments in triplicate. * p < 0.001 vs. control (C,E) Huh7 cells inoculated with DENV (DV-2 16681, MOI = 1) or Huh7.5 cells inoculated with HCV (Jc1, MOI = 1) for 4 h were treated with carbidopa (20 μM) and further cultured for 48 h p.i. (Top) Western blot analysis was performed in cell lysates using anti-DENV NS3 (B) or HCV NS5A (E), anti-DDC-CT, anti-PI3K, anti-P-AKT (phosphorylated AKT), and anti-β-actin antibodies. β-actin was used as loading control. Representative experiments of three independent repetitions are shown. (Bottom) Image quantification of DDC signals (mean values from three independent repetitions), normalized to β-actin and to the values obtained with mock-infected cells. (D) Effect of the DDC inhibitor carbidopa (20 μM) on DDC mRNA (left) and on intracellular ATP levels (right) of Huh7 cells inoculated for 4 h with DENV (DV-2 16681, MOI = 1) or mock-infected (M) and further cultured for 48 h. DDC mRNA was quantified by RT-qPCR and YWHAZ mRNA was used for normalization. ATP was measured using a chemiluminescence-based assay and expressed as RLU/μg of total protein amount. Values obtained from the control non-treated and mock-infected cells were set to 1 or 100%. Bars represent mean values from two independent experiments performed in triplicate. Error bars indicate standard deviations. * p < 0.05 vs. control, ** p < 0.001 vs. control.
Figure 7
Figure 7
Effect of PI3K inhibition on DENV- and HCV-mediated DDC protein regulation in infected cells. (AC) Huh7 cells inoculated with DV-2 16,681 non-reporter (DENV, MOI = 1) or reporter (DVR2A, MOI = 0.1) virus for 4 h, were treated with different concentrations of the PI3K inhibitor LY294002 for 48 h, respectively. (A) (Top) Western blot analysis of lysates of DENV- or mock-infected cells, treated or not with 2.5 μM LY294002, using anti-DDC-CT, anti-PI3K, anti-P-AKT, anti-DENV NS3, or anti-β-actin antibodies. β-actin was used as loading control. Representative experiments of three independent repetitions are shown. (Bottom) Image quantification of DDC signals (mean values from three independent repetitions), normalized to β-actin and to the values obtained with mock-infected cells. (B) RT-qPCR analysis of DDC mRNA levels, in DENV- or mock-infected cells, treated, or not with LY294002 at the specified concentrations. YWHAZ mRNA was used for normalization. (C) As control experiment, viral RNA replication in DVR2A-infected cells treated with LY294002 was determined by measurement of virus-derived R-Luc activity levels. Cells treated with the solvent DMSO were used as control. For the determination of released infectivity, naïve cells were inoculated for 4 h with supernatant of infected cells treated with LY294002 or DMSO. Then, cells were lysed at 72 h p.i and R-Luc activity was determined. * p < 0.05 vs. control, ** p < 0.01 vs. control, *** p < 0.001 vs. control. (D,E) Huh7.5 cells inoculated with Jc1 or JcR2A (MOI = 1) for 4 h were treated with different concentrations of LY294002 for 72 h. (D) (Top) Western blot analysis of lysates of HCV- or mock-infected cells, treated or not with 2.5 μM LY294002, using anti-DDC-CT, anti-P-AKT, anti-HCV NS5A, or anti-β-actin antibodies. β-actin was used as loading control. Representative experiments of three independent repetitions are shown. (Bottom) Image quantification of DDC signals (mean values from three independent repetitions), normalized to β-actin and to the values obtained with mock-infected cells. (E) Effect of LY294002 on JcR2A replication and released infectivity in infected Huh7.5 cells using the same experimental setup described for DVR2A in C. * p < 0.05 vs. control, ** p < 0.01 vs. control, *** p < 0.001 vs. control.
Figure 8
Figure 8
Inverse correlation between HCV RNA and DDC gene expression levels in human liver biopsies. (A) Total RNA was isolated from 12 liver samples (LB 1 to 12) from patients with chronic hepatitis C previously characterized for their HCV RNA amounts (right) with the branched DNA assay (Figure adapted from Vassilaki et al. 2013 [68], Copyright © American Society for Microbiology). The DDC mRNA in these samples was quantified by RT-qPCR (left). YWHAZ mRNA levels were used for normalization. Values are expressed relative to those obtained with sample LB 12. Bars represent mean values of DDC RNA copies from three technical replicates, and error bars indicate standard deviations. (B) XY scatter plot and linear regression analysis of log 2-transformed relative levels of DDC mRNA versus HCV genome. R2 indicates coefficient of determination.
Figure 9
Figure 9
Schematic representation of the proposed mechanism concerning the relationship between viral infection, DDC, and PI3K/AKT pathway. DENV or HCV infection downregulates DDC at three different levels: (1) downregulates DDC mRNA, (2) reduces the release of the 50 kDa DDC monomer from intracellular membranes and subsequent formation of the 120 kDa dimeric complex, possibly representing the catalytically active form of DDC, and (3) disturbs the binding between the 50 kDa DDC monomer and PI3K p55 subunit, which releases PI3K p55 to interact with PI3K p110 and increases the activity of the PI3K/AKT pathway in favor of cell survival and viral replication during all stages of HCV infection and at the early phase of DENV infection. In turn, the enzymatic activity of DDC downregulates DENV and HCV propagation.

Similar articles

Cited by

References

    1. Lindstrom P., Sehlin J. Mechanisms underlying the effects of 5-hydroxytryptamine and 5-hydroxytryptophan in pancreatic islets. A proposed role for L-aromatic amino acid decarboxylase. Endocrinology. 1983;112:1524–1529. doi: 10.1210/endo-112-4-1524. - DOI - PubMed
    1. Dyck L.E., Yang C.R., Boulton A.A. The biosynthesis of p-tyramine, m-tyramine, and beta-phenylethylamine by rat striatal slices. J. Neurosci. Res. 1983;10:211–220. doi: 10.1002/jnr.490100209. - DOI - PubMed
    1. Paterson I.A., Juorio A.V., Boulton A.A. 2-Phenylethylamine: A modulator of catecholamine transmission in the mammalian central nervous system? J. Neurochem. 1990;55:1827–1837. doi: 10.1111/j.1471-4159.1990.tb05764.x. - DOI - PubMed
    1. Christenson J.G., Dairman W., Udenfriend S. Preparation and properties of a homogeneous aromatic L-amino acid decarboxylase from hog kidney. Arch. Biochem. Biophys. 1970;141:356–367. doi: 10.1016/0003-9861(70)90144-X. - DOI - PubMed
    1. Adam W.R., Culvenor A.J., Hall J., Jarrott B., Wellard R.M. Aromatic L-amino acid decarboxylase: Histochemical localization in rat kidney and lack of effect of dietary potassium or sodium loading on enzyme distribution. Clin. Exp. Pharmacol. Phys. 1986;13:47–53. doi: 10.1111/j.1440-1681.1986.tb00314.x. - DOI - PubMed

Publication types

Substances

LinkOut - more resources