Primary HIV-1 Strains Use Nef To Downmodulate HLA-E Surface Expression
- PMID: 31375574
- PMCID: PMC6798123
- DOI: 10.1128/JVI.00719-19
Primary HIV-1 Strains Use Nef To Downmodulate HLA-E Surface Expression
Abstract
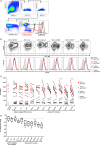
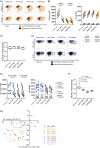
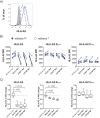
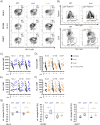
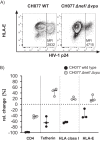
Human immunodeficiency virus type 1 (HIV-1) has evolved elaborate ways to evade immune cell recognition, including downregulation of classical HLA class I (HLA-I) from the surfaces of infected cells. Recent evidence identified HLA-E, a nonclassical HLA-I, as an important part of the antiviral immune response to HIV-1. Changes in HLA-E surface levels and peptide presentation can prompt both CD8+ T-cell and natural killer (NK) cell responses to viral infections. Previous studies reported unchanged or increased HLA-E levels on HIV-1-infected cells. Here, we examined HLA-E surface levels following infection of CD4+ T cells with primary HIV-1 strains and observed that a subset downregulated HLA-E. Two primary strains of HIV-1 that induced the strongest reduction in surface HLA-E expression were chosen for further testing. Expression of single Nef or Vpu proteins in a T-cell line, as well as tail swap experiments exchanging the cytoplasmic tail of HLA-A2 with that of HLA-E, demonstrated that Nef modulated HLA-E surface levels and targeted the cytoplasmic tail of HLA-E. Furthermore, infection of primary CD4+ T cells with HIV-1 mutants showed that a lack of functional Nef (and Vpu to some extent) impaired HLA-E downmodulation. Taken together, the results of this study demonstrate for the first time that HIV-1 can downregulate HLA-E surface levels on infected primary CD4+ T cells, potentially rendering them less vulnerable to CD8+ T-cell recognition but at increased risk of NKG2A+ NK cell killing.IMPORTANCE For almost two decades, it was thought that HIV-1 selectively downregulated the highly expressed HLA-I molecules HLA-A and HLA-B from the cell surface in order to evade cytotoxic-T-cell recognition, while leaving HLA-C and HLA-E molecules unaltered. It was stipulated that HIV-1 infection thereby maintained inhibition of NK cells via inhibitory receptors that bind HLA-C and HLA-E. This concept was recently revised when a study showed that primary HIV-1 strains reduce HLA-C surface levels, whereas the cell line-adapted HIV-1 strain NL4-3 lacks this ability. Here, we demonstrate that infection with distinct primary HIV-1 strains results in significant downregulation of surface HLA-E levels. Given the increasing evidence for HLA-E as an important modulator of CD8+ T-cell and NKG2A+ NK cell functions, this finding has substantial implications for future immunomodulatory approaches aimed at harnessing cytotoxic cellular immunity against HIV.
Keywords: HIV-1; HLA-E; Nef.
Copyright © 2019 American Society for Microbiology.
Figures
Similar articles
-
HLA Class I Downregulation by HIV-1 Variants from Subtype C Transmission Pairs.J Virol. 2018 Mar 14;92(7):e01633-17. doi: 10.1128/JVI.01633-17. Print 2018 Apr 1. J Virol. 2018. PMID: 29321314 Free PMC article.
-
The human immunodeficiency virus type 1 Nef and Vpu proteins downregulate the natural killer cell-activating ligand PVR.J Virol. 2012 Apr;86(8):4496-504. doi: 10.1128/JVI.05788-11. Epub 2012 Feb 1. J Virol. 2012. PMID: 22301152 Free PMC article.
-
Relative Resistance of HLA-B to Downregulation by Naturally Occurring HIV-1 Nef Sequences.mBio. 2016 Jan 19;7(1):e01516-15. doi: 10.1128/mBio.01516-15. mBio. 2016. PMID: 26787826 Free PMC article.
-
HIV's evasion of the cellular immune response.Immunol Rev. 1999 Apr;168:65-74. doi: 10.1111/j.1600-065x.1999.tb01283.x. Immunol Rev. 1999. PMID: 10399065 Review.
-
Human leukocyte antigen (HLA) class I down-regulation by human immunodeficiency virus type 1 negative factor (HIV-1 Nef): what might we learn from natural sequence variants?Viruses. 2012 Sep;4(9):1711-30. doi: 10.3390/v4091711. Epub 2012 Sep 24. Viruses. 2012. PMID: 23170180 Free PMC article. Review.
Cited by
-
Implications of NKG2A in immunity and immune-mediated diseases.Front Immunol. 2022 Aug 10;13:960852. doi: 10.3389/fimmu.2022.960852. eCollection 2022. Front Immunol. 2022. PMID: 36032104 Free PMC article. Review.
-
Programming cytomegalovirus as an HIV vaccine.Trends Immunol. 2023 Apr;44(4):287-304. doi: 10.1016/j.it.2023.02.001. Epub 2023 Mar 7. Trends Immunol. 2023. PMID: 36894436 Free PMC article. Review.
-
CD4 downregulation precedes Env expression and protects HIV-1-infected cells from ADCC mediated by non-neutralizing antibodies.mBio. 2024 Nov 13;15(11):e0182724. doi: 10.1128/mbio.01827-24. Epub 2024 Oct 7. mBio. 2024. PMID: 39373535 Free PMC article.
-
Disruption of the HLA-E/NKG2X axis is associated with uncontrolled HIV infections.Front Immunol. 2022 Nov 18;13:1027855. doi: 10.3389/fimmu.2022.1027855. eCollection 2022. Front Immunol. 2022. PMID: 36466823 Free PMC article.
-
The role of donor-unrestricted T-cells, innate lymphoid cells, and NK cells in anti-mycobacterial immunity.Immunol Rev. 2021 May;301(1):30-47. doi: 10.1111/imr.12948. Epub 2021 Feb 2. Immunol Rev. 2021. PMID: 33529407 Free PMC article. Review.
References
-
- Fellay J, Shianna KV, Ge D, Colombo S, Ledergerber B, Weale M, Zhang K, Gumbs C, Castagna A, Cossarizza A, Cozzi-Lepri A, De Luca A, Easterbrook P, Francioli P, Mallal S, Martinez-Picado J, Miro JM, Obel N, Smith JP, Wyniger J, Descombes P, Antonarakis SE, Letvin NL, McMichael AJ, Haynes BF, Telenti A, Goldstein DB. 2007. A whole-genome association study of major determinants for host control of HIV-1. Science 317:944–947. doi:10.1126/science.1143767. - DOI - PMC - PubMed
-
- Kuniholm MH, Gao X, Xue X, Kovacs A, Anastos K, Marti D, Greenblatt RM, Cohen MH, Minkoff H, Gange SJ, Fazzari M, Young MA, Strickler HD, Carrington M. 2011. Human leukocyte antigen genotype and risk of HIV disease progression before and after initiation of antiretroviral therapy. J Virol 85:10826–10833. doi:10.1128/JVI.00804-11. - DOI - PMC - PubMed
-
- Pereyra F, Jia X, McLaren PJ, Telenti A, de Bakker PIW, Walker BD, Ripke S, Brumme CJ, Pulit SL, Carrington M, Kadie CM, Carlson JM, Heckerman D, Graham RR, Plenge RM, Deeks SG, Gianniny L, Crawford G, Sullivan J, Gonzalez E, Davies L, Camargo A, Moore JM, Beattie N, Gupta S, Crenshaw A, Burtt NP, Guiducci C, Gupta N, Gao X, Qi Y, Yuki Y, Piechocka-Trocha A, Cutrell E, Rosenberg R, Moss KL, Lemay P, O’Leary J, Schaefer T, Verma P, Toth I, Block B, Baker B, Rothchild A, Lian J, Proudfoot J, Alvino DML, Vine S, Addo MM, Allen TM, Altfeld M, Henn MR, Le Gall S, Streeck H, Haas DW, Kuritzkes DR, Robbins GK, Shafer RW, Gulick RM, Shikuma CM, Haubrich R, Riddler S, Sax PE, Daar ES, Ribaudo HJ, Agan B, Agarwal S, Ahern RL, Allen BL, Altidor S, Altschuler EL, Ambardar S, Anastos K, Anderson B, Anderson V, Andrady U, Antoniskis D, Bangsberg D, Barbaro D, Barrie W, Bartczak J, Barton S, Basden P, Basgoz N, Bazner S, Bellos NC, Benson AM, Berger J, Bernard NF, Bernard AM, Birch C, Bodner SJ, Bolan RK, Boudreaux ET, Bradley M, Braun JF, Brndjar JE, Brown SJ, Brown K, Brown ST, Burack J, Bush LM, Cafaro V, Campbell O, Campbell J, Carlson RH, Carmichael JK, Casey KK, Cavacuiti C, Celestin G, Chambers ST, Chez N, Chirch LM, Cimoch PJ, Cohen D, Cohn LE, Conway B, Cooper DA, Cornelson B, Cox DT, Cristofano MV, Cuchural G, Czartoski JL, Dahman JM, Daly JS, Davis BT, Davis K, Davod SM, DeJesus E, Dietz CA, Dunham E, Dunn ME, Ellerin TB, Eron JJ, Fangman JJW, Farel CE, Ferlazzo H, Fidler S, Fleenor-Ford A, Frankel R, Freedberg KA, French NK, Fuchs JD, Fuller JD, Gaberman J, Gallant JE, Gandhi RT, Garcia E, Garmon D, Gathe JC, Gaultier CR, Gebre W, Gilman FD, Gilson I, Goepfert PA, Gottlieb MS, Goulston C, Groger RK, Gurley TD, Haber S, Hardwicke R, Hardy WD, Harrigan PR, Hawkins TN, Heath S, Hecht FM, Henry WK, Hladek M, Hoffman RP, Horton JM, Hsu RK, Huhn GD, Hunt P, Hupert MJ, Illeman ML, Jaeger H, Jellinger RM, John M, Johnson JA, Johnson KL, Johnson H, Johnson K, Joly J, Jordan WC, Kauffman CA, Khanlou H, Killian RK, Kim AY, Kim DD, Kinder CA, Kirchner JT, Kogelman L, Kojic EM, Korthuis PT, Kurisu W, Kwon DS, LaMar M, Lampiris H, Lanzafame M, Lederman MM, Lee DM, Lee JML, Lee MJ, Lee ETY, Lemoine J, Levy JA, Llibre JM, Liguori MA, Little SJ, Liu AY, Lopez AJ, Loutfy MR, Loy D, Mohammed DY, Man A, Mansour MK, Marconi VC, Markowitz M, Marques R, Martin JN, Martin HL, Mayer KH, McElrath MJ, McGhee TA, McGovern BH, McGowan K, McIntyre D, Mcleod GX, Menezes P, Mesa G, Metroka CE, Meyer-Olson D, Miller AO, Montgomery K, Mounzer KC, Nagami EH, Nagin I, Nahass RG, Nelson MO, Nielsen C, Norene DL, O’Connor DH, Ojikutu BO, Okulicz J, Oladehin OO, Oldfield EC, Olender SA, Ostrowski M, Owen WF, Pae E, Parsonnet J, Pavlatos AM, Perlmutter AM, Pierce MN, Pincus JM, Pisani L, Price LJ, Proia L, Prokesch RC, Pujet HC, Ramgopal M, Rathod A, Rausch M, Ravishankar J, Rhame FS, Richards CS, Richman DD, Rodes B, Rodriguez M, Rose RC, Rosenberg ES, Rosenthal D, Ross PE, Rubin DS, Rumbaugh E, Saenz L, Salvaggio MR, Sanchez WC, Sanjana VM, Santiago S, Schmidt W, Schuitemaker H, Sestak PM, Shalit P, Shay W, Shirvani VN, Silebi VI, Sizemore JM, Skolnik PR, Sokol-Anderson M, Sosman JM, Stabile P, Stapleton JT, Starrett S, Stein F, Stellbrink H-J, Sterman FL, Stone VE, Stone DR, Tambussi G, Taplitz RA, Tedaldi EM, Telenti A, Theisen W, Torres R, Tosiello L, Tremblay C, Tribble MA, Trinh PD, Tsao A, Ueda P, Vaccaro A, Valadas E, Vanig TJ, Vecino I, Vega VM, Veikley W, Wade BH, Walworth C, Wanidworanun C, Ward DJ, Warner DA, Weber RD, Webster D, Weis S, Wheeler DA, White DJ, Wilkins E, Winston A, Wlodaver CG, van’t Wout A, Wright DP, Yang OO, Yurdin DL, Zabukovic BW, Zachary KC, Zeeman B, Zhao M. 2010. The major genetic determinants of HIV-1 control affect HLA class I peptide presentation. Science 330:1551–1557. doi:10.1126/science.1195271. - DOI - PMC - PubMed
-
- Magierowska M, Theodorou I, Debré P, Sanson F, Autran B, Rivière Y, Charron D, Costagliola D. 1999. Combined genotypes of CCR5, CCR2, SDF1, and HLA genes can predict the long-term nonprogressor status in human immunodeficiency virus-1-infected individuals. Blood 93:936–941. - PubMed
-
- Flores-Villanueva PO, Yunis EJ, Delgado JC, Vittinghoff E, Buchbinder S, Leung JY, Uglialoro AM, Clavijo OP, Rosenberg ES, Kalams SA, Braun JD, Boswell SL, Walker BD, Goldfeld AE. 2001. Control of HIV-1 viremia and protection from AIDS are associated with HLA-Bw4 homozygosity. Proc Natl Acad Sci U S A 98:5140–5145. doi:10.1073/pnas.071548198. - DOI - PMC - PubMed
Publication types
MeSH terms
Substances
Grants and funding
LinkOut - more resources
Full Text Sources
Medical
Molecular Biology Databases
Research Materials

