. 2019 Sep 27;294(39):14241-14256.
doi: 10.1074/jbc.RA119.008733. Epub 2019 Aug 2.

Autophagy activation promotes clearance of α-synuclein inclusions in fibril-seeded human neural cells

Affiliations

Autophagy activation promotes clearance of α-synuclein inclusions in fibril-seeded human neural cells

Jianqun Gao et al. J Biol Chem. .

Abstract

There is much interest in delineating the mechanisms by which the α-synuclein protein accumulates in brains of individuals with Parkinson's disease (PD). Preclinical studies with rodent and primate models have indicated that fibrillar forms of α-synuclein can initiate the propagation of endogenous α-synuclein pathology. However, the underlying mechanisms by which α-synuclein fibrils seed pathology remain unclear. To investigate this further, we have used exogenous fibrillar α-synuclein to seed endogenous α-synuclein pathology in human neuronal cell lines, including primary human neurons differentiated from induced pluripotent stem cells. Fluorescence microscopy and immunoblot analyses were used to monitor levels of α-synuclein and key autophagy/lysosomal proteins over time in the exogenous α-synuclein fibril-treated neurons. We observed that temporal changes in the accumulation of cytoplasmic α-synuclein inclusions were associated with changes in the key autophagy/lysosomal markers. Of note, chloroquine-mediated blockade of autophagy increased accumulation of α-synuclein inclusions, and rapamycin-induced activation of autophagy, or use of 5'-AMP-activated protein kinase (AMPK) agonists, promoted the clearance of fibril-mediated α-synuclein pathology. These results suggest a key role for autophagy in clearing fibrillar α-synuclein pathologies in human neuronal cells. We propose that our findings may help inform the development of human neural cell models for screening of potential therapeutic compounds for PD or for providing insight into the mechanisms of α-synuclein propagation. Our results further add to existing evidence that AMPK activation may be a therapeutic option for managing PD.

Keywords: AMP-activated kinase (AMPK); Lewy bodies; Parkinson disease; autophagy; neurodegeneration; neuron; p62 (sequestosome 1 (SQSTM1)); protein degradation; protein fibril; α-synuclein (α-synuclein).


Conflict of interest statement

The authors declare that they have no conflicts of interest with the contents of this article

Figures
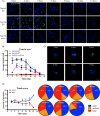
Figure 1.
Figure 1.
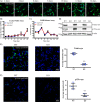
Temporal changes in cytoplasmic α-synuclein inclusions following treatment of SH-SY5Y cells with PFFs. A, SH-SY5Y cells were treated with PFFs or α-synuclein monomer as indicated and then fixed for immunofluorescence staining of total α-synuclein (green) at the indicated time points. The blue is DAPI staining. Images were taken at 40× objective magnification. The scale bar is 25 μm. B, average intensity of particles >2 μm2 per cell were compared between PFF- and monomer-treated groups over time. Up to eight images, each containing 50–100 cells per image, were analyzed for each treatment condition. Data are shown as mean ± S.D. (error bars). C, representative images taken at 100× magnification show the morphology of α-synuclein inclusions (green) in SH-SY5Y cells treated with 5 μg/ml PFFs. The scale bar is 10 μm. D, the relative percentage of small (2–5 μm2), medium (5–10 μm2), and large (>10 μm2) α-synuclein (α-syn) inclusions in SH-SY5Y cells treated with 5 μg/ml PFFs and fixed at each time point are shown in the pie charts, with the quantified comparison between treatment groups shown in line graph as mean ± S.D. (error bars). Four to eight images were analyzed for each time point.
Figure 2.
Figure 2.
Cell toxicity and antibody specificity in SH-SY5Y cells treated with PFFs. A, differentiated SH-SY5Y cells were treated with 5 μg/ml PFFs, fixed at the indicated time points, and immunostained for β3-tubulin staining (green). The blue stain is DAPI. Images were taken at 40× objective magnification. The scale bar is 25 μm. B, the viability of SH-SY5Y cells after treatment with 5 μg/ml PFFs over time was measured by crystal violet assay. Results are shown as mean absorbance ±S.D. (error bars). C, lactate dehydrogenase levels in SH-SY5Y cells after treatment with 5 μg/ml PFFs over time was measured using a colorimetric cytotoxicity assay. Results are shown as the mean percentage of cytotoxicity to maximum lactate dehydrogenase release ±S.D. (error bars). D, WT and α-synuclein–knockout (KO) SH-SY5Y cells lysates were used to immunoblot for total and Ser-129–phosphorylated α-synuclein (α-syn), with β-actin as a loading control. WT and α-synuclein–knockout SH-SY5Y cells were treated with 5 μg/ml PFFs and after 6 days immunostained for total α-synuclein (green) (E) or Ser-129–phosphorylated α-synuclein (F). The blue stain is DAPI. The graph shows the mean intensity of total or phosphorylated α-synuclein per cell ±S.D. (error bars). Student's t test was used to compare knockout cells with WT. For all images, the scale bar is 25 μm. All experiments were performed at least twice with all assays at least in triplicate.
Figure 3.
Figure 3.
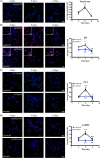
Temporal changes in autophagy markers following treatment of SH-SY5Y cells with PFFs. Differentiated SH-SY5Y cells were treated with or without 2 μg/ml α-synuclein PFFs and fixed for immunofluorescence at the time points indicated. Cells were immunostained for total α-synuclein (α-syn) (green) (A), SQSTM1/p62 (red) (B), LC3 (green) (C), or LAMP2 (yellow) (D). Scale bars are 25 μm (10 μm in insets). The blue stain is DAPI. Four to eight images containing 50–100 cells per image were analyzed for each time point. Graphs show the mean intensity of each marker per cell ±S.D. (error bars). One-way ANOVA was used to compare later time points with day 4. **, p < 0.01; ****, p < 0.0001; n.s., not significant.
Figure 4.
Figure 4.
Activation of autophagy promotes α-synuclein inclusion clearance in SH-SY5Y cells. Differentiated SH-SY5Y cells were treated with 2 μg/ml PFFs in the presence or absence of 0.5 μm rapamycin (Rap) for up to 8 days. Images were taken at 40× magnification for the analysis of total α-synuclein (α-syn) immunofluorescence (green) (A) and at 60× magnification for the analysis of p62 immunofluorescence (red) (B). Scale bars are 25 μm (10 μm in insets). The blue stain is DAPI. Four to eight images containing 50–100 cells per image were analyzed for each time point. Graphs show the mean intensity per cell ±S.D. (error bars). Student's t test was used to compare ±rapamycin-treated groups at each time point. ***, p < 0.001; ****, p < 0.0001.
Figure 5.
Figure 5.
Blockade of autophagy prevents α-synuclein inclusion clearance in SH-SY5Y cells. Differentiated SH-SY5Y cells were treated with 2 μg/ml α-synuclein (α-syn) PFFs, and after 6 days cells were incubated in the presence or absence of 20 μm chloroquine (CQ) for a further 48 h. Images were taken at 40× magnification for the analysis of total α-synuclein immunofluorescence (green) (A) and at 60× magnification for the analysis of p62 immunofluorescence (red) (B), LC3 immunofluorescence (green) (C), or LAMP2 immunofluorescence (yellow) (D). Scale bars are 25 μm (10 μm in insets). The blue stain is DAPI. Four to eight images containing 50–100 cells per image were analyzed for each condition. Graphs show the mean intensity per cell ±S.D. (error bars). Student's t test was used to compare the ±chloroquine groups. **, p < 0.01; ****, p < 0.0001; n.s., not significant.
Figure 6.
Figure 6.
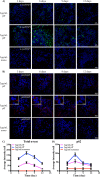
Transient changes in α-synuclein inclusions and autophagy in IPSC-derived neurons treated with PFFs. Differentiated IPSC-derived neurons were treated with 2 or 5 μg/ml PFFs or α-synuclein (α-syn) monomer. Cells were fixed at the indicated time points for immunofluorescence analysis of total α-synuclein (green; 40× magnification) (A) and p62 (red; 60× magnification) (B). Scale bars are 25 μm (10 μm in insets). The blue stain is DAPI. Four to eight images containing 50–100 cells per image were analyzed for each condition. The average intensity of α-synuclein (C) or p62 (D) immunofluorescence was determined for the PFF- and monomer-treated groups. Results are shown in the graphs as mean ± S.D. (error bars).
Figure 7.
Figure 7.
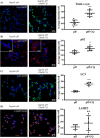
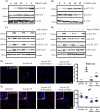
AMPK agonists promote α-synuclein inclusion clearance in SH-SY5Y cells. Differentiated SH-SY5Y cells were treated with the indicated concentrations of AMPK agonist GSK621 (A) or A769662 (B) for 5 h before immunoblotting for the indicated proteins. Representative immunoblots are shown from at least three independent experiments. Differentiated SH-SY5Y cells were treated with or without 5 μm GSK621 (C) or 30 μm A769662 (D) for 5 h before immunoblotting for the indicated proteins. Representative immunoblots are shown from at least three independent experiments. Differentiated SH-SY5Y cells were treated with 5 μg/ml PFFs in the presence or absence of 5 μm GSK621 or 30 μm A769662 for 6 days. Cells were fixed and immunostained for total α-synuclein (α-syn) (green) (E) or p62 (red) (F). Scale bars are 25 μm (10 μm in insets). The blue stain is DAPI. Confocal images are representative of seven images containing 50–100 cells per image that were used for analysis of staining intensity, with quantified results in the graphs showing mean intensity per cell ±S.D. (error bars). One-way ANOVA with Tukey's post hoc test was used for comparison. ****, p < 0.0001; n.s., not significant.
Figure 8.
Figure 8.
AMPK agonists promote α-synuclein inclusion clearance in IPSC-derived neurons. Differentiated IPSC-neurons were treated with 5 μg/ml PFFs and with or without 5 μm GSK621 or 30 μm A769662. After 6 days, cells were fixed and immunostained for total α-synuclein (α-syn) (green) (A), p62 (red) (B), LC3 (green) (C), or LAMP2 (red) (D). Scale bars are 25 μm (10 μm in insets). The blue stain is DAPI. Confocal images are representative of seven images containing 50–100 cells per image that were used for analysis of staining intensity, with quantified results in the graphs showing mean intensity per cell ±S.D. (error bars). One-way ANOVA with Tukey's post hoc test was used for comparison. *, p < 0.05; **, p < 0.01; ****, p < 0.0001; n.s., not significant.

Similar articles

Cited by

References

    1. Braak H., Del Tredici K., Rüb U., de Vos R. A., Jansen Steur E. N., and Braak E. (2003) Staging of brain pathology related to sporadic Parkinson's disease. Neurobiol. Aging 24, 197–211 10.1016/S0197-4580(02)00065-9 - DOI - PubMed
    1. Halliday G., Hely M., Reid W., and Morris J. (2008) The progression of pathology in longitudinally followed patients with Parkinson's disease. Acta Neuropathol. 115, 409–415 10.1007/s00401-008-0344-8 - DOI - PubMed
    1. Olanow C. W., and Brundin P. (2013) Parkinson's disease and α synuclein: is Parkinson's disease a prion-like disorder? Mov. Disord. 28, 31–40 10.1002/mds.25373 - DOI - PubMed
    1. Steiner J. A., Quansah E., and Brundin P. (2018) The concept of α-synuclein as a prion-like protein: ten years after. Cell Tissue Res. 373, 161–173 10.1007/s00441-018-2814-1 - DOI - PMC - PubMed
    1. Kordower J. H., Chu Y., Hauser R. A., Freeman T. B., and Olanow C. W. (2008) Lewy body-like pathology in long-term embryonic nigral transplants in Parkinson's disease. Nat. Med. 14, 504–506 10.1038/nm1747 - DOI - PubMed

Publication types