

Bioactivation mechanisms of N-hydroxyaristolactams: Nitroreduction metabolites of aristolochic acids
- PMID: 31374128
- PMCID: PMC6899766
- DOI: 10.1002/em.22321
Bioactivation mechanisms of N-hydroxyaristolactams: Nitroreduction metabolites of aristolochic acids
Abstract
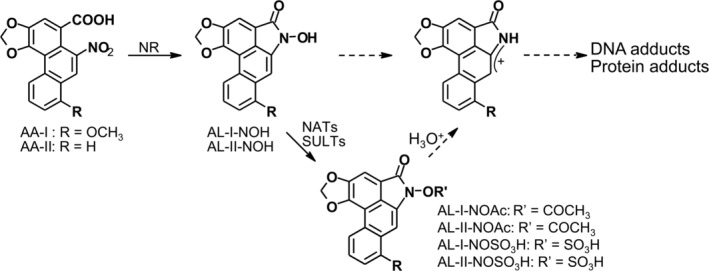
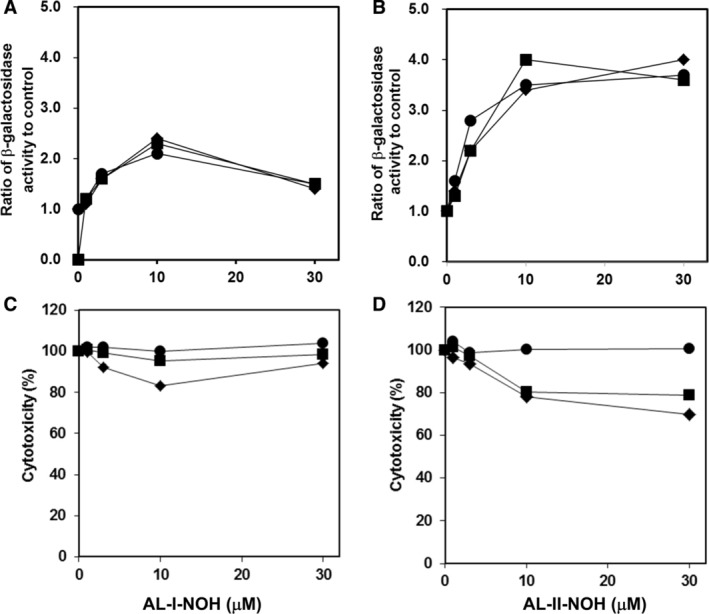
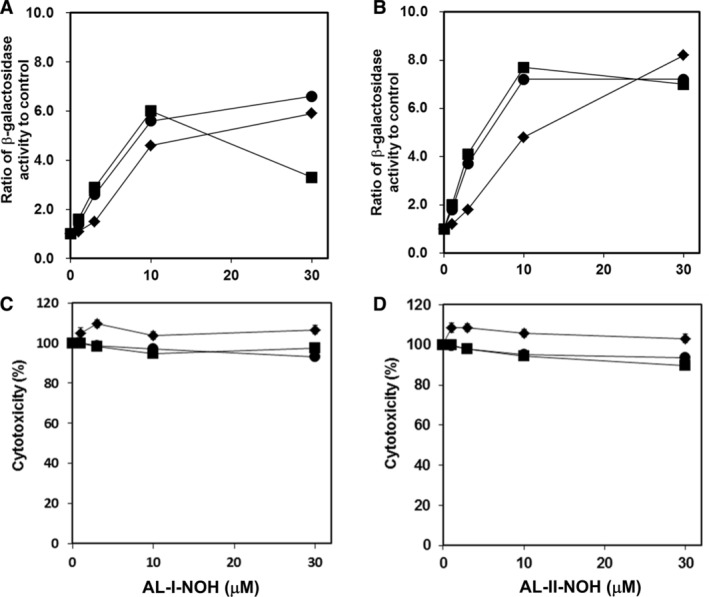
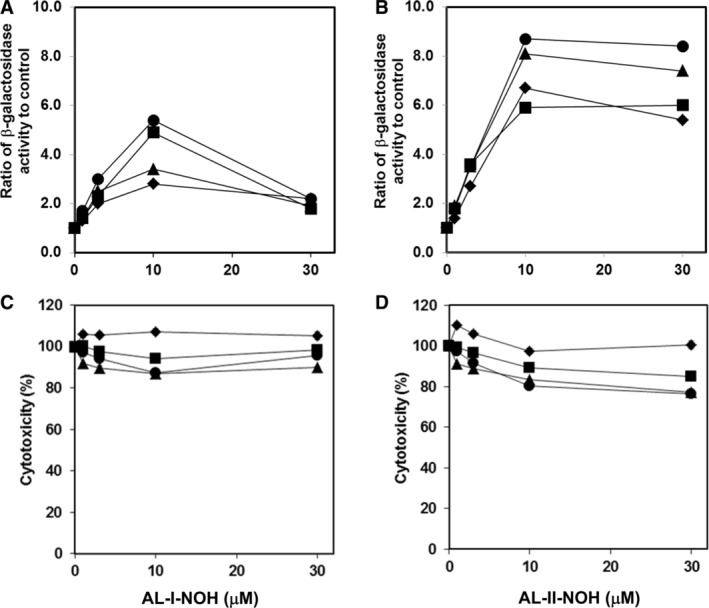
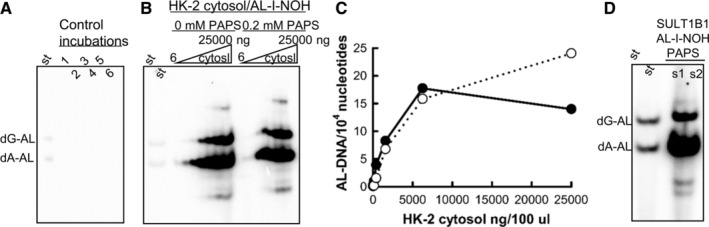
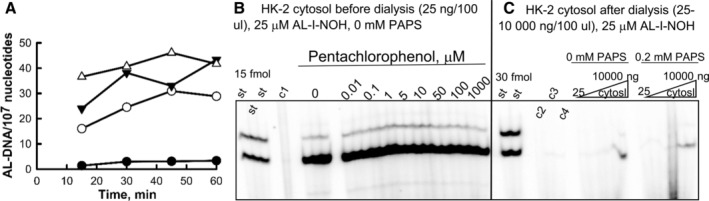
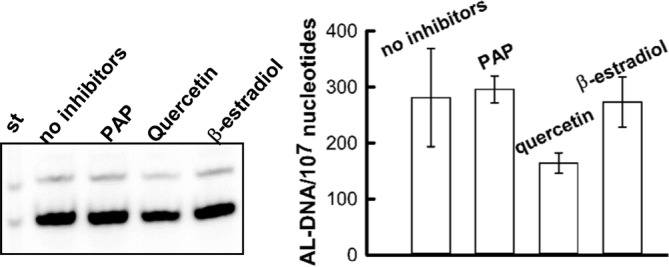
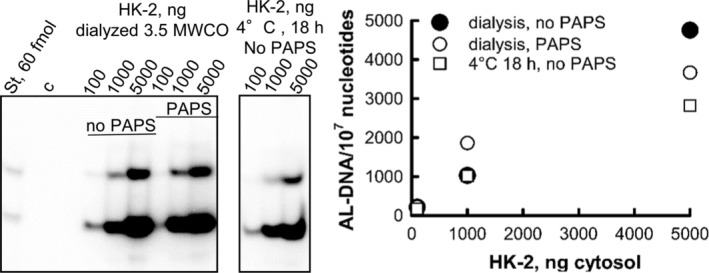
Aristolochic acids (AAs) are human nephrotoxins and carcinogens found in concoctions of Aristolochia plants used in traditional medicinal practices worldwide. Genotoxicity of AAs is associated with the formation of active species catalyzed by metabolic enzymes, the full repertoire of which is unknown. Recently, we provided evidence that sulfonation is important for bioactivation of AAs. Here, we employ Salmonella typhimurium umu tester strains expressing human N-acetyltransferases (NATs) and sulfotransferases (SULTs), to study the role of conjugation reactions in the genotoxicities of N-hydroxyaristolactams (AL-I-NOH and AL-II-NOH), metabolites of AA-I and AA-II. Both N-hydroxyaristolactams show stronger genotoxic effects in umu strains expressing human NAT1 and NAT2, than in the parent strain. Additionally, AL-I-NOH displays increased genotoxicity in strains expressing human SULT1A1 and SULT1A2, whereas AL-II-NOH shows enhanced genotoxicity in SULT1A1/2 and SULT1A3 strains. 2,6-Dichloro-4-nitrophenol, SULTs inhibitor, reduced umuC gene expression induced by N-hydroxyaristolactams in SULT1A2 strain. N-hydroxyaristolactams are also mutagenic in parent strains, suggesting that an additional mechanism(s) may contribute to their genotoxicities. Accordingly, using putative SULT substrates and inhibitors, we found that cytosols obtained from human kidney HK-2 cells activate N-hydroxyaristolactams in aristolactam-DNA adducts with the limited involvement of SULTs. Removal of low-molecular-weight reactants in the 3.5-10 kDa range inhibits the formation of aristolactam-DNA by 500-fold, which could not be prevented by the addition of cofactors for SULTs and NATs. In conclusion, our results demonstrate that the genotoxicities of N-hydroxyaristolactams depend on the cell type and involve not only sulfonation but also N,O-acetyltransfer and an additional yet unknown mechanism(s). Environ. Mol. Mutagen. 2019. © 2019 Wiley Periodicals, Inc.
Keywords: N,O-acetyltransfer; umu test; HK-2 cytosols; aristolactam-DNA adducts; sulfonation.
© 2019 The Authors. Environmental and Molecular Mutagenesis published by Wiley Periodicals, Inc. on behalf of Environmental Mutagen Society.
Conflict of interest statement
The authors declare no conflict of interests.
Figures
Similar articles
-
Sulfotransferase-1A1-dependent bioactivation of aristolochic acid I and N-hydroxyaristolactam I in human cells.Carcinogenesis. 2016 Jul;37(7):647-655. doi: 10.1093/carcin/bgw045. Epub 2016 Apr 18. Carcinogenesis. 2016. PMID: 27207664 Free PMC article.
-
Comparison of activation of aristolochic acid I and II with NADPH:quinone oxidoreductase, sulphotransferases and N-acetyltranferases.Neuro Endocrinol Lett. 2011;32 Suppl 1:57-70. Neuro Endocrinol Lett. 2011. PMID: 22167209
-
Metabolic activation of the environmental contaminant 3-nitrobenzanthrone by human acetyltransferases and sulfotransferase.Carcinogenesis. 2002 Nov;23(11):1937-45. doi: 10.1093/carcin/23.11.1937. Carcinogenesis. 2002. PMID: 12419844
-
Aristolochic acid as a probable human cancer hazard in herbal remedies: a review.Mutagenesis. 2002 Jul;17(4):265-77. doi: 10.1093/mutage/17.4.265. Mutagenesis. 2002. PMID: 12110620 Review.
-
Mechanisms of enzyme-catalyzed reduction of two carcinogenic nitro-aromatics, 3-nitrobenzanthrone and aristolochic acid I: Experimental and theoretical approaches.Int J Mol Sci. 2014 Jun 10;15(6):10271-95. doi: 10.3390/ijms150610271. Int J Mol Sci. 2014. PMID: 24918288 Free PMC article. Review.
Cited by
-
Cytotoxicity and genotoxicity of the carcinogen aristolochic acid I (AA-I) in human bladder RT4 cells.Arch Toxicol. 2021 Jun;95(6):2189-2199. doi: 10.1007/s00204-021-03059-3. Epub 2021 May 3. Arch Toxicol. 2021. PMID: 33938965 Free PMC article.
-
Aristolochic acid-associated cancers: a public health risk in need of global action.Nat Rev Cancer. 2022 Oct;22(10):576-591. doi: 10.1038/s41568-022-00494-x. Epub 2022 Jul 19. Nat Rev Cancer. 2022. PMID: 35854147 Review.
-
GPX3 rs8177412 Polymorphism Modifies Risk of Upper Urothelial Tumors in Patients with Balkan Endemic Nephropathy.Medicina (Kaunas). 2023 Aug 4;59(8):1421. doi: 10.3390/medicina59081421. Medicina (Kaunas). 2023. PMID: 37629712 Free PMC article.
-
Protective Effects of Mitochondrial Uncoupling Protein 2 against Aristolochic Acid I-Induced Toxicity in HK-2 Cells.Int J Mol Sci. 2022 Mar 27;23(7):3674. doi: 10.3390/ijms23073674. Int J Mol Sci. 2022. PMID: 35409033 Free PMC article.
-
Insights of potential trypanocidal effect of the synthetic derivative (2E)-1-(4-aminophenyl)-3-(2,4-dichlorophenyl)prop-2-en-1-one: in vitro assay, MEV analysis, quantum study, molecular docking, molecular dynamics, MPO analysis, and predictive ADMET.Naunyn Schmiedebergs Arch Pharmacol. 2024 Oct;397(10):7797-7818. doi: 10.1007/s00210-024-03138-z. Epub 2024 May 9. Naunyn Schmiedebergs Arch Pharmacol. 2024. PMID: 38722342
References
-
- Administration FDA. 2001. Aristolochic Acid: Listing of Botanical Ingredients of Concern.[Internet]. [cited 2013 Nov 2013]. Available from: http://www.fda.gov/Food/RecallsOutbreaksEmergencies/SafetyAlertsAdvisori....
Publication types
MeSH terms
Substances
LinkOut - more resources
Full Text Sources
