. 2019 Sep 26;47(17):9104-9114.
doi: 10.1093/nar/gkz636.

Post-transcriptional gene silencing triggers dispensable DNA methylation in gene body in Arabidopsis

Affiliations

Post-transcriptional gene silencing triggers dispensable DNA methylation in gene body in Arabidopsis

Christelle Taochy et al. Nucleic Acids Res. .

Abstract

Spontaneous post-transcriptional silencing of sense transgenes (S-PTGS) is established in each generation and is accompanied by DNA methylation, but the pathway of PTGS-dependent DNA methylation is unknown and so is its role. Here we show that CHH and CHG methylation coincides spatially and temporally with RDR6-dependent products derived from the central and 3' regions of the coding sequence, and requires the components of the RNA-directed DNA methylation (RdDM) pathway NRPE1, DRD1 and DRM2, but not CLSY1, NRPD1, RDR2 or DCL3, suggesting that RDR6-dependent products, namely long dsRNAs and/or siRNAs, trigger PTGS-dependent DNA methylation. Nevertheless, none of these RdDM components are required to establish S-PTGS or produce a systemic silencing signal. Moreover, preventing de novo DNA methylation in non-silenced transgenic tissues grafted onto homologous silenced tissues does not inhibit the triggering of PTGS. Overall, these data indicate that gene body DNA methylation is a consequence, not a cause, of PTGS, and rule out the hypothesis that a PTGS-associated DNA methylation signal is transmitted independent of a PTGS signal.


Figures

Figure 1.
Figure 1.
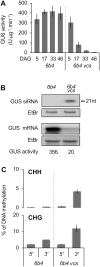
PTGS-induced DNA methylation is established de novo in each generation. (A) Average DNA methylation levels at CG, CHG and CHH sites of the GUS coding sequence in leaves of 8-week-old L1 and L1 rdr6plants grown under short day conditions. The methylation levels correspond to the ratios of methylated cytosines over the total number of cytosines based on WGBS. The screenshots were obtained with the Integrative Genome Browser (IGB). (B) Distribution of GUS siRNAs in L1 and L1 rdr6 plants. The graphic represents the normalized aligned reads per million, and is based on previously published data (10). (C) Close-up of data in (B), except only showing the distribution of siRNAs that were less abundant than 10000 RPM. (D) Time course of DNA methylation in L1 and L1 rdr6plants using representative CHH and CHG methylation-sensitive enzymes in the 5′, central and 3′ regions of the GUS coding sequence. Plants were sown in vitroand the aerial part was harvested 4, 11 or 18 DAG. Analyses were performed at the following sites: HaeIII-49, MspI-126, MspI-813, HaeIII-966, HaeIII-1467, MspI-1529 (see Supplementary Figure S2). The percentage of DNA methylation at each site is based on the difference in qPCR amplification between digested and mock template. Mean and standard deviation bars are based on two biological replicates.
Figure 2.
Figure 2.
The pattern of PTGS-induced DNA methylation is locus-independent. (A) Time course of S-PTGS in plants of the indicated genotypes grown under long day conditions. GUS activity was measured in leaves of 16 plants, and is expressed in fluorescent units per minute per microgram of total proteins. Error bars: standard deviation. (B) GUS siRNA and mRNA accumulation in 17-day-old plants of the indicated genotypes. The ethidium bromide signal is shown as loading control. (C) Percentage of DNA methylation at representative CHH and CHG methylation-sensitive enzymes of the 5′ and 3′ regions of the GUS coding sequence in leaves of 17-day-old plants of the indicated genotypes. Analyses were performed at HaeIII-49, MspI-126, HaeIII-1467 and MspI-1529 (see Supplementary Figure S2). The percentage of DNA methylation was calculated as described in Figure 1D. Mean and standard deviation bars are based on two biological replicates.
Figure 3.
Figure 3.
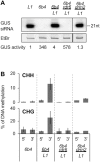
Specific components of the RdDM pathway are required for PTGS-induced DNA methylation but not PTGS establishment. (A) GUS siRNA accumulation and GUS activity in leaves of 8-week-old plants of the indicated genotypes grown under short day conditions. RNA was extracted from a bulk of four plants for small RNA gel blots, and ethidium bromide staining is shown as loading control. Distinct boxes indicate that the samples were separated by tracks that are not relevant for this work. The original blot is presented in Supplementary Figure S3. GUS activity is expressed as fluorescent units per minute per microgram of total proteins quantified by Bradford. Averages and standard deviations correspond to 16 plants. (B) Percentage of DNA methylation at representative CHH and CHG methylation-sensitive enzymes of the 5′ and 3′ region of the GUS coding sequence in leaves of plants of the indicated genotypes grown under short day conditions. Analyses were performed at HaeIII-49, MspI-126, HaeIII-1467 and MspI-1529 (see Supplementary Figure S2). The percentage of DNA methylation was calculated as described in Figure 1D. Mean and standard deviation bars are based on two biological replicates.
Figure 4.
Figure 4.
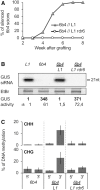
PTGS transmission from L1 rootstocks to 6b4 scions requires siRNA amplification in L1 and triggers PTGS-induced DNA methylation in 6b4. (A) Kinetics of S-PTGS establishment in leaves of 6b4 shoots grafted onto L1 and L1 rdr6 roots and grown under short day conditions. GUS activity was measured in scion leaves every week. The graph represents the average of two independent experiments involving at least eight plants each (see Table 1). S-PTGS transmission efficiency is expressed as the percentage of silenced scions, i.e. scions exhibiting GUS activity <20 fluorescent units per minute per microgram of total proteins, whereas control 6b4 plants exhibits GUS activity ∼350 fluorescent units per minute per microgram of total proteins. (B) GUS activity and GUS siRNA accumulation in scion leaves of plants of the indicated genotypes grown under short day conditions for eight weeks after grafting. GUS activity is expressed as fluorescent units per minute per microgram of total proteins quantified by Bradford. Averages and standard deviations correspond to the number of plants indicated in Table 1. RNA was extracted from a bulk of four plants. Ethidium bromide staining is shown as loading control. (C) Percentage of DNA methylation at representative CHH and CHG sites in the 5′ and 3′ regions of the GUS coding sequence in scion leaves of plants of the indicated genotypes grown under short day conditions for eight weeks after grafting. Analyses were performed at HaeIII-49, MspI-126, HaeIII-1467 and MspI-1529 restriction sites (see Supplementary Figure S2). The percentage of DNA methylation was calculated as described in Figure 1D. Mean and standard deviation bars are based on two biological replicates.
Figure 5.
Figure 5.
PTGS transmission from L1 roots to 6b4 scions and PTGS-induced DNA methylation in 6b4 do not require any RdDM component in L1. (A) GUS siRNA accumulation and GUS activity in scion leaves of plants of the indicated genotypes grown under short day conditions for eight weeks after grafting. RNA was extracted from a bulk of four plants for small RNA gel blots, and ethidium bromide staining is shown as loading control. GUS activity is expressed as fluorescent units per minute per microgram of total proteins quantified by Bradford. Averages and standard deviations correspond to the number of plants indicated in Table 1. (B) Percentage of DNA methylation at representative CHH and CHG sites in the 5′ and 3′ regions of the GUS coding sequence in scion leaves of plants of the indicated genotypes grown under short day conditions for 8 weeks after grafting. Analyses were performed at HaeIII-49, MspI-126, HaeIII-1467 and MspI-1529 restriction sites (see Supplementary Figure S2). The percentage of DNA methylation was calculated as described in Figure 1D. Mean and standard deviation bars are based on two biological replicates.
Figure 6.
Figure 6.
PTGS transmission from L1 rootstocks to 6b4 scions requires RDR6 but not DRM2 in 6b4. (A) GUS activity and GUS siRNA accumulation in scion leaves of plants of the indicated genotypes grown under short day conditions for eight weeks after grafting. GUS activity is expressed as fluorescent units per minute per microgram of total proteins quantified by Bradford. RNA was extracted from a bulk of four plants. Ethidium bromide staining is shown as loading control. Distinct boxes indicate that the samples were separated by tracks that are not relevant for this work. The original blot is presented in Supplementary Figure S4. (B) Percentage of DNA methylation at representative CHH and CHG methylation-sensitive enzymes in the 5′ and 3′ regions of the GUS coding sequence in scion leaves of plants of the indicated genotypes grown under short day conditions for eight weeks after grafting. Analyses were performed at HaeIII-49, MspI-126, HaeIII-1467 and MspI-1529 (see Supplementary Figure S2). The percentage of DNA methylation was calculated as described in Figure 1D. Mean and standard deviation bars are based on two biological replicates.
Figure 7.
Figure 7.
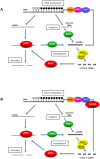
Alternative models for PTGS-induced DNA methylation. S-PTGS is induced owing to the production of transgene aberrant RNAs that escape complete degradation by RQC pathways and are transformed into dsRNAs by RDR6, processed into primary 21–22-nt siRNAs by DCL2/DCL4, methylated by HEN1 and loaded onto AGO1 to guide the cleavage of regular mRNA. The binding of 22-nt siRNAs produced by DCL2 to mRNA may favor the recruitment of RDR6, leading to the production of secondary siRNAs and to amplifying the degradation process. To explain the pattern of DNA methylation in the transgene body, two hypotheses can be evoked: (A) RDR6-derived long dsRNAs directly trigger transgene DNA methylation through Pol V (NRPE1), DRD1 and DRM2, or (B) Part of the PTGS-derived siRNAs are loaded onto AGO4 and/or AGO6 and trigger transgene DNA methylation through Pol V (NRPE1), DRD1 and DRM2.

Similar articles

Cited by

References

    1. Havecker E.R., Wallbridge L.M., Hardcastle T.J., Bush M.S., Kelly K.A., Dunn R.M., Schwach F., Doonan J.H., Baulcombe D.C.. The Arabidopsis RNA-directed DNA methylation argonautes functionally diverge based on their expression and interaction with target loci. Plant Cell. 2010; 22:321–334. - PMC - PubMed
    1. Xie Z., Johansen L.K., Gustafson A.M., Kasschau K.D., Lellis A.D., Zilberman D., Jacobsen S.E., Carrington J.C.. Genetic and functional diversification of small RNA pathways in plants. PLoS Biol. 2004; 2:642–652. - PMC - PubMed
    1. Zhang Z., Liu X., Guo X., Wang X.J., Zhang X.. Arabidopsis AGO3 predominantly recruits 24-nt small RNAs to regulate epigenetic silencing. Nat Plants. 2016; 2:16049. - PubMed
    1. Bologna N.G., Voinnet O.. The diversity, biogenesis, and activities of endogenous silencing small RNAs in Arabidopsis. Annu. Rev. Plant Biol. 2014; 65:473–503. - PubMed
    1. Martinez de Alba A.E., Elvira-Matelot E., Vaucheret H.. Gene silencing in plants: a diversity of pathways. Biochim. Biophys. Acta. 2013; 1829:1300–1308. - PubMed

Publication types

MeSH terms