. 2017 Jul;1(7):0093.
doi: 10.1038/s41551-017-0093. Epub 2017 Jul 11.

Biophysical and biomolecular determination of cellular age in humans

Affiliations

Biophysical and biomolecular determination of cellular age in humans

Jude M Phillip et al. Nat Biomed Eng. 2017 Jul.

Abstract

Ageing research has focused either on assessing organ- and tissue-based changes, such as lung capacity and cardiac function, or on changes at the molecular scale such as gene expression, epigenetic modifications and metabolism. Here, by using a cohort of 32 samples of primary dermal fibroblasts collected from individuals between 2 and 96 years of age, we show that the degradation of functional cellular biophysical features-including cell mechanics, traction strength, morphology and migratory potential-and associated descriptors of cellular heterogeneity predict cellular age with higher accuracy than conventional biomolecular markers. We also demonstrate the use of high-throughput single-cell technologies, together with a deterministic model based on cellular features, to compute the cellular age of apparently healthy males and females, and to explore these relationships in cells from individuals with Werner syndrome and Hutchinson-Gilford progeria syndrome, two rare genetic conditions that result in phenotypes that show aspects of premature ageing. Our findings suggest that the quantification of cellular age may be used to stratify individuals on the basis of cellular phenotypes and serve as a biological proxy of healthspan.


Figures
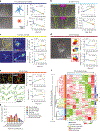
Figure 1 |
Figure 1 |. Changes in cell biophysics: a hallmark of ageing.
a-e, Biophysical assays used in the study and associated trends as a function of age. a, Single-cell motility measures cell movements on two-dimensional substrates as a function of time (n = 2; average of 115 single cells per sample). Left: Traces of cell motility paths for samples from two individuals aged 3 and 92 years old (A03 and A92). Middle: Total path for all the cells in each of these samples. Right: Scatter plots of the directional anisotropy (top) and persistence (time; bottom). All error bars in a-e represent the s.e.m. and the lines denote the best fit. The colour of each plot point indicates the sample to which it corresponds (see top of f, A02 to A92). b, Scratch wound assessment measures the multicellular movements of cells to close a void (or wound; boundaries marked in green) made in a confluent monolayer of cells (n = 2; 10 images per condition). c, Cellular traction strength measures the stresses exerted by individual cells seeded on a deformable polyacrylamide (8 kPa) substrate containing fluorescent bead markers, cell stresses are quantified by the degree of distortion of the underlying fluorescent bead-array (n = 2; 15–25 cells per condition). d, Intracellular microrheology measures the degree of cytoplasmic deformability and the viscoelastic properties of the cell (n = 3; ~3,597 particles across 9 samples). Panels 1, 2, and 3 denote the trajectories of nanoparticles embedded in the cytoplasm. MSD-1s and MSD-10s are the mean squared displacements of the nanoparticles after 1 and 10 s, respectively. e, Cellular and nuclear morphology measurements generated by the delineation of cell and nuclear boundaries on the basis of corresponding fluorescently stained cells (n = 3; 300–700 single cells per in-plate technical replicate; 2 technical replicates per sample, per trial). f, Heat map illustrating how the cellular biophysical features extracted per sample group with age; each column denotes an individual age-dependent sample and each row denotes a single biophysical parameter normalized on the basis of the z score. Using unsupervised hierarchical clustering analysis; the cellular features were clustered and reordered. The dendrogram on the left depicts the higher-order association and natural groupings that exist within the dataset. Colour-coded branches of the dendrogram illustrate eight distinct clusters in the dataset, which are based on the correlation distance among parameters. The heat map key on the left, labelled κ, denotes the colour-coded parameters on the basis of the assays from which the parameters were extracted. The heat map key on the right, labelled ρ, denotes the Pearson correlation coefficients for all measured parameters. g, Correlation analysis data showing the distribution of Pearson correlation coefficients stratified as a function of the correlation magnitude and the biophysical feature set. The red trend line shows the overall frequency of correlation coefficients independent of the specified biophysical feature set, with grey trend lines delineating the correlation distribution for biomolecular features.
Figure 2 |
Figure 2 |. Comprehensive biomolecular assessment of age-dependent cellular phenotypes.
a-e, Biomolecular assays used in the present study and associated trends as a function of age. For all scatter plots (right panels), the error bars represent the s.e.m. and the lines denote the best fit. The colour of each point indicates the sample to which it corresponds (see top of f, A02 to A92; samples from individuals aged 2 to 92). a, Left: Schematic of how luminescence readings are obtained when a probe binds an ATP substrate. Right: Cellular ATP production as a function of age (n = 2; 4 wells per sample). b, Secretion profiles of 23 proteins measured using high-throughput secretome-profiling microchip technology (sample protein blot shown on left), with interleukin 6 being the top age correlate (n = 2; 20,000 cells per well). c, DDR after bleomycin exposure, as measured by the amount, organization and localization of intranuclear γH2AX foci (n = 3; 300–700 individual cells per in-plate technical replicate; 2 technical replicates per sample, per trial; same for DDR (c), nuclear organization (d) and F-actin content (e); representative fluorescence micrographs on left). d, Nuclear organization as measured by texture patterns of DNA and chromatin from Hoechst 33342 staining. e, F-actin content and organization per cell. f, Heat map illustrating all the measured age-dependent biomolecular features; each column denotes an individual and each row denotes a single biomolecular parameter. Each parameter is normalized on the basis of a zscore. Unsupervised hierarchical clustering was used to determine the natural clusters of features in the dataset, with each colour of the dendrogram branches representing a single cluster. Eight clusters were observed on the basis of the correlation distances among parameters. The heat map key on left, labelled κ, denotes the colour-coded parameters on the basis of the biomolecular assays used in the study. The heat map key on the right, labelled ρ, represents the Pearson correlation coefficients for all measured parameters. g, Correlation analysis showing the distribution of Pearson correlation coefficients stratified as a function of correlation magnitude and the biomolecular feature sets. The grey trend line shows the overall frequency of correlation coefficients independent of the specified biomolecular feature set.
Figure 3 |
Figure 3 |. Cellular heterogeneity: a hallmark of ageing.
a,b, Cellular variations as quantified by the c.v. of the biophysical (a) and the biomolecular (b) features. The heat maps illustrate the z score-normalized parameters with corresponding colour-coded dendrograms to illustrate the feature groupings. The heat map key on left, labelled κ, denotes the colour-coded parameters on the basis of the specified features, and the heat map key on the right, labelled ρ, represents the magnitude of the Pearson correlation coefficients with age. c,d, Correlation analysis of heterogeneity features stratified as a function of the correlation magnitude and the feature sets for both biophysical (c) and biomolecular (d) parameters. The plots display trend lines for the correlation distributions of both mean-valued and heterogeneity parameters.
Figure 4 |
Figure 4 |. Univariate and bivariate age-associated parameters provide a reliable prediction of the functional age index of donors on the basis of cellular features.
a, Plot showing correlation coefficients for all 208 parameters (mean and c.v.) stratified on the basis of feature sets for both biomolecular and biophysical parameters. The results indicate that the biophysical parameters constitute the top quadrant of the correlation spectrum, with the top biomolecular correlate (ATP content) ranking 29th overall. b, The heat map on the left denotes the predicted cellular biological age from the training set for the top ten rank-ordered correlates, with 60% being mean-valued parameters and the remaining 40% representing cell-to-cell variations of biophysical features. The heat map on the right confirms the trends on the basis of the data from the validation set. ce, Using a bivariate generalized linear model of cellular features, we compared whether two biophysical features (c) or two biomolecular features (d) or one biophysical and one biomolecular feature (e) were better able to determine the cellular biological age. The top five bivariate combinations of the various feature sets demonstrates that two biophysical features predicts the age with comparable levels of accuracy to one biomolecular and one biophysical feature, with both of these pairs showing higher accuracy versus the two biomolecular features. Scatter plots on the right display the chronological age versus the predicted age for the top pair predictor in each category. The heat map key on the right, labelled ρ denotes the Pearson correlation coefficient, and e denotes the error, with the colour-coded range legends below.
Figure 5 |
Figure 5 |. Cellular biological age prediction on the basis of morphological features.
a, Scatter plot showing the chronological age versus the predicted cellular biological age for 32 donors divided into five categories: training dataset, cross-sectional validation datasets, longitudinal validation dataset, and Werner syndrome and Hutchinson-Gilford progeria syndrome (HGPS) datasets. b, Scatter plot showing the chronological age versus the age differential; age differential is defined as the difference in years between the chronological age (Ac) and the predicted biological age (Abp). The results reveal that samples cluster into three primary groups: expected ageing (AcAbp), accelerated/premature ageing (Ac <Abp) and delayed ageing (Ac >AbP).

Similar articles

Cited by

References

    1. Lopez-Otin C, Blasco MA, Partridge L, Serrano M & Kroemer G The hallmarks of aging. Cell 153, 1194–1217 (2013). - PMC - PubMed
    1. Belsky DW et al. Quantification of biological aging in young adults. Proc. Natl Acad. Sci. USA 112, E4104–E4110 (2015). - PMC - PubMed
    1. Smith BD, Smith GL, Hurria A, Hortobagyi GN & Buchholz TA Future of cancer incidence in the United States: burdens upon an aging, changing nation. J. Clin. Oncol. 27, 2758–2765 (2009). - PubMed
    1. Kennedy BK et al. Geroscience: linking aging to chronic disease. Cell 159, 708–712, (2014). - PMC - PubMed
    1. Bocklandt S et al. Epigenetic predictor of age. PLoS ONE 6, e14821 (2011). - PMC - PubMed

LinkOut - more resources