. 2019 Sep 27;294(39):14203-14214.
doi: 10.1074/jbc.RA119.009824. Epub 2019 Aug 1.

The Hajdu Cheney mutation sensitizes mice to the osteolytic actions of tumor necrosis factor α

Affiliations

The Hajdu Cheney mutation sensitizes mice to the osteolytic actions of tumor necrosis factor α

Jungeun Yu et al. J Biol Chem. .

Abstract

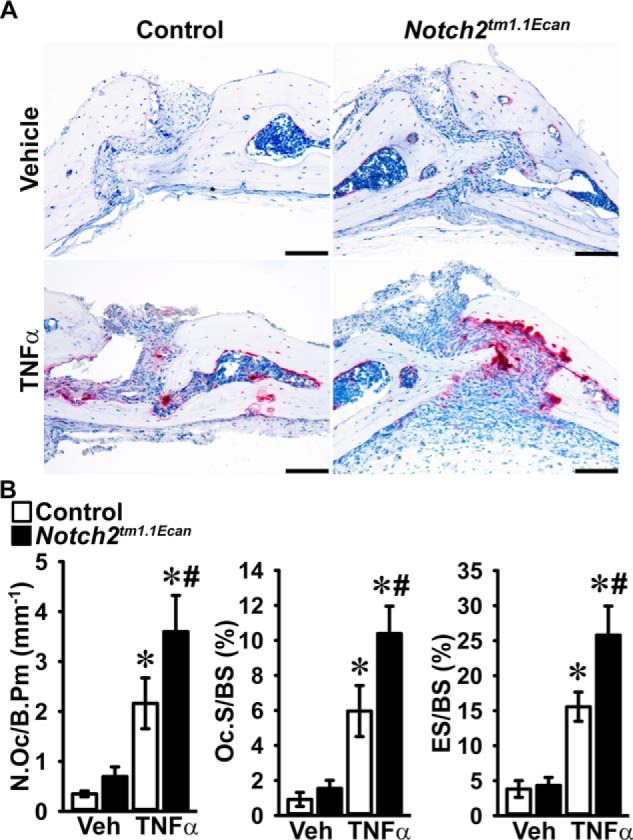
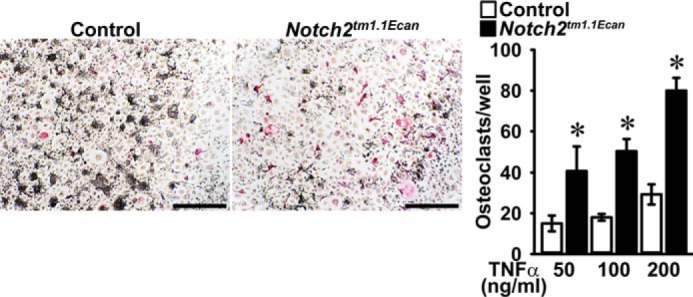
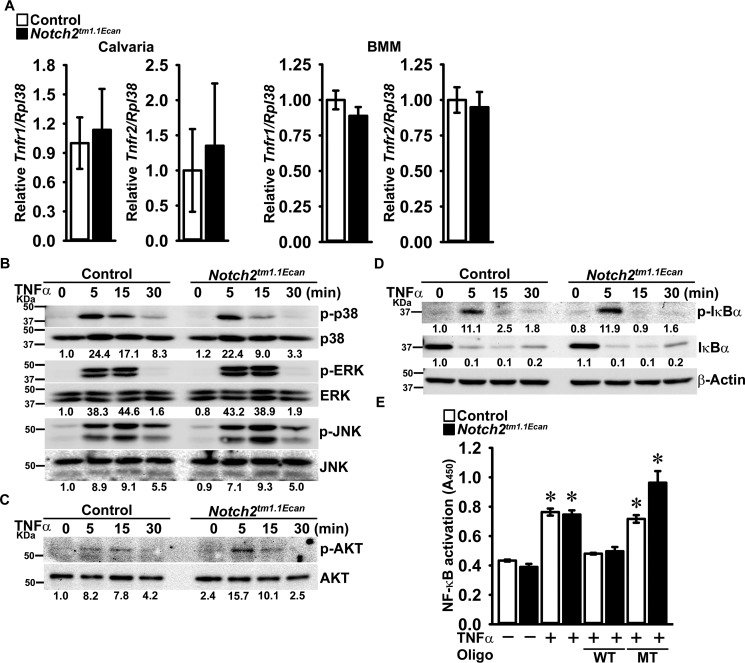
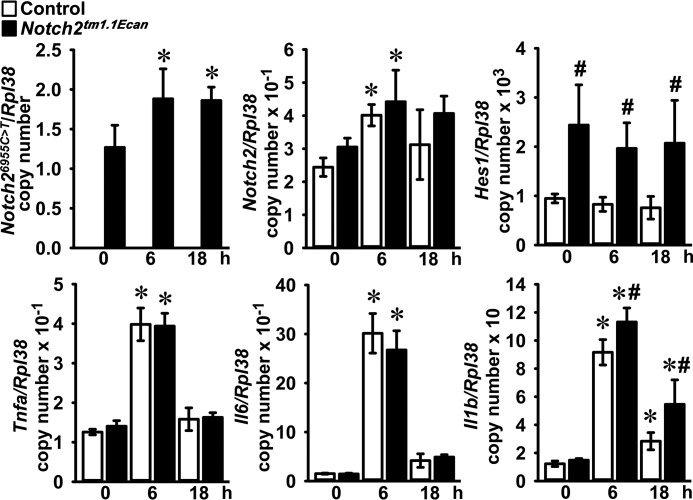
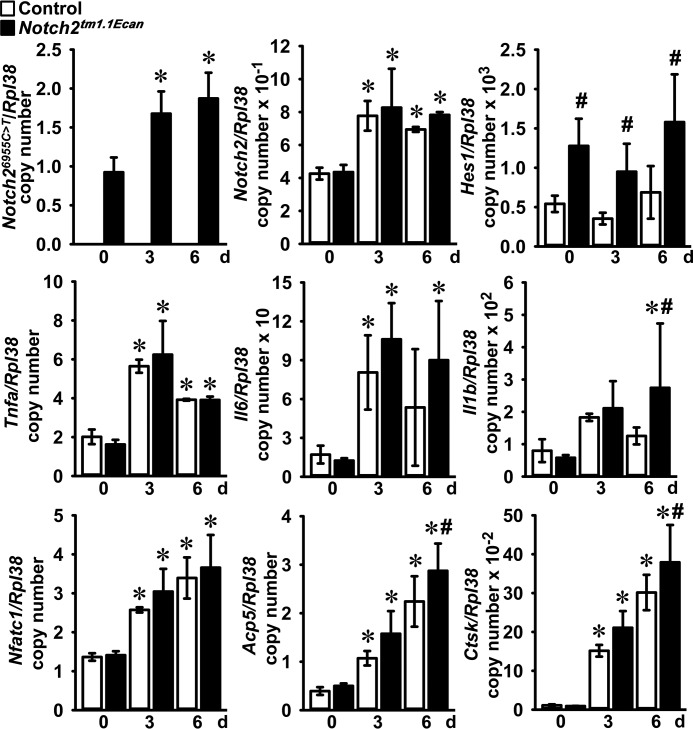
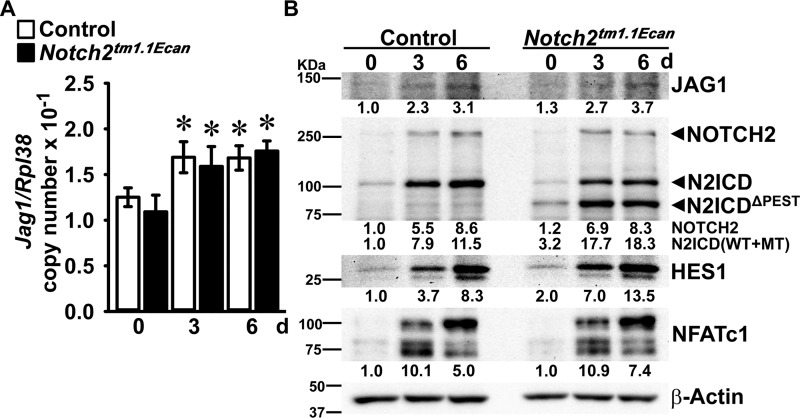
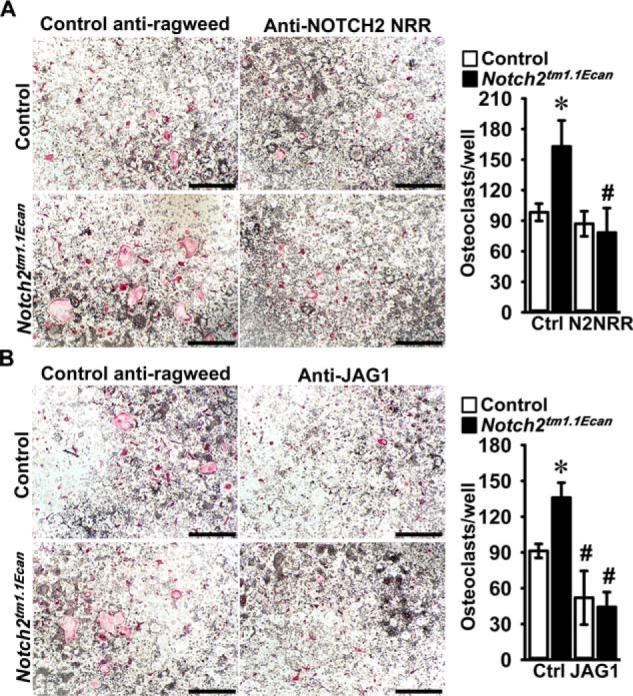
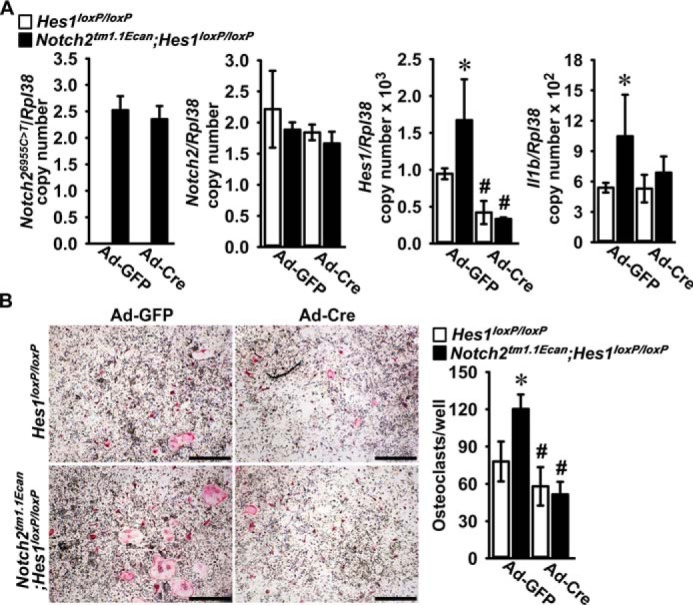
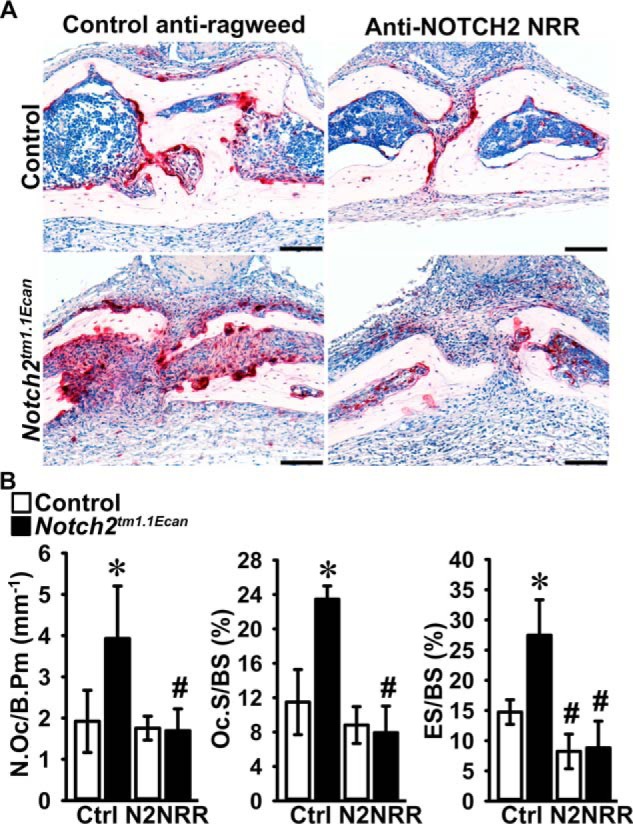
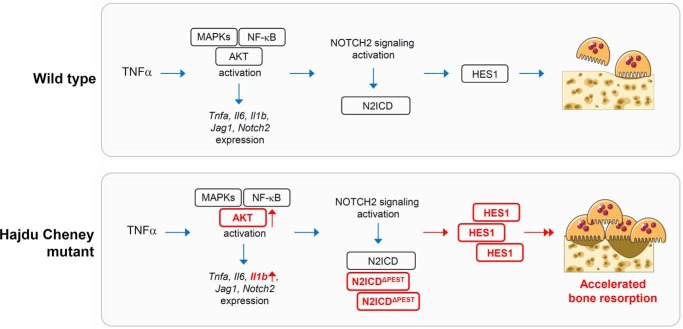
Hajdu Cheney syndrome (HCS) is characterized by craniofacial developmental abnormalities, acro-osteolysis, and osteoporosis and is associated with gain-of-NOTCH2 function mutations. A mouse model of HCS termed Notch2tm1.1Ecan harboring a mutation in exon 34 of Notch2 replicating the one found in HCS was used to determine whether the HCS mutation sensitizes the skeleton to the osteolytic effects of tumor necrosis factor α (TNFα). TNFα injected over the calvarial vault caused a greater increase in osteoclast number, osteoclast surface, and eroded surface in Notch2tm1.1Ecan mice compared with littermate WT controls. Accordingly, the effect of TNFα on osteoclastogenesis was greatly enhanced in cultures of bone marrow-derived macrophages (BMMs) from Notch2tm1.1Ecan mice when compared with the activity of TNFα in control cultures. TNFα induced the expression of Notch2 and Notch2 mutant mRNA by ∼2-fold, possibly amplifying the NOTCH2-dependent induction of osteoclastogenesis. The effect of TNFα on osteoclastogenesis in Notch2tm1.1Ecan mutants depended on NOTCH2 activation because it was reversed by anti-NOTCH2 negative regulatory region and anti-jagged 1 antibodies. The inactivation of Hes1 prevented the TNFα effect on osteoclastogenesis in the context of the Notch2tm1.1Ecan mutation. In addition, the induction of Il1b, but not of Tnfa and Il6, mRNA by TNFα was greater in Notch2tm1.1Ecan BMMs than in control cells, possibly contributing to the actions of TNFα and NOTCH2 on osteoclastogenesis. In conclusion, the HCS mutation enhances TNFα-induced osteoclastogenesis and the inflammatory bone-resorptive response possibly explaining the acro-osteolysis observed in affected individuals.

Keywords: Hajdu Cheney syndrome; Notch receptor; cytokine; inflammation; osteoclast; osteolysis; tumor necrosis factor (TNF).


Conflict of interest statement

The authors declare that they have no conflicts of interest with the contents of this article

Figures

Figure 1.
Figure 1.
Hajdu Cheney mice display greater osteoclast number and eroded surface than littermate controls following TNFα treatment. Calvarial bones of Notch2tm1.1Ecan and sex-matched littermate control mice were administered 2 μg TNFα or PBS (vehicle, Veh) once a day for 4 days over the calvarial vault by subcutaneous injection. A, representative images of histological sections of calvariae stained with TRAP and hematoxylin showing increased number of osteoclasts and eroded surface in TNFα-treated Notch2tm1.1Ecan mice. The scale bars in the right corner represent 100 μm. B, bone histomorphometric analysis of the calvarial bones from Notch2tm1.1Ecan (black bars) mutant mice and littermate controls (white bars). Values are means ± S.D.; vehicle n = 4 and TNFα n = 8 biological replicates for control and Notch2tm1.1Ecan mice, respectively. Parameters shown are as follows: number of osteoclasts/bone perimeter (N.Oc/B.Pm); osteoclast surface/bone surface (Oc.S/BS); eroded surface/bone surface (ES/BS). *, significantly different between TNFα and vehicle, p < 0.05. #, significantly different between Notch2tm1.1Ecan and control, p < 0.05.
Figure 2.
Figure 2.
Hajdu Cheney mutant BMMs are sensitized to the action of TNFα on osteoclastogenesis. BMMs derived from 2-month-old Notch2tm1.1Ecan mice and control littermates were cultured in the presence of M-CSF at 30 ng/ml and of TNFα at 50, 100, and 200 ng/ml for 6 days. Cells were stained with TRAP, and representative images of TRAP-stained multinucleated cells are shown. The scale bar in the right corner represents 500 μm. TRAP-positive cells with more than three nuclei were considered osteoclasts, and values are means ± S.D.; n = 4 biological replicates for control (white bars) and Notch2tm1.1Ecan (black bars) cells. *, significantly different between Notch2tm1.1Ecan and control, p < 0.05.
Figure 3.
Figure 3.
TNFα receptor expression and TNFα-induced early signal activation are not altered in Hajdu Cheney mutants. A, total RNA was extracted from calvarial bones (left) or BMMs (right) of Notch2tm1.1Ecan and sex-matched littermate control mice and examined for relative Tnfr1 and Tnfr2 gene expression by qRT-PCR, corrected for Rpl38 copy number. Values are means ± S.D.; n = 4 biological replicates for control (white bars) and Notch2tm1.1Ecan (black bars) calvarial bones or BMMs. B–D, BMMs derived from 2-month-old Notch2tm1.1Ecan mice and control littermates were cultured for 2 h in the absence of serum and exposed to TNFα at 200 ng/ml for the indicated periods of time, and whole-cell lysates (35 μg of total protein except panel C, 15 μg of total protein for C) were examined by immunoblotting. B, using anti-p-p38, p-ERK, and p-JNK antibodies, stripped and reprobed with anti-p38, ERK, and JNK antibodies. C, using anti-p-AKT antibodies and reprobed with anti-AKT antibodies. D, using anti-p-IκBα or β-Actin antibodies, stripped and reprobed with IκBα antibodies. The band intensity was quantified by ImageLabTM software (version 5.2.1), and the numerical ratios of phosphorylated/unphosphorylated signal in B and C or of p-IκBα/β-Actin and of IκBα/β-Actin in D are shown below each blot. Control ratios at day 0 are normalized to 1. E, BMMs from 2-month-old Notch2tm1.1Ecan mice and control littermates were cultured for 2 h in the absence of serum and exposed to TNFα at 200 ng/ml for 1 h. 20 μg of nuclear extracts for each sample were examined by TransAMTM Flexi NF-κB p65 activation assay kit, and colorimetric changes were measured at 450 nm. Values are means ± S.D.; n = 3 technical replicates for control (white bars) and Notch2tm1.1Ecan (black bars) BMMs. *, significantly different compared with control without TNFα, p < 0.05.
Figure 4.
Figure 4.
TNFα enhances the expression of Notch2 and proinflammatory cytokines in Hajdu Cheney mutant and control BMMs. BMMs derived from 2-month-old Notch2tm1.1Ecan mice and control littermates were cultured for the indicated periods of time in the presence of M-CSF at 30 ng/ml and TNFα at 200 ng/ml. Total RNA was extracted, and gene expression was determined by qRT-PCR. Data are expressed as Notch26955CT, Notch2, Hes1, Tnfa, Il6, and Il1b, corrected for Rpl38 copy number. Values are means ± S.D.; n = 4 biological replicates for control (white bars) and Notch2tm1.1Ecan (black bars) BMMs. *, significantly different compared with time 0, p < 0.05. #, significantly different between Notch2tm1.1Ecan and control, p < 0.05.
Figure 5.
Figure 5.
Expression of Notch2 and proinflammatory cytokines is increased during TNFα-induced osteoclastogenesis. BMMs derived from 2-month-old Notch2tm1.1Ecan mice and control littermates were cultured in the presence of M-CSF at 30 ng/ml and TNFα at 200 ng/ml for 6 days. Total RNA was extracted, and gene expression was determined by qRT-PCR. Data are expressed as Notch26955CT, Notch2, Hes1, Tnfa, Il6, Il1b, Nfatc1, Acp5, and Ctsk, corrected for Rpl38 copy number. Values are means ± S.D.; n = 4 biological replicates for control (white bars) and Notch2tm1.1Ecan (black bars) cells. *, significantly different compared with day 0, p < 0.05. #, significantly different between Notch2tm1.1Ecan and control, p < 0.05.
Figure 6.
Figure 6.
TNFα accelerates NOTCH2 signal activation during osteoclast differentiation and enhances JAG1 expression. BMMs derived from 2-month-old Notch2tm1.1Ecan mice and control littermates were cultured in the presence of M-CSF at 30 ng/ml and of TNFα at 200 ng/ml for 6 days. A, total RNA was extracted, and gene expression was determined by qRT-PCR. Data are expressed as Jag1, corrected for Rpl38 copy number. Values are means ± S.D.; n = 4 biological replicates for control (white bars) and Notch2tm1.1Ecan (black bars) cells. *, significantly different compared with day 0, p < 0.05. B, whole-cell lysates (35 μg of total protein) were examined by immunoblotting using anti-JAG1, NOTCH2 and N2ICD, HES1, NFATc1, and β-Actin antibodies. The band intensity was quantified by ImageLabTM software (version 5.2.1), and the numerical ratio of JAG1/β-Actin, NOTCH2/β-Actin, N2ICD (including N2ICDΔPEST)/β-Actin, HES1/β-Actin, and NFATc1/β-Actin is shown below each blot. All control ratios at day 0 are normalized to 1.
Figure 7.
Figure 7.
Preventing NOTCH2 signal activation reverses the effect of the Hajdu Cheney mutation on TNFα-induced osteoclastogenesis. BMMs derived from 2-month-old Notch2tm1.1Ecan mice and control littermates were cultured with M-CSF at 30 ng/ml and TNFα at 200 ng/ml in the presence of control anti-ragweed at 10 or 20 μg/ml (Ctrl) or anti-NOTCH2 NRR (N2NRR) at 10 μg/ml (A), or anti-JAG1 (JAG1) at 20 μg/ml (B) for 6 days. A and B, representative images of TRAP-stained multinucleated cells obtained after 6 days of culture are shown. The scale bars in the right corners represent 500 μm. TRAP-positive cells with more than three nuclei were considered as osteoclasts, and values are means ± S.D. (top and bottom right); n = 4 biological replicates for control (white bars) and Notch2tm1.1Ecan (black bars). *, significantly different between Notch2tm1.1Ecan and control, p < 0.05. #, significantly different between anti-NOTCH2 NRR or anti-JAG1 and control anti-ragweed antibodies, p < 0.05.
Figure 8.
Figure 8.
Hes1 inactivation reverses the effect of the Hajdu Cheney mutation on TNFα-induced osteoclastogenesis. Osteoclast precursors derived from 2-month-old Notch2tm1.1Ecan;Hes1loxP/loxP and Hes1loxP/loxP littermate controls were transduced with adenoviruses carrying CMV-Cre (Ad-Cre) or GFP (Ad-GFP) as control at m.o.i. 100 and cultured with M-CSF at 30 ng/ml and TNFα at 200 ng/ml for 3 days until the formation of multinucleated TRAP-positive cells. A, total RNA was extracted, and gene expression was determined by qRT-PCR. Data are expressed as Notch26955CT, Notch2, Hes1, and Il1b, corrected for Rpl38 copy number. Values are means ± S.D.; n = 4 technical replicates for Hes1loxP/loxP (white bars) and Notch2tm1.1Ecan;Hes1loxP/loxP (black bars) cells transduced with Ad-Cre or Ad-GFP. B, representative images of TRAP-stained multinucleated cells are shown. The scale bars in the right corner represent 500 μm. TRAP-positive cells with more than three nuclei were considered osteoclasts, and values are means ± S.D.; n = 4 technical replicates for Hes1loxP/loxP (white bars) and Notch2tm1.1Ecan;Hes1loxP/loxP (black bars) transduced with Ad-Cre or Ad-GFP. *, significantly different between Notch2tm1.1Ecan;Hes1loxP/loxP and Hes1loxP/loxP control, p < 0.05. #, significantly different between Ad-Cre and Ad-GFP, p < 0.05.
Figure 9.
Figure 9.
Preventing NOTCH2 signal activation reverses the effect of the Hajdu Cheney mutation on TNFα-induced osteolysis. Calvarial bones from Notch2tm1.1Ecan and sex-matched littermate control mice were administered 2 μg of TNFα with anti-NOTCH2 NRR or control anti-ragweed antibodies at a dose of 10 mg/kg once a day for 4 days over the calvarial vault by subcutaneous injection. A, representative images of histological sections of calvariae stained with TRAP and hematoxylin showing reversal of the TNFα-induced osteolysis in Notch2tm1.1Ecan mice by anti-NOTCH2 NRR antibodies. Scale bars in the right corner represent 100 μm. B, bone histomorphometric analysis of calvarial bones from Notch2tm1.1Ecan (black bars) mutant mice and littermate controls (white bars). Values are means ± S.D.; control anti-ragweed antibody (Ctrl) n = 4–5 and anti-NOTCH2 NRR (N2NRR) n = 5 biological replicates for control and Notch2tm1.1Ecan mice, respectively. Parameters shown are as follows: number of osteoclasts/bone perimeter (N.Oc/B.Pm); osteoclast surface/bone surface (Oc.S/BS); and eroded surface/bone surface (ES/BS). *, significantly different between Notch2tm1.1Ecan and control, p < 0.05. #, significantly different between anti-NOTCH2 NRR and control anti-ragweed antibodies, p < 0.05.
Figure 10.
Figure 10.
Schematic model to show the effects of the Hajdu Cheney mutation on TNFα-induced osteolysis. The blue arrows indicate signal activation. The red arrows and boxes in bold represent increased signal activation and expression in Hajdu Cheney mutants.

Similar articles

Cited by

References

    1. Siebel C., and Lendahl U. (2017) Notch signaling in development, tissue homeostasis, and disease. Physiol. Rev. 97, 1235–1294 10.1152/physrev.00005.2017 - DOI - PubMed
    1. Zanotti S., and Canalis E. (2016) Notch signaling and the skeleton. Endocr. Rev. 37, 223–253 10.1210/er.2016-1002 - DOI - PMC - PubMed
    1. Bai S., Kopan R., Zou W., Hilton M. J., Ong C. T., Long F., Ross F. P., and Teitelbaum S. L. (2008) NOTCH1 regulates osteoclastogenesis directly in osteoclast precursors and indirectly via osteoblast lineage cells. J. Biol. Chem. 283, 6509–6518 10.1074/jbc.M707000200 - DOI - PubMed
    1. Canalis E., Parker K., Feng J. Q., and Zanotti S. (2013) Osteoblast lineage-specific effects of notch activation in the skeleton. Endocrinology 154, 623–634 10.1210/en.2012-1732 - DOI - PMC - PubMed
    1. Canalis E., Schilling L., Yee S. P., Lee S. K., and Zanotti S. (2016) Hajdu Cheney mouse mutants exhibit osteopenia, increased osteoclastogenesis and bone resorption. J. Biol. Chem. 291, 1538–1551 10.1074/jbc.M115.685453 - DOI - PMC - PubMed

Publication types

LinkOut - more resources