Comment
. 2019 Nov 15;79(22):5812-5825.
doi: 10.1158/0008-5472.CAN-19-0698. Epub 2019 Jul 30.

MEK Inhibition Modulates Cytokine Response to Mediate Therapeutic Efficacy in Lung Cancer

Affiliations
Comment

MEK Inhibition Modulates Cytokine Response to Mediate Therapeutic Efficacy in Lung Cancer

Mengyu Xie et al. Cancer Res. .

Abstract

Activating mutations in BRAF, a key mediator of RAS signaling, are present in approximately 50% of melanoma patients. Pharmacologic inhibition of BRAF or the downstream MAP kinase MEK is highly effective in treating BRAF-mutant melanoma. In contrast, RAS pathway inhibitors have been less effective in treating epithelial malignancies, such as lung cancer. Here, we show that treatment of melanoma patients with BRAF and MEK inhibitors (MEKi) activated tumor NF-κB activity. MEKi potentiated the response to TNFα, a potent activator of NF-κB. In both melanoma and lung cancer cells, MEKi increased cell-surface expression of TNFα receptor 1 (TNFR1), which enhanced NF-κB activation and augmented expression of genes regulated by TNFα and IFNγ. Screening of 289 targeted agents for the ability to increase TNFα and IFNγ target gene expression demonstrated that this was a general activity of inhibitors of MEK and ERK kinases. Treatment with MEKi led to acquisition of a novel vulnerability to TNFα and IFNγ-induced apoptosis in lung cancer cells that were refractory to MEKi killing and augmented cell-cycle arrest. Abolishing the expression of TNFR1 on lung cancer cells impaired the antitumor efficacy of MEKi, whereas the administration of TNFα and IFNγ in MEKi-treated mice enhanced the antitumor response. Furthermore, immunotherapeutics known to induce expression of these cytokines synergized with MEKi in eradicating tumors. These findings define a novel cytokine response modulatory function of MEKi that can be therapeutically exploited. SIGNIFICANCE: Lung cancer cells are rendered sensitive to MEK inhibitors by TNFα and IFNγ, providing a strong mechanistic rationale for combining immunotherapeutics, such as checkpoint blockers, with MEK inhibitor therapy for lung cancer.See related commentary by Havel, p. 5699.


Conflict of interest statement

Conflicts of interest: The authors declare no potential conflicts of interest.

Figures
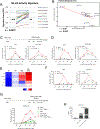
Fig. 1
Fig. 1. MEK inhibitors enhance TNFα induced gene expression.
(A) NF-κB signature activity in paired melanoma patient biopsies at pre-treatment (pre) and under vemurafenib or dabrafenib plus trametinib treatment (on). Individual lines represents each pair of biopsies, anonymized patient ID along with the tumor reduction rate (%). (B) Correlation between individual patient response (% tumor reduction) to treatment and NF-κB signature score in on-treatment biopsies. Red line represents Pearson’s linear correlation. (C-D) Time course expression of TNF and TNFAIP3 mRNA in WM164 and 1205Lu as indicated. Cells were incubated with trametinib (TRA, 10nM) or left unstimulated for 24 hours, with or without 2ng/ml TNFα added for indicated time periods. 0h on the x-axis indicates no treatment (black circle) or TRA alone treatment for 24 hours (red circle). Gene expression was determined in triplicate samples by qPCR and normalized to unstimulated cells. Two-way ANOVA was used to determine significance of difference between single and combined treatments (indicated on top). A post hoc Sidak’s multiple-comparison test for each time point was also performed and is overlaid on the plot at specific time points. *p<0.05, **p<0.01, ***p<0.001. NS: not significant. (E) Microarray expression of select TNFα target genes in A549 subjected to indicated treatments; TRA treatment was 24 hours, TNFα was 2 hours. Expression value is represented using a z-score range of 3 standard deviations from the mean. (F) Time course expression of TNF and TNFAIP3 mRNA in A549 as described in C. (G) Time course expression of CXCL10 in A549, cells were incubated with TRA for 24 hours or left unstimulated, with or without 2ng/ml cytokines (TNFα, IFNγ) added for indicated time period. Two-way ANOVA was used to determine significance of difference with and without presence of TRA in indicated groups. Post hoc Sidak’s multiple-comparison test was performed and is overlaid on the plot for the TNFα + IFNγ and TNFα + IFNγ + TRA group comparison. *p<0.05, **p<0.01, ***p<0.001. NS: not significant. (H) A549 supernatants were collected from A549 cells subjected to indicated treatments, CXCL10 secretion were determined using the Luminex assay. Data represents the mean ± SD. Significances were determined using one-way ANOVA and a post hoc Sidak’s multiple-comparison test. *p<0.05, **p<0.01, ***p<0.001. NS: not significant.
Fig. 2
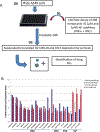
Fig. 2. MEK and ERK inhibitors stimulate TNFα + IFNγ induced chemokine expression.
(A) Outline of drug screening assay used to identify agents that enhance TNFα and IFNγ induced expression of CXCL10 and/or CCL5 2-fold over cytokines alone. TNFα and IFNγ were added to final concentrations of 0.2 ng/ml and 1 ng/ml, respectively. Library compounds were used at 0.1 μM or 1 μM. (B) Agents that enhance TNFα and IFNγ induced expression of CXCL10 and/or CCL5 2-fold over cytokines alone in at least one of the four tested conditions are indicated. Drug target categories are also indicated (see results for details). Arry162 (aka MEK162, binimetinib), a MEKi, induced 1.9-fold increase was also added to show similarity to other MEKi and is indicated with an *. Certain drugs were used in duplicate (LC-161; shown as 1 and 2) to test reproducibility of results.
Fig. 3.
Fig. 3.. MEKi enhance cell surface expression of TNFα receptor 1.
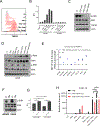
(A) Cell surface TNF receptor 1 (TNFR1) expression in A549 was examined by flow cytometry after 24 hours trametinib (TRA) treatment at 1nM, 10nM and 100nM. US, unstained; UT, untreated. (B) A549 cell surface expression of TNFR1 and TNFR2 was quantified based on median florescence intensity (MFI). (C) Total cell lysates were prepared to perform western blots to detect ERK and TNFR1 in A549 after indicated treatments. (D) Western Blot showing RelA phosphorylation (serine 536; p-RelA) and overall nuclear levels of RelA (p65) in A549 that were subjected to indicated treatments, total incubation time of TRA was 24 hours and cytokines were added in the last 6 hours. Concentrations: TRA 100nM, IFNγ 50ng/ml, TNFα 25ng/ml. ERK and β-actin levels are also shown. (E) Cell surface TNFR1 expression fold change in indicated cell lines upon 24 hours 100nM TRA treatment. Plot represents mean ± SD of 3 replicates. Sidak’s correction for multiple t-test were applied to determine significance of the change in each cell line. (F) Kras-G12D was expressed in NIH-3T3 cells using pBABE-Kras retrovirus. Western blots showing ERK and β-actin in NIH-3T3 cells. (G) Cell surface TNFR1 expression after indicated treatments was determined in NIH-3T3 cells described in F. Plot represents mean ± SD of 3 replicates, Sidak’s multiple-comparison for t-test were applied to determine significance of the changes. ****p<0.0001 (H) TNFR1 expression in A549 was knocked out (TNFR1KO) using CRISPR/Cas9 technology. To re-express TNFR1 in TNFR1KO A549, cells were infected by pLPC-TNFR1 or pLPC retrovirus. CXCL10 mRNA expression was determined by qPCR after indicated treatments, gene expression levels were normalized to unstimulated cells. Concentrations: TRA 100nM, IFNγ 50ng/ml, TNFα 25ng/ml. Data represent the mean ± SD of triplicate values. Two-way ANOVA and a post hoc Tukey’s multiple-comparison test was performed for the TNFα + IFNγ and TNFα + IFNγ + TRA group comparison as indicated. *p<0.05, **p<0.01, ***p<0.001. NS: not significant.
Fig. 4
Fig. 4. TNFα and IFNγ enhance MEKi induced growth suppression and cell death.
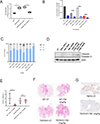
(A) In vitro MEKi sensitivity of A549. TNFR1 was re-expressed in TNFR1KO-A549 using pLPC-TNFR1 retrovirus (TNFR1KO-TNFR1), pLPC used as control (TNFR1KO-pLPC). 104 of A549, TNFR1KO, TNFR1KO-TNFR1 and TNFR1KO-pLPC were seeded into 6 well plates, and incubated with 1nM TRA or left untreated for the next 4 days, viable cell numbers were counted at day 4 for each cell line and normalized to untreated. (B) Impact of TRA and cytokines on A549 growth in vitro. 3 X 10⁴ cells were seeded into 6 well plates and incubated with 10nM TRA with or without 2ng/ml each cytokine (TNFα, IFNγ) for the next 4 days, viable cell numbers were counted on day 4 and normalized to untreated (UT). Plot represents mean ± SD of 3 replicates, significance was determined using one-way ANOVA and a post hoc Tukey’s multiple-comparison test and is shown for indicated comparisons. ****p < 0.0001. (C) Cell cycle analysis of A549 after treatments indicated, cells were collected at day 2 after treatments. Propidium Iodide (PI) staining was used to determine percentage of cells in different cell cycle stages as indicated. Comparisons were made using a chi-squared test with Bonferroni correction. Plot shows representative result from 3 independent experiments, complete results can be found in Table S3. (D) Western blot showing apoptosis marker cleaved caspase 3 expression in A549 after 48 hours of indicated treatment. Cytokines concentration was at 2ng/ml. (E) Trametinib (TRA) effect on growth of lung orthotopic A549 tumors (WT) and TNFR1KO A549 tumors in immunodeficient SCID mice. After 14 days of tumor cell inoculation, 1mg/kg TRA or vehicle was administrated daily through oral gavage for 14 days. UT indicates vehicle treated mice. At the end of treatment, lungs were collected from viable mice for H&E staining. Tumor percentage was quantified based on tumor tissue area compared to total lung area (%). (F) H&E staining of paraffin sections described in E. (G) p-ERK IHC staining in TNFR1KO A549 tumors (untreated and 1mg/kg TRA treated) from E.
Fig. 5
Fig. 5. TNFα and IFNγ synergize with MEKi to induce lung cancer cell death.
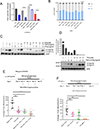
(A) Impact of TRA and cytokines on LKR growth in vitro was determined as in Fig. 4B except treatment was for 2 days. Plot represents mean ± SD of 3 replicates, significance was determined using one-way ANOVA and a post hoc Tukey’s multiple-comparison test and is shown for indicated comparisons. ** p<0.01, *** p<0.001 ****, p < 0.0001 (B) Cell cycle analysis of LKR after treatments indicated was performed as in Fig. 4C. Comparisons were made using a chi-squared test with Bonferroni correction of S versus G1/G2 frequencies. Plot shows representative result from 3 independent experiments, complete results can be found in Table S3. (C) Western blot showing apoptosis marker cleaved caspase 3(CC3) in LKR cells after 48 hours of indicated treatments. (D) Western blot showing cleaved caspase 3(CC3) p19 and p17 fragments in LKR cells in response to indicated cytokine concentrations and trametinib after 48 hours treatments. Viable cell number was also determined and is indicated. (E) Impact of continuous TRA and 3 consecutive intratumoral injections of TNFα/IFNγ on growth of subcutaneous LKR tumors. Experiment scheme is shown, bioluminescence imaging was taken at day 11 and day 14. Total flux of photons of individual mice was calculated and normalized to value at beginning of treatment. Mean ± SD are overlaid as error bars. One-way ANOVA and a post hoc Dunnett’s multiple-comparison test was performed. (F) TRA and anti-PD-1 antibody (αPD-1) effect on growth of subcutaneous LKR tumors in 129/sv mice using the indicated treatment scheme. Plot showing tumor volume change from baseline at the experiment endpoint (14 days of TRA treatment). Tumor volumes were measured and calculated based on length x length x width/2, and normalized to volume at the beginning of treatment (day 0). Change of −100% indicates complete tumor rejection. Significance was determined using One-way ANOVA and a post hoc Dunnett’s multiple-comparison test. *p<0.05, **p<0.01, ***p<0.001, ****p<0.001. ns: not significant.
Fig. 6
Fig. 6. Enhancement of cell cycle arrest and apoptosis by MEKi and cytokine treatment is broadly evident in lung cancer cells.
(A-B) Cell proliferation of human lung cancer cell lines A549, HCC44, H1437, PC-9, H23 (A) and melanoma cell lines 1205Lu, WM164, WM9, WM793 (B) after indicated treatments as in Fig 4B except for only combined presence of TNFα + IFNγ is shown. Cell numbers were counted on day 4 for each cell-line and normalized to untreated cells. (C) Synergy between TRA and cytokines were measured using Bliss score, heatmap showing selected cell lines used in Fig. 6A after indicated treatments. (D) Cell cycle analysis of PC9, HCC44, H23 after treatments indicated, as in Fig. 4C. Comparisons were made using a chi-squared test with Bonferroni correction of S versus G1/G2 frequencies. Plot shows representative result from 3 independent experiments, full results can be found in Table S3. (E) Western blot showing comparison between apoptosis induced by TRA plus cytokines in lung cancer cell lines and TRA induced apoptosis in melanoma cell line WM164. Single treatment with TRA and cytokines in lung cancer lines is indicated in blue rectangles and combined treatment in red rectangles.

Comment in

Comment on

Similar articles

Cited by

References

    1. Fedorenko IV, Paraiso KH, Smalley KS. Acquired and intrinsic BRAF inhibitor resistance in BRAF V600E mutant melanoma. Biochem Pharmacol. 2011;82:201–9. - PMC - PubMed
    1. Zhao Y, Adjei AA. The clinical development of MEK inhibitors. Nature reviews Clinical oncology. 2014;11:385–400. - PubMed
    1. Meador CB, Pao W. Old Habits Die Hard: Addiction of BRAF-Mutant Cancer Cells to MAP Kinase Signaling. Cancer discovery. 2015;5:348–50. - PMC - PubMed
    1. Blumenschein GR Jr., Smit EF, Planchard D, Kim DW, Cadranel J, De Pas T, et al. A randomized phase II study of the MEK1/MEK2 inhibitor trametinib (GSK1120212) compared with docetaxel in KRAS-mutant advanced non-small-cell lung cancer (NSCLC)dagger. Ann Oncol. 2015;26:894–901. - PMC - PubMed
    1. Chen PY, Muzumdar MD, Dorans KJ, Robbins R, Bhutkar A, Del Rosario A, et al. Adaptive and Reversible Resistance to Kras Inhibition in Pancreatic Cancer Cells. Cancer Res. 2018;78:985–1002. - PMC - PubMed

Publication types