. 2019 Nov;4(11):1964-1977.
doi: 10.1038/s41564-019-0509-3. Epub 2019 Jul 29.

DNA mismatch repair is required for the host innate response and controls cellular fate after influenza virus infection

Affiliations

DNA mismatch repair is required for the host innate response and controls cellular fate after influenza virus infection

Benjamin S Chambers et al. Nat Microbiol. 2019 Nov.

Abstract

Despite the cytopathic nature of influenza A virus (IAV) replication, we recently reported that a subset of lung epithelial club cells is able to intrinsically clear the virus and survive infection. However, the mechanisms that drive cell survival during a normally lytic infection remained unclear. Using a loss-of-function screening approach, we discovered that the DNA mismatch repair (MMR) pathway is essential for club cell survival of IAV infection. Repair of virally induced oxidative damage by the DNA MMR pathway not only allowed cell survival of infection, but also facilitated host gene transcription, including the expression of antiviral and stress response genes. Enhanced viral suppression of the DNA MMR pathway prevented club cell survival and increased the severity of viral disease in vivo. Altogether, these results identify previously unappreciated roles for DNA MMR as a central modulator of cellular fate and a contributor to the innate antiviral response, which together control influenza viral disease severity.


Conflict of interest statement

COMPETING INTERESTS

Duke University has filed a provisional patent for targeting DNA MMR as a method to enhance the growth of influenza vaccine strains.

Figures
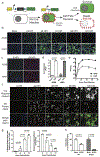
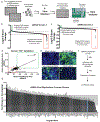
Figure 1.
Figure 1.. NCI-H441 cells survive direct infection with influenza A virus.
(a) Diagram of the ZsGreen-Cre-reporter system used to label cells that survive direct IAV infection. (b) Visualization of ZsGreen-positive survivor cells (green) and nuclei (blue) at indicated time points following infection of A549-CR and H441-CR cells. Representative of two independent experiments. (c) Staining for extracellular viral HA glycoprotein (PY102 antibody, red) and nuclei (DAPI, blue) at 24 hpi. Representative of two independent experiments. (d) Viral RdRP replication assay comparing A549 and H441 cells. Data shown as mean ± SD, n=3 independent samples. Representative of two independent experiments. (e) Titer of infectious virus collected in supernatants of A549 or H441 cells at the indicated time points following WT PR8 infection. Data shown as mean ± SD, n=4 independent samples. Representative of two independent experiments. (f) Time course of WT PR8 infection in H441 cells with viral HA glycoprotein (PY102 antibody, red), ZsGreen-reporter (green), and nuclei (DAPI, blue) over 120 hours. Representative of two independent experiments. (g) Analysis of f showing the number of ZsGreen-positive cells that have cleared viral protein (green+ red-blue+), and the co-localization of green and red signal over time. Data shown as mean ± SD, n=4 independent samples. Representative of two independent experiments. (h) Viability of H441 cells following infection with IAV (WT PR8) or Sindbis virus at 48 hpi, normalized to Mock controls. Data shown as mean ± SD, n=3 independent samples. Representative of two independent experiments. For all panels: p-values calculated using unpaired two-tailed t tests; scale bars = 200 μm.
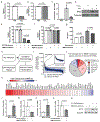
Figure 2.
Figure 2.. An siRNA screen of the druggable genome reveals host factors that control H441 cell survival during IAV infection.
(a) Experimental diagram of the siRNA screen. (b,c) Results of the two independent siRNA screens. The log10 transformation of the Z-scores are plotted for each gene targeted by siRNA and their effect on survival (two siRNA per gene per independent screen). Highlighted are those genes that significantly increase H441 survival (green boxes) when targeted and those that significantly decrease H441 survival (red boxes) when targeted (n=4 independent samples per gene per screen). Average log10 Z-scores for all targeted genes are reported in Supplementary Table 1. (d) Validation of the hits (96 genes) from the high-throughput screen with two additional siRNAs (n=4 independent samples per siRNA). Mock Infected = no Cre present, negative control. NP = siRNA targeting the IAV NP gene, positive control. Boxes label targeted genes that reproducibly increased survival (green) or decreased survival (red). P-values listed in Supplementary Table 2. (e) Representative images of the screen validation controls and MSH6, one of the screen hits. Survivor cells (green) were visualized in H441 monolayers following transfection with the specified siRNA and then infection with IAV-Cre for 120 h. Scale bar = 200 μm. Representative of two independent experiments. (f) Experimental protocol used for the viral replication counter-screen. (g) Results of the viral replication counter-screen. The average luciferase values of both individual siRNAs are plotted. The gray shaded box indicates two standard deviations above and below the control siRNA. All replication values were normalized to the non-targeting siRNA control (blue bar). Data shown as mean ± SEM, n=6 independent samples (3 for each siRNA). A detailed version of this graph is available in Supplementary Fig. 2.
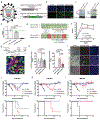
Figure 3.
Figure 3.. DNA MMR genes are important for survival and their expression is maintained in H441 cells during infection.
(a) Visualization of survivor cells (green) and nuclei (blue) in H441-CR cell monolayers following siRNA transfection and infection with IAV-Cre for 120 h. Scale bar represents 200 μm. Representative of two independent experiments. (b) Quantification of survivor cells (normalized to nuclei) in the samples described in a. Data shown as mean ± SD, n=5 independent samples; **p<0.0001. Representative of two independent experiments. (c) Validation of siRNA knockdown of each of the DNA MMR genes from a. Data shown as mean ± SD, n=3 independent samples. Representative of two independent experiments. (d) Heat map displaying the level of RNA expression for each of the DNA MMR genes 9 hpi with WT PR8 in A549 and H441 cells, each normalized to mock-infected cells (averaged across replicates). Inset bar graphs highlight the difference in MSH2 and MSH6 RNA levels between cell types at 9 hpi. Data shown as mean ± SD, n=3 independent samples. Representative of two independent experiments. (e) Western blot comparing MSH2 and MSH6 protein levels at 24 hpi with WT PR8 in A549 and H441 cells. IAV HA = infection control; tubulin = loading control. Representative of two independent experiments. (f) Schematic showing the engineered “mismatch-reporter” NanoLuc plasmid used to determine the level of DNA MMR activity. (g) Validation of the MMR activity assay using A549 cells with or without depletion of MSH2+MSH6. Luciferase was measured following transfection with the WT, mismatch (G-G), or an unrepairable NanoLuc plasmids. Data shown as mean ± SD, n=3 independent samples. Representative of two independent experiments. (h) Comparison of DNA MMR activity in A549 and H441 cells at 24 hpi with WT PR8. Each bar shown is the ratio of mismatch plasmid luciferase/WT plasmid luciferase, normalized to the mock-infected control for each cell type. Data shown as mean ± SD, n=3 independent samples. Representative of two independent experiments. For all panels: p-values calculated using unpaired two-tailed t tests.
Figure 4.
Figure 4.. DNA MMR activity remains high in H441 cells allowing repair of virally-induced ROS-mediated DNA damage.
(a) Representative phospho-H2AX (red) and nuclei (blue) staining of H441 cells to measure the level of DNA damage present during WT PR8 infection. Etoposide and H2O2 are used as positive controls. (b) Quantification of the mean intensity of the phospho-H2AX staining from samples in a. Data shown as mean ± SD, n=3 independent samples. Representative of two independent experiments. (c) Histogram of 8-Oxo-2’-deoxyguanosine (8-OHdG) in H441 cells comparing mock-infected to PR8-infected at 48 hpi. Representative of two independent experiments. (d) Quantification of the geometric mean of fluorescence of the 8-OHdG staining from c. Data shown as mean ± SD, n=6 independent samples. Representative of two independent experiments. (e) Representative images of the modified Comet assay used to compare the level of oxidative DNA damage following siRNA knockdown of control or DNA MMR genes MSH2+MSH6 and mock or WT PR8 infection. Longer tails (indicated by white arrows) correspond to greater DNA damage. (f) Quantification of comet tail lengths (normalized to nuclear diameter) in the samples displayed in e. Data shown as mean ± SD, n=50 nuclei. Representative of two independent experiments. (g) Percent of surviving A549-CR cells after treatment with 0.5 mM Trolox or mock control and infection with IAV-Cre for 120 h. Data shown as mean ± SD, n=8 independent samples. Representative of five experiments. (h) Percent of surviving H441-CR cells after treatment with 0.5 mM Trolox or mock control and infection with IAV-Cre for 120 h. Data shown as mean ± SD, n=6 independent samples. Representative of four experiments. For all panels: p-values calculated using unpaired two-tailed t tests; scale bars = 100 μm.
Figure 5.
Figure 5.. Loss of DNA MMR activity reduces the innate antiviral transcriptional response against influenza A virus.
(a) NanoLuc reporter expression and (b) relative cell viability in H441 cells that have been treated with PBS or H2O2 (for 30 min). Data shown as mean ± SD, n=4 independent samples. (c) Fold change of Mx1 RNA levels in H441 cells following treatment with PBS or IFN-alpha +/− H2O2 treatment (for 30 min). Data shown as mean ± SD, n=4 independent samples. (d) Western blot for Mx1 in H441 cells following the specified treatments. Tubulin = loading control. (e) NanoLuc reporter expression and (f) relative cell viability in H441 cells following the specified treatments. Data shown as mean ± SD, n=4 independent samples. (g) Median fluorescent intensity of the ISRE-GFP reporter in 293T cells following the specified treatments. Data shown as mean ± SD, n=3 independent samples. (h) Model depicting the role of DNA MMR in preserving antiviral gene expression. (i) RNAseq data showing fold change of mRNA levels in H441 cells comparing PR8-infected cells transfected with non-targeting siRNA (black) or MSH2+MSH6 siRNA (blue) to mock-infected cells. Inset is a magnified view of all genes induced >5-fold in PR8-infected cells treated with non-targeting siRNA. (j) Chart grouping all of the genes induced >5-fold in PR8-infected cells based on the effect MMR knockdown has on their mRNA levels. (k) Heat map displaying the effect of MMR knockdown on ISG and antiviral genes from the group of genes displayed in j. (l-o) Fold induction of (l) IFI44L and (n) IFIT1 RNA levels after viral infection as well as the difference in infection-induced (m) IFI44L and (o) IFIT1 RNA levels (48 hpi) after knockdown of control or MMR genes. Data shown as mean ± SD, n=4 independent samples. Data are representative of at least three independent experiments. (p) Western blot of IFIT1 in H441 cells following the specified treatments. Tubulin = loading control. For all panels: p-values calculated using unpaired two-tailed t tests; representative of two independent experiments, unless otherwise indicated.
Figure 6.
Figure 6.. DNA MMR is required for cellular survival and protection from virulence in mice.
(a) Diagram of the engineered IAV PR8 Seg8-Cre + Seg6-amiRNA viruses. (b) PR8-Cre+amiRNA viruses activate Cre-reporter (ZsGreen) expression in H441-CR cells (nuclei, blue). Scale bars = 200 μm. Representative of two independent experiments. (c) Northern blot of total RNA from MLE15 cells infected with the indicated PR8-Cre+amiRNA virus. Probes are specific for the GFP amiRNA, MSH6 amiRNA, or U6 snRNA loading control. Red arrows = precursor-amiRNA; black arrows = mature amiRNA. Representative of two independent experiments. (d) Relative MSH6 RNA levels in MLE15 cells co-transfected with a pLEX plasmid (for puromycin selection) and the indicated Seg6-amiRNA plasmid. Data shown as mean ± SD, n=3 samples. Representative of three independent experiments. (e) Alignment of the antisense MSH6 amiRNA sequence and the MSH6 gene target sequence (both mouse and chicken). Bases are colored green (complementary) or red (non-complementary). (f) Growth curve in fertilized chicken eggs comparing WT PR8 and PR8-Cre+amiRNA viruses. Data shown as mean ± SEM, n=3 samples; *p<0.05, ns=not significant. Representative of two independent experiments. (g) Experimental timeline for differentiation and infection of air-liquid interface (ALI) cultures and validation of differentiation by staining for mature ciliated cells (ACTUB+, green), basal cells (Krt5+, red), and nuclei (blue). Scale bar = 25 μm. Representative of two independent experiments. (h) ALI cultures derived from tdTomato-Cre-reporter transgenic mice were infected with the indicated viruses. Quantification of the number of HA+ (PY102+) cells per field of view at 1 dpi (n=5), and the number of tdTomato+ cells per field of view at 8 dpi (n=10). Data shown as mean ± SD. Representative of two independent experiments. (i) Nuclei staining (DAPI, blue) and survivor cells (tdTomato, red) in ALI cultures at 8 dpi. Scale bars = 50 μm. Representative of two independent experiments. (j-l) Weight loss and survival curves for mice infected with (j) 4000, (k) 1200, or (l) 400 PFU of the indicated virus. Data shown as mean ± SD, n=4 mice per group. Representative of two independent experiments. For all panels: p-values calculated using unpaired two-tailed t tests.

Similar articles

Cited by

References

    1. Downey J, Pernet E, Coulombe F & Divangahi M Dissecting host cell death programs in the pathogenesis of influenza. Microbes Infect, doi:10.1016/j.micinf.2018.03.005 (2018). - DOI - PMC - PubMed
    1. Turpin E et al. Influenza virus infection increases p53 activity: role of p53 in cell death and viral replication. J Virol 79, 8802–8811, doi:10.1128/JVI.79.14.8802-8811.2005 (2005). - DOI - PMC - PubMed
    1. Orzalli MH & Kagan JC Apoptosis and Necroptosis as Host Defense Strategies to Prevent Viral Infection. Trends Cell Biol 27, 800–809, doi:10.1016/j.tcb.2017.05.007 (2017). - DOI - PMC - PubMed
    1. Ehrhardt C et al. Influenza A virus NS1 protein activates the PI3K/Akt pathway to mediate antiapoptotic signaling responses. J Virol 81, 3058–3067, doi:10.1128/JVI.02082-06 (2007). - DOI - PMC - PubMed
    1. Zhirnov OP & Klenk HD Control of apoptosis in influenza virus-infected cells by up-regulation of Akt and p53 signaling. Apoptosis 12, 1419–1432, doi:10.1007/s10495-007-0071-y (2007). - DOI - PubMed

Publication types