Mining of Self-Organizing Map Gene-Expression Portraits Reveals Prognostic Stratification of HPV-Positive Head and Neck Squamous Cell Carcinoma
- PMID: 31357501
- PMCID: PMC6721309
- DOI: 10.3390/cancers11081057
Mining of Self-Organizing Map Gene-Expression Portraits Reveals Prognostic Stratification of HPV-Positive Head and Neck Squamous Cell Carcinoma
Abstract
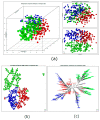
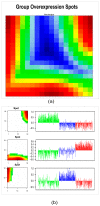
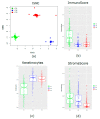
Patients (pts) with head and neck squamous cell carcinoma (HNSCC) have different epidemiologic, clinical, and outcome behaviors in relation to human papillomavirus (HPV) infection status, with HPV-positive patients having a 70% reduction in their risk of death. Little is known about the molecular heterogeneity in HPV-related cases. In the present study, we aim to disclose the molecular subtypes with potential biological and clinical relevance. Through a literature review, 11 studies were retrieved with a total of 346 gene-expression data points from HPV-positive HNSCC pts. Meta-analysis and self-organizing map (SOM) approaches were used to disclose relevant meta-gene portraits. Unsupervised consensus clustering provided evidence of three biological subtypes in HPV-positive HNSCC: Cl1, immune-related; Cl2, epithelial-mesenchymal transition-related; Cl3, proliferation-related. This stratification has a prognostic relevance, with Cl1 having the best outcome, Cl2 the worst, and Cl3 an intermediate survival rate. Compared to recent literature, which identified immune and keratinocyte subtypes in HPV-related HNSCC, we confirmed the former and we separated the latter into two clusters with different biological and prognostic characteristics. At present, this paper reports the largest meta-analysis of HPV-positive HNSCC studies and offers a promising molecular subtype classification. Upon further validation, this stratification could improve patient selection and pave the way for the development of a precision medicine therapeutic approach.
Keywords: HP; head and neck cancer; molecular subtypes; self-organizing map; treatment de-escalation; tumor microenvironment.
Conflict of interest statement
The authors declare no conflicts of interest. The funders had no role in the design of the study; in the collection, analyses, or interpretation of data; in the writing of the manuscript, and in the decision to publish the results.
Figures


Similar articles
-
A 13-gene expression-based radioresistance score highlights the heterogeneity in the response to radiation therapy across HPV-negative HNSCC molecular subtypes.BMC Med. 2017 Sep 1;15(1):165. doi: 10.1186/s12916-017-0929-y. BMC Med. 2017. PMID: 28859688 Free PMC article.
-
Quantitative diffusion magnetic resonance imaging for prediction of human papillomavirus status in head and neck squamous-cell carcinoma: A systematic review and meta-analysis.Neuroradiol J. 2019 Aug;32(4):232-240. doi: 10.1177/1971400919849808. Epub 2019 May 14. Neuroradiol J. 2019. PMID: 31084347 Free PMC article.
-
Immunological Network in Head and Neck Squamous Cell Carcinoma-A Prognostic Tool Beyond HPV Status.Front Oncol. 2020 Sep 15;10:1701. doi: 10.3389/fonc.2020.01701. eCollection 2020. Front Oncol. 2020. PMID: 33042814 Free PMC article. Review.
-
Integrative analysis of head and neck cancer identifies two biologically distinct HPV and three non-HPV subtypes.Clin Cancer Res. 2015 Feb 15;21(4):870-81. doi: 10.1158/1078-0432.CCR-14-2481. Epub 2014 Dec 9. Clin Cancer Res. 2015. PMID: 25492084
-
Heterogeneity of the Head and Neck Squamous Cell Carcinoma Immune Landscape and Its Impact on Immunotherapy.Front Cell Dev Biol. 2019 Apr 9;7:52. doi: 10.3389/fcell.2019.00052. eCollection 2019. Front Cell Dev Biol. 2019. PMID: 31024913 Free PMC article. Review.
Cited by
-
Applications of Bioinformatics in Cancer.Cancers (Basel). 2019 Oct 24;11(11):1630. doi: 10.3390/cancers11111630. Cancers (Basel). 2019. PMID: 31652939 Free PMC article.
-
Evolution-Informed Strategies for Combating Drug Resistance in Cancer.Int J Mol Sci. 2023 Apr 4;24(7):6738. doi: 10.3390/ijms24076738. Int J Mol Sci. 2023. PMID: 37047714 Free PMC article. Review.
-
Evaluating the Radiation Sensitivity Index and 12-chemokine gene expression signature for clinical use in a CLIA laboratory.bioRxiv [Preprint]. 2024 Sep 22:2024.09.19.613957. doi: 10.1101/2024.09.19.613957. bioRxiv. 2024. PMID: 39345465 Free PMC article. Preprint.
-
Development of a multiomics database for personalized prognostic forecasting in head and neck cancer: The Big Data to Decide EU Project.Head Neck. 2021 Feb;43(2):601-612. doi: 10.1002/hed.26515. Epub 2020 Oct 27. Head Neck. 2021. PMID: 33107152 Free PMC article.
-
Visualization and Semantic Labeling of Mood States Based on Time-Series Features of Eye Gaze and Facial Expressions by Unsupervised Learning.Healthcare (Basel). 2022 Aug 8;10(8):1493. doi: 10.3390/healthcare10081493. Healthcare (Basel). 2022. PMID: 36011150 Free PMC article.
References
-
- Fitzmaurice C., Allen C., Barber R.M., Barregard L., Bhutta Z.A., Brenner H., Dicker D.J., Chimed-Orchir O., Dandona R., Dandona L., et al. Global, regional, and national cancer incidence, mortality, years of life lost, years lived with disability, and disability-adjusted life-years for 32 cancer groups, 1990 to 2015: A systematic analysis for the global burden of disease study. JAMA Oncol. 2017;3:524–548. - PMC - PubMed
LinkOut - more resources
Full Text Sources
Research Materials
Miscellaneous

