. 2019 Sep 19;75(6):1243-1255.e7.
doi: 10.1016/j.molcel.2019.06.019. Epub 2019 Jul 25.

Structural Basis for Target-Directed MicroRNA Degradation

Affiliations

Structural Basis for Target-Directed MicroRNA Degradation

Jessica Sheu-Gruttadauria et al. Mol Cell. .

Abstract

MicroRNAs (miRNAs) broadly regulate gene expression through association with Argonaute (Ago), which also protects miRNAs from degradation. However, miRNA stability is known to vary and is regulated by poorly understood mechanisms. A major emerging process, termed target-directed miRNA degradation (TDMD), employs specialized target RNAs to selectively bind to miRNAs and induce their decay. Here, we report structures of human Ago2 (hAgo2) bound to miRNAs and TDMD-inducing targets. miRNA and target form a bipartite duplex with an unpaired flexible linker. hAgo2 cannot physically accommodate the RNA, causing the duplex to bend at the linker and display the miRNA 3' end for enzymatic attack. Altering 3' end display by changing linker flexibility, changing 3' end complementarity, or mutationally inducing 3' end release impacts TDMD efficiency, leading to production of distinct 3'-miRNA isoforms in cells. Our results uncover the mechanism driving TDMD and reveal 3' end display as a key determinant regulating miRNA activity via 3' remodeling and/or degradation.

Keywords: Argonaute; HSUR1; TDMD; miRNA; miRNA-degradation; microRNA; tailing; trimming.


Conflict of interest statement

DECLARATION OF INTERESTS

Authors declare no competing interests.

Figures
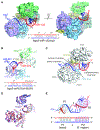
Figure 1.
Figure 1.. The TDMD conformation of hAgo2.
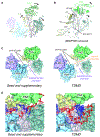
(A) 3.4 Å structure of hAgo2 (surface representation) bound to miRNA-122 (red) and a target RNA with extensive complementarity (bu2, blue). hAgo2 domains are labeled. Asterisk indicates location of the 3′ binding pocket in the PAZ domain. Below is miR-122–bu2 duplex schematic. (B) 2.5 Å structure of hAgo2 (cartoon representation) bound to miR-27a (red) and the HSUR1 target region (blue). miR-27a-HSUR1 duplex schematic is shown below, with disordered nucleotides indicated. (C) Surface representation of TDMD conformation highlighting open central cleft. Seed, central, and supplementary chambers are labeled. The open central gate formed by L2 and PIWI loops is shown. (D) Superposition of all hAgo2–miRNA–TDMD target structures (7 structures, including all unique copies in the asymmetric units of the 4 obtained crystal forms) demonstrating a common overall conformation. (E) The miR-122–bu2 duplex (schematic shown below with miRNA sequence in red, and TDMD target sequence in blue) composed of P1 and P2 connected through kinked region J.
Figure 2.
Figure 2.. A structural model for extended miRNA-target pairing.
(A) Inter-Cα distances between L1 (gray-purple), L2 (mustard), PAZ (green), and N (teal) domains in seed plus supplementary and TDMD conformations, aligned to the MID/PIWI lobe, shown as colored lines. Cartoons of the seed and supplementary conformations are shown for reference. Directions of movements are indicated with arrows. (B) Seed plus supplementary (gray) and TDMD (domain colored) conformations aligned to the MID/PIWI lobe, with the MID/PIWI lobe removed for clarity. Structural elements involved in the hinges are labeled. Movements of the PAZ and N domains are indicated with arrows. (C) Surface representation of the seed and supplementary (left) and TDMD (right) conformations, with RNA removed for clarity to show shape of the central cleft. The central gate is highlighted to show opening and creation of the central chamber. The widened supplementary chamber is indicated. (D) Supplementary chambers of the seed and supplementary (left) and TDMD (right) conformations. RNA base-pairs are labeled and non-paired miRNA nucleotides indicated.
Figure 3.
Figure 3.. TDMD targets facilitate stable display of the miRNA 3′ end.
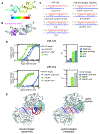
(A) Temperature factors (rainbow colors) indicate that P1 is the most stable region of the RNA duplex. (B) The miR-122–bu2 duplex, with atoms that directly contact hAgo2 (purple). (C) Schematics of miRNA–target sequences used in binding and dissociation assays. (D) TDMD targets bind hAgo2 with significantly higher affinity and longer half-lives than seed-only or seed plus supplementary target RNAs. Shown for miR-122 (top) and miR-27a (bottom). Equilibrium binding data (left) and half-lives of ternary complex (right) are shown. Averages with standard errors are shown, n=3. Equilibrium binding data were normalized to Bmax for each curve for clarity. (E) Comparison of the observed miRNA–TDMD target duplex (left) and an ideal RNA duplex (right) shows how kinked region J prevents steric clashes with Ago2 in the TDMD conformation.
Figure 4.
Figure 4.. Functional validation of the TDMD structural model.
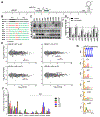
(A) An open HSUR1 structure showing the predicted miR-27a interactions. Sm – the Sm protein binding site, bolded nts – miRNA seed sequence, green nts – HSUR1 nts complementary to miRNA, red – mismatched nts, blue – non-canonical base-pairs. (B) Sequences of WT HSUR1 and its mutants; nts 41 to 60-66 are depicted 3′-5′ to show complementarity to miR-27a; EV – empty vector, purple X = AAAAA, ↓ - predicted Ago2-cleavage site. Boxed is miRNA position 19, which differs between miR-27a and miR-27b. Colors as in (A). (C) Northern blot showing the impact of HSUR1 mutations on endogenous miR-27 (probe detects both miR-27a and miR-27b) and miR-20 levels in BJAB cells stably expressing the indicated mutants. The sizes of miR-27 isomiRs are indicated by arrows. H1 – HSUR1. (D) Quantification of (C). The levels of mature miR-27 (the 20-nt long band) and its isomiRs (bands between 18 and 24 nts) were normalized to the geometric mean of miR-20 and miR-16, and are reported relative to the empty vector control (error bars, s.d.; n=6). (E) The impact of HSUR1 construct expression on total miRNA levels in BJAB cells analyzed by high-throughput sequencing. Shown are log2 fold changes in miRNA means as a function of expression (n=3). miR-27a and miR-27a* are indicated in red, while miR-27b and miR-27b*, in blue. CPM – counts per million. (F) Frequency of various nt additions to miR-27a in the presence of indicated HSUR1 mutants (n=3). (G) Identity and frequency of nt additions to miR-27a HSUR1 mutants.
Figure 5.
Figure 5.. miR-27a isomiRs are associated with all four Ago proteins and with HSUR1 mutants.
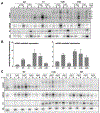
(A) Northern blot showing anti-pan Ago or anti-Sm (recognizes the HSUR1 RNP) immunoprecipitates from extracts of BJAB cells stably expressing HSUR1 mutants (see Fig.4B). I – input, 2%; S – supernatant, 2%; P – pellet (50% for Ago and 100% for Sm), H1 – HSUR1, n=3. (B) miR-27 activity in BJAB cells stably expressing HSUR1 mutants was measured using a Renilla luciferase reporter with either four perfectly complementary miR-27a binding sites (left) or four miR-27a binding sites cloned from the SEMA7A gene (right) in its 3′ UTR. The levels of Renilla luminescence are reported relative to the empty vector (EV) control (error bars, s.d.; n≥3). (C) Northern blot showing anti-FLAG co-immunoprecipitation of RNAs with FLAG-HA-tagged Ago variants (1 to 4) stably expressed in BJAB cells that were concomitantly transduced with either EV or HSUR1 (WT or m30). I – input, 10%; P – pellet, 100%, n=3.
Figure 6.
Figure 6.. The Ago2 F294A PAZ domain mutant mimics TDMD-induced mature miRNA tailing and trimming.
(A) Structure of the hAgo2-miRNA complex (PDB ID: 4w5n) showing how F294 interacts with the miRNA 3′ end. (B) Northern blot showing anti-FLAG immunoprecipitates of FLAG-HA-tagged Ago2 variants (WT or F294A) stably expressed in BJAB cells concomitantly transduced with empty vector (EV) or WT HSUR1. I – input, 10%; S – supernatant, 10%; P – pellet, 100%, H1 – HSUR1. (C) Quantification of (B) in cells transduced with EV. Levels of mature, tailed, and trimmed miRNAs are presented as fraction of total miRNA levels in the pellets (error bars, s.d.; n=3). (D) miRNA modifications occur on mature miRNAs. 32P-radiolabeled miR-27a duplexes were transfected into BJAB cells expressing either empty vector (EV_2) or Ago2 variants (WT or F294A); 24 h later, anti-FLAG immunoprecipitation was performed, n=3.

Similar articles

Cited by

References

    1. Adams PD, Afonine PV, Bunkoczi G, Chen VB, Davis IW, Echols N, Headd JJ, Hung LW, Kapral GJ, Grosse-Kunstleve RW, et al. (2010). PHENIX: a comprehensive Python-based system for macromolecular structure solution. Acta crystallographica Section D, Biological crystallography 66, 213–221. - PMC - PubMed
    1. Ameres SL, Horwich MD, Hung JH, Xu J, Ghildiyal M, Weng Z, and Zamore PD (2010). Target RNA-directed trimming and tailing of small silencing RNAs. Science 328, 1534–1539. - PMC - PubMed
    1. Ameres SL, Hung JH, Xu J, Weng Z, and Zamore PD (2011). Target RNA-directed tailing and trimming purifies the sorting of endo-siRNAs between the two Drosophila Argonaute proteins. RNA 17, 54–63. - PMC - PubMed
    1. Baccarini A, Chauhan H, Gardner TJ, Jayaprakash AD, Sachidanandam R, and Brown BD (2011). Kinetic analysis reveals the fate of a microRNA following target regulation in mammalian cells. Current biology : CB 21, 369–376. - PMC - PubMed
    1. Bartel DP (2018). Metazoan MicroRNAs. Cell 173, 20–51. - PMC - PubMed

Publication types

LinkOut - more resources