. 2019 Nov 21;101(5):986-1000.
doi: 10.1093/biolre/ioz137.

Synergistic inhibition of csal1 and csal3 in granulosa cell proliferation and steroidogenesis of hen ovarian prehierarchical development†

Affiliations

Synergistic inhibition of csal1 and csal3 in granulosa cell proliferation and steroidogenesis of hen ovarian prehierarchical development†

Hongyan Zhu et al. Biol Reprod. .

Abstract

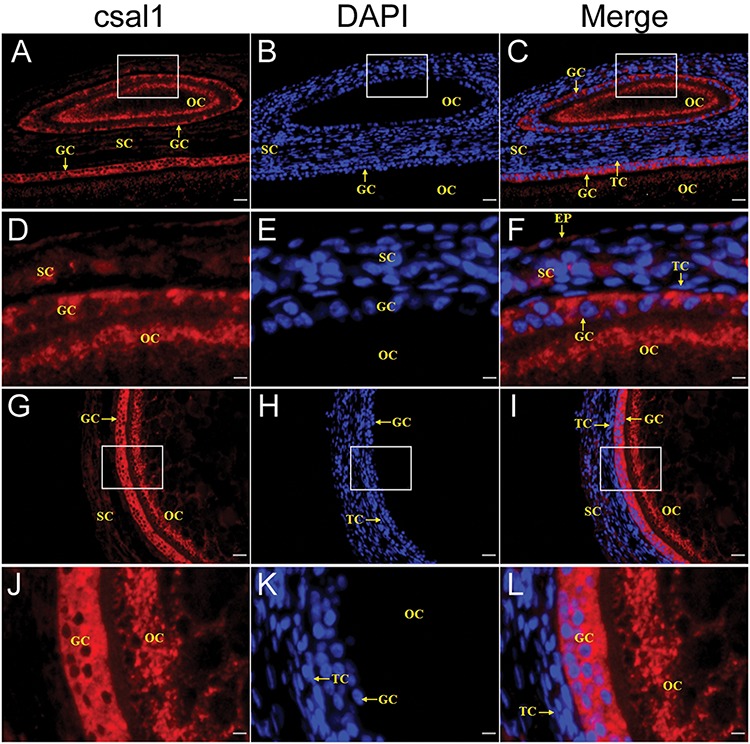
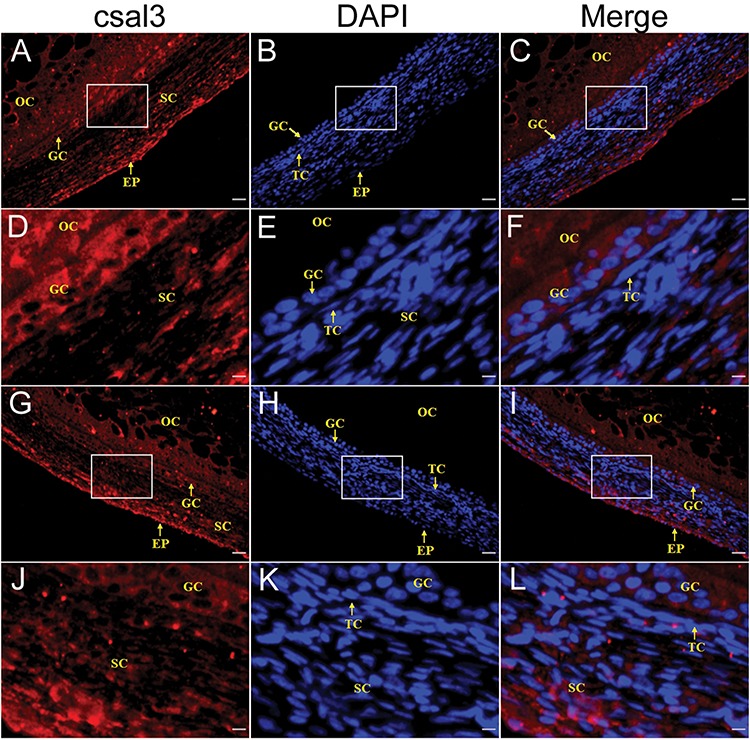
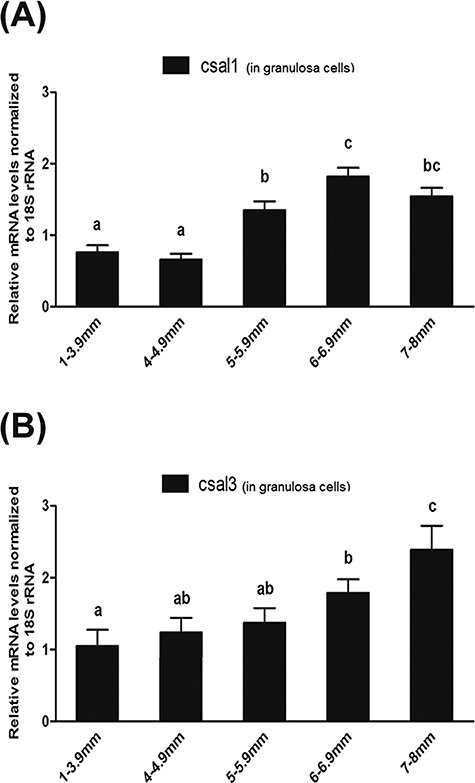
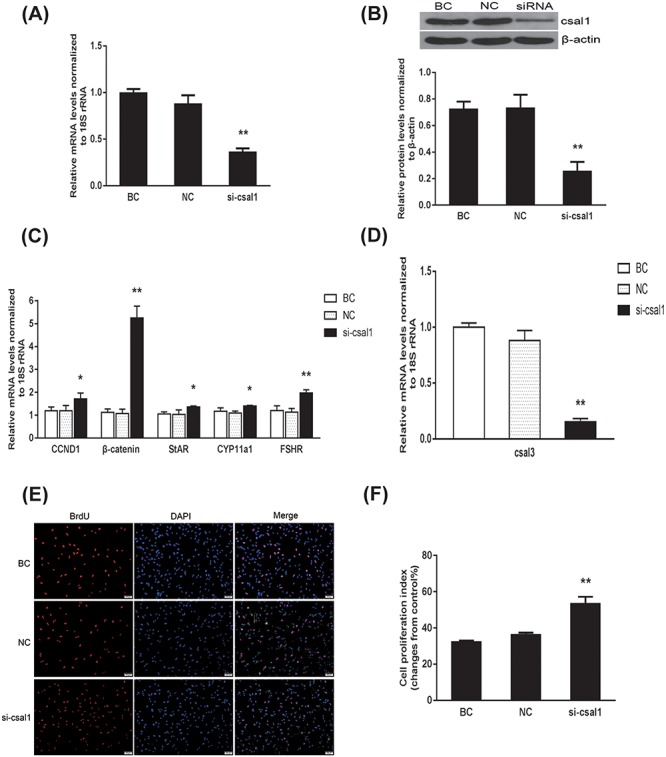
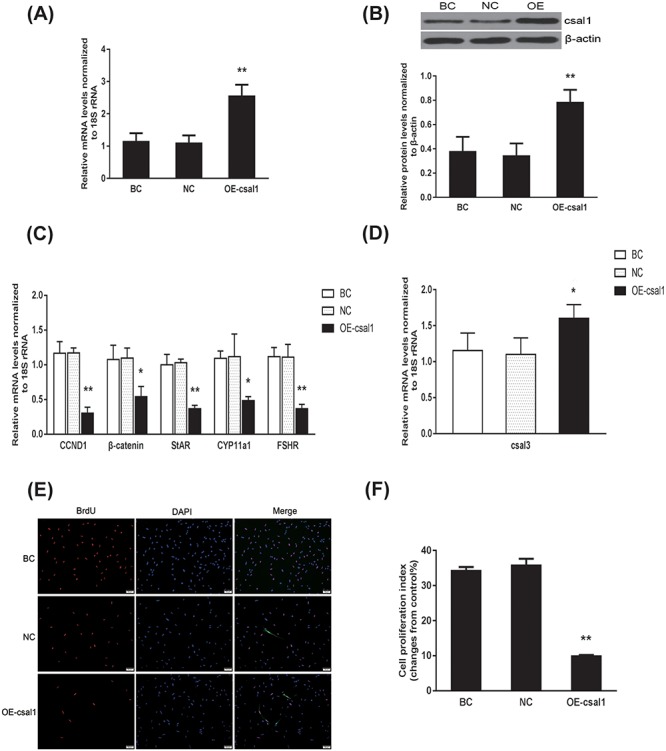
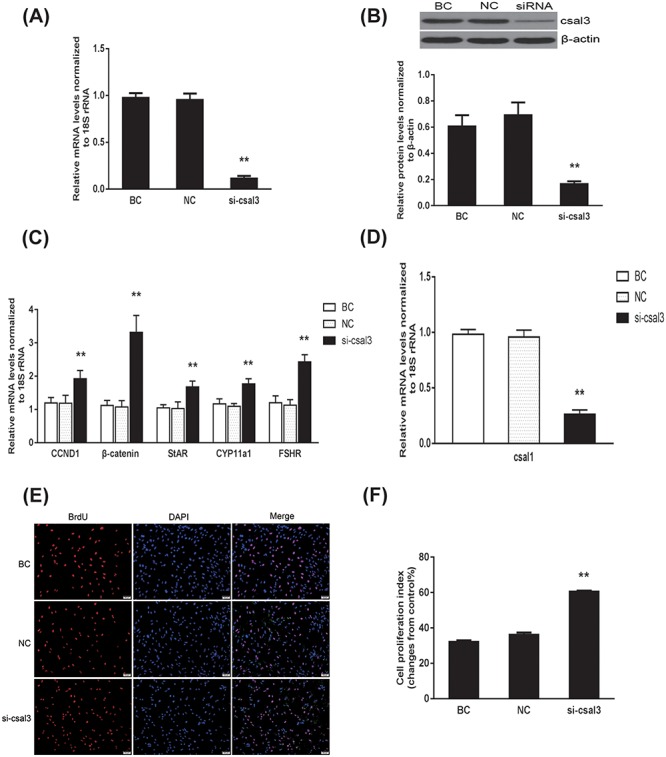
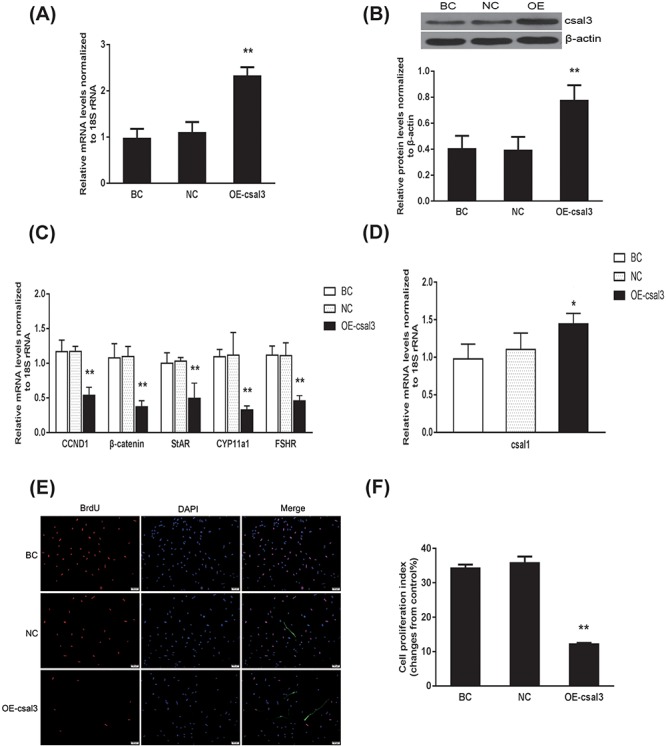
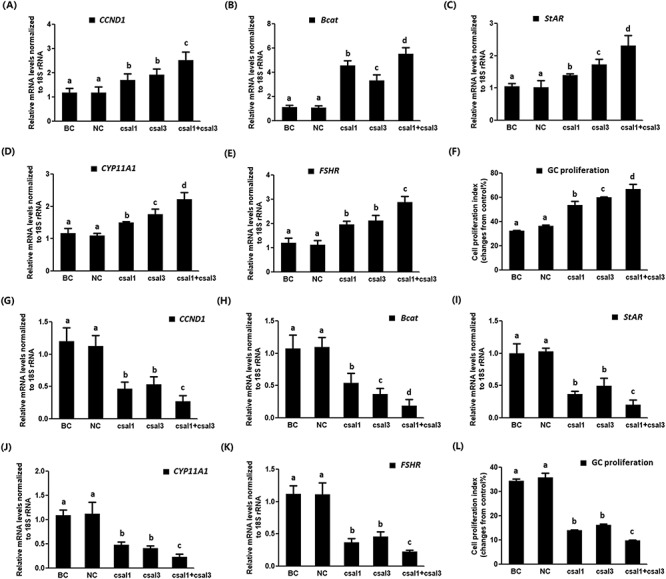
SALL1 and SALL3 are transcription factors that play an essential role in regulating developmental processes and organogenesis in many species. However, the functional role of SALL1 and SALL3 in chicken prehierarchical follicle development is unknown. This study aimed to explore the potential role and mechanism of csal1 and csal3 in granulosa cell proliferation, differentiation, and follicle selection within the prehierarchical follicles of hen ovary. Our data demonstrated that the csal1 and csal3 transcriptions were highly expressed in granulosa cells of prehierarchical follicles, and their proteins were mainly localized in the cytoplasm of granulosa cells and oocytes as well as in the ovarian stroma and epithelium. It initially revealed that both csal1 and csal3 may be involved in chicken prehierarchical follicle development via a translocation mechanism. Furthermore, our results showed an abundance of CCND1, Bcat, StAR, CYP11A1, and FSHR mRNA in granulosa cells, and the proliferation levels of granulosa cells from the prehierarchical follicles were significantly increased by siRNA-mediated knockdown of csal1 or/and csal3. Conversely, the overexpression of csal1 or/and csal3 in the granulosa cells led to a remarkably decreased of them. Moreover, csal1 and csal3 together exert a much stronger effect on the regulation than any of csal1 or csal3. These results indicated that csal1 and csal3 play synergistic inhibitory roles on granulosa cell proliferation, differentiation, and steroidogenesis during prehierarchical follicle development in vitro. The current data provide a basis of molecular mechanisms of csal1 and csal3 in controlling the prehierarchical follicle development and growth of hen ovary in vivo.

Keywords: csal1; csal3; differentiation; follicle selection; proliferation; synergistic inhibition.


Figures

Figure 1
Figure 1
Immunofluorescence localization of csal1 in the prehierarchichal follicles of the chicken ovary. Paraformaldehyde-fixed tissue sections were probed with anti-chicken csal1. The positive csal1 signal was detected as red staining. Intense immunofluorescence staining was detected in the GCs, oocytes, and in the ovarian stroma and epithelium in the various-sized prehierarchichal follicles (A, D, G, and J). Blue staining represents artificial coloring of the nuclei with DAPI staining (B, E, H, and K). Scale bars, 20 μm (A, B, C, G, H, and I); 5 μm (D, E, F, J, K, and L). (A)–(F) were from the PF of 1–3.9 mm in diameter and (G)–(L) were from the PF of 6–6.9 mm in diameter. Oocyte (OC), GC, theca cell (TC), somatic cells (SCs), and epithelium (EP) are indicated in the images.
Figure 2
Figure 2
Immunofluorescence localization of csal3 in the prehierarchichal follicles of the chicken ovary. Paraformaldehyde-fixed tissue sections were probed with anti-chicken csal3. The positive csal3 signal was detected as red staining. Intense immunofluorescence staining was detected in the GCs, oocytes, and in the ovarian stroma and epithelium in the various-sized prehierarchichal follicles (A, D, G, and J). Blue staining represents artificial coloring of the nuclei with DAPI staining (B, E, H, and K). Scale bars, 20 μm (A, B, C, G, H, and I); 5 μm (D, E, F, J, K, and L). (A)–(F) were from the PF of 1–3.9 mm in diameter, (G)–(L) were from the PF of 5–5.9 mm in diameter. Oocyte (OC), GC, theca cell (TC), somatic cells (SC), and epithelium (EP) are indicated.
Figure 3
Figure 3
Expression of csal1 and csal3 genes in GCs of the PF. The expression of csal1 (A) and csal3 (B) was analyzed using RT-qPCR, and values were normalized to the 18S rRNA. The bar graphs show the mean ± SD. Data labeled with different letters are significantly different from each other (P < 0.05).
Figure 4
Figure 4
Effects of silencing csal1 on the expression of CCND1, Bcat, StAR, CYP11A1, and FSHR mRNA and granulosa cell proliferation. GCs from the PFs (6–8 mm in diameter) were transfected with specific siRNA targeting csal1 gene, scrambled siRNA (NC, negative control), and no siRNA (BC, blank control). (A) The expression of csal1 gene before and after the GCs transfected with specific siRNA was analyzed using RT-qPCR. (B) Expression levels of csal1 protein in the GCs before and after the specific siRNA interference (RNAi) were detected by western blotting. The β-actin was used as the loading control. (C) The influence of silencing csal1 on CCND1, Bcat, StAR, CYP11A1, and FSHR mRNA abundances in the GCs was determined. (D) The influence of silencing csal1 on csal3 mRNA abundances in the GCs was examined. (E) Chicken GCs were transfected with csal1-specific siRNA, scrambled siRNA (NC, negative control), and absence of any siRNA (BC, blank control). The effects of csal1 knockdown on the GC proliferation were detected by BrdU assay. All cell nuclei show blue fluorescence indicative of DAPI staining; the BrdU-labeled cells showed red fluorescence indicating their newly synthesized DNA (×200). (F) Quantification of granulosa cell proliferation rate after cells transfected with the csal1 specific siRNA. Values are presented as mean ± SD. Asterisk indicates that the values are significantly different at **P < 0.01, 1, *P < 0.05.
Figure 5
Figure 5
Repression of csal1 on granulosa cell proliferation and the expression of CCND1, Bcat, StAR, CYP11A1, and FSHR genes in GCs. The GCs were transfected with reconstructed pYr-adshuttle-4-csal1 plasmids (OE, overexpression group), pYr-adshuttle empty vector (NC, negative control), and no plasmid (BC, blank control). (A) The expression of csal1 gene before and after the GCs transfected with pYr-adshuttle-4-csal1 expression vector was examined by RT-qPCR. The values on the bar graphs are the mean ± SD. (B) Expression levels of csal1 protein in the GCs before and after the transfection with pYr-adshuttle-4-csal1 vector were detected by western blotting. The β-actin was used as the loading control. (C) The influence of csal1 overexpression on CCND1, Bcat, StAR, CYP11A1, and FSHR mRNA abundances in the GCs was examined. (D) The influence of csal1 overexpression on csal3 mRNA abundances in the GCs was examined. (E) The effects of csal1 overexpression on the GC proliferation were detected by BrdU assay. All cell nuclei show blue fluorescence indicative of DAPI staining; the BrdU-labeled cells showed red fluorescence indicating their newly synthesized DNA (×200). (F) Quantification of granulosa cell proliferation rate after cells transfected with the pYr-adshuttle-4-csal1 plasmid. Asterisk indicates that the values are significantly different at **P < 0.01, *P < 0.05.
Figure 6
Figure 6
Effects of silencing csal3 on granulosa cell proliferation and the expression of CCND1, Bcat, StAR, CYP11A1, and FSHR mRNA. The GCs were transfected with specific siRNA targeting csal3 gene, scrambled siRNA (NC, negative control), and no siRNA (BC, blank control). (A) The expression of csal3 gene before and after the GCs transfected with specific siRNA was analyzed using RT-qPCR. The values on the bar graphs are the mean ± SD. (B) Expression levels of csal3 protein in the GCs before and after the specific siRNA interference (RNAi) were detected by western blotting. The β-actin was used as the loading control. (C) The influence of silencing csal3 on CCND1, Bcat, StAR, CYP11A1, and FSHR mRNA abundances in the GCs was examined. (D) The influence of silencing csal3 on csal1 mRNA abundances in the GCs was examined. (E) The effects of csal3 knockdown on the GC proliferation were detected by BrdU assay. All cell nuclei show blue fluorescence indicative of DAPI staining; the BrdU-labeled cells showed red fluorescence indicating their newly synthesized DNA (×200). (F) Quantification of granulosa cell proliferation rate after cells transfected with the csal3-specific siRNA. Asterisk indicates that the values are significantly different at **P < 0.01, *P < 0.05.
Figure 7
Figure 7
The inhibitory effect of csal3 on granulosa cell proliferation and the expression of CCND1, Bcat, StAR, CYP11A1, and FSHR. The GCs were transfected with reconstructed pYr-adshuttle-4-csal3 plasmids (OE, overexpression group), pYr-adshuttle-4 empty vector (NC, negative control), and no plasmid (BC, blank control). (A) The expression of csal3 gene before and after the GCs transfected with pYr-adshuttle-4-csal3 expression vector was examined by RT-qPCR. The values on the bar graphs are the mean ± SD. (B) Expression levels of csal3 protein in the GCs before and after the transfection with pYr-adshuttle-4-csal3 vector were detected by western blotting. The β-actin was used as the loading control. (C) The influence of csal3 overexpression on CCND1, Bcat, StAR, CYP11A1, and FSHR mRNA abundances in the GCs was examined. (D) The influence of csal3 overexpression on csal1 mRNA abundances in the GCs was examined. (E) All cell nuclei show blue fluorescence indicative of DAPI staining; the BrdU-labeled cells showed red fluorescence indicating their newly synthesized DNA (original magnification ×200). (F) Quantification of granulosa cell proliferation rate after cells transfected with the pYr-adshuttle-4-csal3 plasmid. Asterisk indicates that the values are significantly different at **P < 0.01, *P < 0.05.
Figure 8
Figure 8
Synergistic inhibition of csal1 and csal3 in granulosa cell proliferation and the expression of CCND1, Bcat, StAR, CYP11A1, and FSHR. The GCs were transfected with specific siRNA targeting csal1 or/and csal3 genes, scrambled siRNA (NC, negative control), and no siRNA (BC, blank control) (A–F). The GCs were transfected with reconstructed pYr-adshuttle-4-csal1 or/and pYr-adshuttle-4-csal3 plasmids, pYr-adshuttle-4 empty vector (NC, negative control), and no plasmid (BC, blank control) (G–L). Values are presented as mean ± SD. Data labeled with different letters are significantly different from each other (P < 0.01).

Similar articles

Cited by

References

    1. Gilchrist RB, Ritter LJ, Myllymaa S, Kaivo-Oja N, Dragovic RA, Hickey TE, Ritvos O, Mottershead DG. Molecular basis of oocyte-paracrine signaling that promotes granulosa cell proliferation. J Cell Sci 2006; 119:3811–3821. - PubMed
    1. Woodruff TK, Shea LD. The role of the extracellular matrix in ovarian follicle development. Reprod Sci 2007; 14:6–10. - PMC - PubMed
    1. Qin N, Fan XC, Zhang YY, Xu XX, Tyasi TL, Jing Y, Mu F, Wei ML, Xu RF. New insights into implication of the SLIT/ROBO pathway in the prehierarchical follicle development of hen ovary. Poult Sci 2015; 94:2235–2246. - PubMed
    1. Xu RF, Qin N, Xu XX, Sun X, Chen XX, Zhao JH. Inhibitory efect of SLIT2 on granulosa cell proliferation mediated by the CDC42-PAKsERK1/2 MAPK pathway in the prehierarchical follicles of the chicken ovary. Sci Rep 2018; 8:9168. - PMC - PubMed
    1. Alqudah MA, Agarwal S, Al-Keilani MS, Sibenaller ZA, Ryken TC, Assem M. NOTCH3 is a prognostic factor that promotes glioma cell proliferation, migration and invasion via activation of CCND1 and EGFR. PLoS One 2013; 8:e77299. - PMC - PubMed

Publication types

MeSH terms