. 2020 Mar 1;116(3):671-685.
doi: 10.1093/cvr/cvz179.

N-cadherin overexpression enhances the reparative potency of human-induced pluripotent stem cell-derived cardiac myocytes in infarcted mouse hearts

Affiliations

N-cadherin overexpression enhances the reparative potency of human-induced pluripotent stem cell-derived cardiac myocytes in infarcted mouse hearts

Xi Lou et al. Cardiovasc Res. .

Abstract

Aims: In regenerative medicine, cellular cardiomyoplasty is one of the promising options for treating myocardial infarction (MI); however, the efficacy of such treatment has shown to be limited due to poor survival and/or functional integration of implanted cells. Within the heart, the adhesion between cardiac myocytes (CMs) is mediated by N-cadherin (CDH2) and is critical for the heart to function as an electromechanical syncytium. In this study, we have investigated whether the reparative potency of human-induced pluripotent stem cell-derived cardiac myocytes (hiPSC-CMs) can be enhanced through CDH2 overexpression.

Methods and results: CDH2-hiPSC-CMs and control wild-type (WT)-hiPSC-CMs were cultured in myogenic differentiation medium for 28 days. Using a mouse MI model, the cell survival/engraftment rate, infarct size, and cardiac functions were evaluated post-MI, at Day 7 or Day 28. In vitro, conduction velocities were significantly greater in CDH2-hiPSC-CMs than in WT-hiPSC-CMs. While, in vivo, measurements of cardiac functions: left ventricular (LV) ejection fraction, reduction in infarct size, and the cell engraftment rate were significantly higher in CDH2-hiPSC-CMs treated MI group than in WT-hiPSC-CMs treated MI group. Mechanistically, paracrine activation of ERK signal transduction pathway by CDH2-hiPSC-CMs, significantly induced neo-vasculogenesis, resulting in a higher survival of implanted cells.

Conclusion: Collectively, these data suggest that CDH2 overexpression enhances not only the survival/engraftment of cultured CDH2-hiPSC-CMs, but also the functional integration of these cells, consequently, the augmentation of the reparative properties of implanted CDH2-hiPSC-CMs in the failing hearts.

Keywords: Cardiac myocytes; Cardiac regeneration; Electro-mechanical syncytium; Human-induced pluripotent stem cells; Myocardial infarction; N-cadherin.


Figures

Graphical Abstract
Graphical Abstract
Figure 1
Figure 1
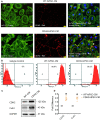
Characterization of WT-hiPSC-CMs and CDH2-hiPSC-CMs. Immunostaining and fluorescence microscopic analysis of Day 28 WT-hiPSC-CM and CDH2-hiPSC-CM cultures revealed the expression pattern of human cardiac specific regulatory protein, troponin T (green, hcTnT) and cell adhesion protein, cadherin 2 (red, CDH2). Compared with WT-hiPSC-CMs, the fluorescent intensity and distribution of CDH2 were much higher in the spontaneously and rhythmically beating CDH2-hiPSC-CMs (A). Immunostaining and flowcytometric analysis of Day 28 WT-hiPSC-CM and CDH2-hiPSC-CM cultures demonstrated the expression profile of hcTnT (98.8% and 99.2%, respectively), indicating a high level of purity of the differentiated myocytes (B). Similarly, western blot analyses validated the protein expression profiles of CDH2 and a gap junction protein, connexin 43 (Cx43), in both types of cardiac myocytes (C). Relative quantification of proteins showed that the expression levels of CDH2 and Cx43 were significantly higher in the case of CDH2-hiPSC-CMs compared with WT-hiPSC-CMs (D). The housekeeping protein, GAPDH, was used for western blot normalization. Cells were also counterstained for nuclei (blue, DAPI). Scale bar = 20 µm (panels in A). The values were means ± SEM for five independent cultures (n = 4). (*WT-hiPSC-CMs < CDH2-hiPSC-CMs, P < 0.05), by Student’s t-test with Holm–Sidak’s multiple comparisons test (D).
Figure 2
Figure 2
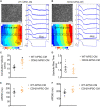
Action potential propagation in WT-hiPSC-CMs and CHD2-hiPSC-CMs cell monolayers. Representative examples of action potentials (APs) propagation during pacing at a cycle length (CL) of 800 ms in WT-hiPSC-CMs (A) and CDH2-hiPSC-CMs (B), respectively. Phase-contrast microphotographs of typical Day 28 cultures, displaying the homogeneous confluence (A and B), ischronal maps of activation spread, conduction velocity (CV), activation time (AT), and selected traces of raw optical APs and a spatially averaged AP over a 7 × 7 diodes in the monolayer centre without the motion artefact (A and B). Red dots depict ATs, green and brown dots depict times of repolarization to 50% and 80% levels of amplitude (A and B). Conduction velocity was significantly higher (∼48%) in CDH2-hiPSC-CMs than in WT-hiPSC-CMs (17.3 ± 3.7 vs. 11.7 ± 2.3 cm/s) (C). No significant difference was observed between these two types of cardiac myocytes with respect to the other measured parameters, viz., action potential (AP) upstroke rise time (RT) (D), as well as AP duration (APD) at 50% repolarization (APD50) (E) and APD at 80% repolarization (APD80) (F). Scale bar = 100 µm (phase contrast images, panels in A, B). The values were means ± SEM for eight independent cultures (n = 8). (*WT-hiPSC-CMs < CDH2-hiPSC-CMs, P < 0.005), by Student’s t-test with Holm–Sidak’s multiple comparisons test (CF).
Figure 3
Figure 3
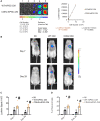
Survival of implanted WT-hiPSC-CMs and CDH2-hiPSC-CMs in vivo. The MI induced mice were implanted with myocytes (WT-hiPSC-CMs or CDH2-hiPSC-CMs) that constitutively expressed luciferase enzyme. Known quantities of luciferase expressing myocytes, viz., WT-hiPSC-CMs or CDH2-hiPSC-CMs were imaged, and the collected data were utilized to generate a standard curve depicting the relationship between bioluminescent imaging intensity (BLI) and cell number (A). After 7 or 28 days of induction of MI, all animals received D-luciferin injections. Bioluminescence images were captured 10 min post D-luciferin injection (B). To determine the number of engrafted cells among various MI treated groups, the BLI signal intensity was compared with the generated standard curve (C). The engraftment rate/survival was calculated by dividing the number of cells determined via BLI by the total number of cells administrated and expressed as a percentage (D). The values were means ± SEM. The number of animals per group was 7–9 (n = 7–9). (*WT-hiPSC-CMs > MI, CDH2-hiPSC-CMs > MI, P < 0.05), (#WT-hiPSC-CMs < CDH2-hiPSC-CMs, P < 0.05), by Student’s t-test with Holm–Sidak’s multiple comparisons test (C and D).
Figure 4
Figure 4
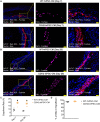
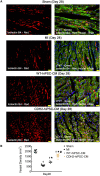
Engraftment potential of WT-hiPSC-CMs and CDH2-hiPSC-CMs in vivo. In post-MI, Day 7 and Day 28 left ventricular sections, localization of key human cardiac myocyte and nuclear phenotypic makers illustrated the expression pattern of human cardiac specific regulatory protein, troponin T (red, hcTnT), and human-specific nucleolar phosphoprotein, nucleolin (fuchsia, NCL). Immunostaining revealed varying degrees of survival and functional integration of implanted cells, viz., WT-hiPSC-CMs and CDH2-hiPSC-CMs, on Day 7 (A) and Day 28 (B) post-MI. The engraftment rate of CDH2-hiPSC-CMs was significantly higher than WT-hiPSC-CMs (C). Quantification of the percentage of CMs that were double positive for hcTnT and NCL in the engraftments, revealed no statistically significant difference between the two-implanted groups, viz., WT-hiPSC-CMs and CDH2-hiPSC-CMs (D). Cells were also counterstained for nuclei (blue, DAPI). Scale bar = 20 µm (panels in A, B). The values were means ± SEM. The number of animals per group was 5–9 (n = 5–9). (*WT-hiPSC-CMs < CDH2-hiPSC-CMs, P < 0.05), by two-way ANOVA (C); and Student’s t-test with Holm–Sidak’s multiple comparisons test (D).
Figure 5
Figure 5
Evaluation of peri-infarct border zone neo-vasculogenic response. In post-MI, Day 28 left ventricular peri-infarct border zone sections, immunolocalization of cardiac and endothelial specific phenotypic markers exhibited the expression pattern of cardiac specific regulatory protein, troponin T (green, cTnT), and lectin, (red, isolectin B4) (A). The per-infarct border zone neo-vasculogenic response was evaluated; the vessel density was quantified as the number of isolectin B4-positive vascular structures per square millimetre (B). The untreated MI group (MI) and treated MI groups (WT-hiPSC-CMs and CDH2-hiPSC-CMs) showed significantly higher vascular density (VD) compared with sham operated animals. Besides, the neo-angiogenic response was significantly higher in both cell-treatment groups than in untreated control MI animals. However, the quantified VD was significantly less in the WT-hiPSC-CM treated MI group than in CDH2-hiPSC-CM treated MI group (B). Cells were also counterstained for nuclei (blue, DAPI). Scale bar = 20 µm (panels in A). The values were means ± SEM. The number of animals per group was 5–7 (n = 5–7). (Sham < MI, WT-hiPSC-CMs, and CDH2-hiPSC-CMs, P < 0.05), (*MI < WT-hiPSC-CMs, and CDH2-hiPSC-CMs, P < 0.05), (#CDH2-hiPSC-CMs > WT-hiPSC-CMs), by one-way ANOVA, non-parametric Kruskal–Wallis test (B).
Figure 6
Figure 6
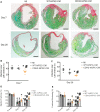
Assessment of left ventricular function by echocardiography. Sirus Red/Fast Green histochemical staining, revealing areas of infarcted (red, non-viable) and non-infarcted (green, viable) zones, in post-MI Day 7 and Day 28 ventricular tissue sections (A). The infarct size was quantified as the ratio of the scar area to the total surface area of the left ventricle and expressed as a percentage, for Day 7 (B) and for Day 28 (C). At Day 7, the CDH2-hiPSC-CMs treatment group showed significant reduction in infract size compared with the either the WT-hiPSC-CMs treatment group or the untreated control MI animals (B). While at Day 28, the infarct size was significantly reduced in the CDH2-hiPSC-CMs treated MI group than in the WT-hiPSC-CMs treated MI group, and in both cell-treatment groups than in untreated control MI animals. Echocardiographic assessments of left ventricular function, such as ejection fraction (D) and fractional shortening (E), were performed before MI induction (pre-MI) and on post-MI Day 7 and Day 28. Ejection fraction/fractional shortening were significantly greater in CDH2-hiPSC-CMs treated MI group than in WT-hiPSC-CMs treated MI group, and were significantly less in both cell-treatment groups than in pre-MI induction of the same animals. Scale bar = 1000 µm (panels in A). The values were means ± SEM. The number of animals per group was 7–9 (n = 7–9). (Panel B: *MI and WT-hiPSC-CMs > CDH2-hiPSC-CMs, P < 0.05; #WT-hiPSC-CMs > CDH2-hiPSC-CMs, P < 0.05), (Panel C: *MI > WT-hiPSC-CMs and CDH2-hiPSC-CMs, P < 0.05; #WT-hiPSC-CMs > CDH2-hiPSC-CMs, P < 0.05). (Panels D and E: *MI > WT-hiPSC-CMs and CDH2-hiPSC-CMs, P < 0.05; #WT-hiPSC-CMs > CDH2-hiPSC-CMs, P < 0.05), by one-way ANOVA, non-parametric Kruskal–Wallis test (B, C), and by two-way ANOVA (D, E).
Figure 7
Figure 7
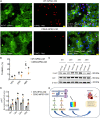
Detection and quantification of apoptosis by TUNEL assay. Detection and quantitative analysis of myocytes (WT-hiPSC-CMs or CDH2-hiPSC-CMs) treated under hypoxic conditions over a period of 48 h and measured by TUNEL [terminal deoxynucleotidyl transferase (TdT) dUTP nick-end labeling] assay. TUNEL staining, revealing the nuclear positivity of apoptotic cardiac myocytes (red, TUNEL) and the human cardiac specific regulatory protein, troponin T (green, hcTnT), after 48 h of hypoxic treatment (A). CDH2-hiPSC-CMs showed significantly less number of TUNEL positive cells than WT-hiPSC-CMs, at 12, 24, or 48 h of hypoxic treatment (B). Semi-quantitative western blot analysis, illustrating the activation pattern of AKT signalling pathway as a function of time, in both WT-hiPSC-CMs and CDH2-hiPSC-CMs (C). The levels of AKT activation were significantly higher in CDH2-hiPSC-CMs than in WT-hiPSC-CMs (D). The normoxic treated myocytes served as controls. (E) Illustration of activation of AKT-/ERK-/connexin-dependent signal transduction pathways by CDH2, results in enhancement of the reparative properties of implanted CDH2-hiPSC-CMs in the failing hearts. Cells were also counterstained for nuclei (blue, DAPI). Scale bar = 20 µm (Panels in A). The values were means ± SEM for three to five independent cultures (D, n = 3; B, n = 5). (Panel B: *WT-hiPSC-CMs > CDH2-hiPSC-CMs, P < 0.005), (Panel C: *WT-hiPSC-CMs < CDH2-hiPSC-CMs, P < 0.005), by two-way ANOVA (B, D).

Comment in

Similar articles

Cited by

References

    1. Soonpaa MH, Field LJ. Survey of studies examining mammalian cardiomyocyte DNA synthesis. Circ Res 1998;83:15–26. - PubMed
    1. Fuchs E, Segre JA. Stem cells: a new lease on life. Cell 2000;100:143–155. - PubMed
    1. Jackson KA, Majka SM, Wang H, Pocius J, Hartley CJ, Majesky MW, Entman ML, Michael LH, Hirschi KK, Goodell MA. Regeneration of ischemic cardiac muscle and vascular endothelium by adult stem cells. J Clin Invest 2001;107:1395–1402. - PMC - PubMed
    1. Ye L, Chang YH, Xiong Q, Zhang P, Zhang L, Somasundaram P, Lepley M, Swingen C, Su L, Wendel JS, Guo J, Jang A, Rosenbush D, Greder L, Dutton JR, Zhang J, Kamp TJ, Kaufman DS, Ge Y, Zhang J. Cardiac repair in a porcine model of acute myocardial infarction with human induced pluripotent stem cell-derived cardiovascular cells. Cell Stem Cell 2014;15:750–761. - PMC - PubMed
    1. Huang P, Tian X, Li Q, Yang Y. New strategies for improving stem cell therapy in ischemic heart disease. Heart Fail Rev 2016;21:737–752. - PubMed

Publication types

MeSH terms