. 2019 Aug 22;75(4):756-768.e7.
doi: 10.1016/j.molcel.2019.06.018. Epub 2019 Jul 23.

Time-Resolved Small RNA Sequencing Unravels the Molecular Principles of MicroRNA Homeostasis

Affiliations

Time-Resolved Small RNA Sequencing Unravels the Molecular Principles of MicroRNA Homeostasis

Brian Reichholf et al. Mol Cell. .

Abstract

Argonaute-bound microRNAs silence mRNA expression in a dynamic and regulated manner to control organismal development, physiology, and disease. We employed metabolic small RNA sequencing for a comprehensive view on intracellular microRNA kinetics in Drosophila. Based on absolute rate of biogenesis and decay, microRNAs rank among the fastest produced and longest-lived cellular transcripts, disposing up to 105 copies per cell at steady-state. Mature microRNAs are produced within minutes, revealing tight intracellular coupling of biogenesis that is selectively disrupted by pre-miRNA-uridylation. Control over Argonaute protein homeostasis generates a kinetic bottleneck that cooperates with non-coding RNA surveillance to ensure faithful microRNA loading. Finally, regulated small RNA decay enables the selective rapid turnover of Ago1-bound microRNAs, but not of Ago2-bound small interfering RNAs (siRNAs), reflecting key differences in the robustness of small RNA silencing pathways. Time-resolved small RNA sequencing opens new experimental avenues to deconvolute the timescales, molecular features, and regulation of small RNA silencing pathways in living cells.

Keywords: Argonaute; RNA expression dynamics; RNA metabolism; metabolic RNA labeling; microRNAs; post-transcriptional gene regulation; small RNA homeostasis; small RNA silencing; time-resolved RNA sequencing.


Conflict of interest statement

Declaration of Interests

VAH, BR and SLA declare competing financial interest. A patent application related to this work has been filed.

Figures
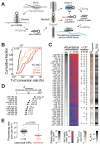
Figure 1
Figure 1. Intracellular kinetics and regulation of microRNA biogenesis.
(A) Overview of the miRNA pathway in flies. For details see text. (B) Cumulative distribution plot reports the mean T>C conversion rates for 42 abundantly expressed (> 100 ppm) miRNAs in small RNA libraries generated from total RNA of Drosophila S2 ago2ko cells treated with 4sU for the indicated time. Where applicable, T>C conversion rates were averaged between miR and miR*. P-values (Kolmogorov-Smirnov test; *** p<10-3; **** p<10-4) are shown. The fraction of miRs above 3σ confidence interval for T>C conversion in background (no 4sU) samples (dashed line; CI) is indicated for each time-point. (C) Abundance of the indicated miRNAs at steady-state (s.s.; parts per million, ppm) and of newly produced miRNAs after the indicated time of 4sU metabolic RNA labeling (4sU reads; norm. ppm) is shown. T>C conversions relative to the CI background-threshold are reported for each miRNA and 4sU labeling time-point. MicroRNA biogenesis rate as determined by linear regression are indicated in ppm per minute (kbiogenesis, ppm/min). kbiogenesis vs. steady-state ratios report the relative contribution of miRNA biogenesis rates to steady-state abundance. (D) Absolute biogenesis rates of abundantly produced miRNAs in molecules per minute per cell. Biogenesis rates were normalized to the absolute abundance of miRNAs in Drosophila S2 cells. Data represent mean ± stdev of two independent experiments. (E) Processing rates report transcriptional output-normalized mature miRNA biogenesis rates (in norm. ppm per minute) for 39 canonical miRNAs (canonical miRs; black) and three mirtrons (red) that are abundantly expressed (>100 ppm) in S2 ago2ko cells. P-value (Mann-Whitney test) is indicated. See also Figure S2.
Figure 2
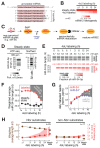
Figure 2. Timescales, constraints, and regulation of miRISC formation.
(A) Model for selective miRNA loading into Ago. See text for details. (B) Steady-state abundance (s.s.) and mean accumulation of T>C conversion containing reads normalized to 4sU-labeling efficiency (4sU reads in norm. ppm) of 18 abundantly expressed miR and miR* pairs at 5 and 15 min after 4sU metabolic labeling in ago2ko S2 cells. (C) Biogenesis rate (kbiog. in norm. ppm/min) of miR and miR* pairs (see Figure 1C and 2B). P-value (Mann-Whitney test; n.s., p>0.05) is shown. (D) Relative accumulation of metabolically labeled small RNAs upon 4sU labeling in ago2ko S2 cells. Mean ± 95% CI for 18 abundantly expressed miRNA duplexes partitioned in miR (red) and miR* (blue) strands is shown. P-values (Mann-Whitney test; n.s., p>0.05; *, p<0.05; ****, p<10-4) are indicated. Selective stabilization of miR versus miR* species is indicative of miRISC loading. (E) Linear regression of early time-points (5, 15 and 30 min) or late time-points (0.5, 1, 3, 6h) of experiment (D) are shown for miR (top, in red) and miR* strand (bottom, in blue). Slope ± stderr of the linear regressions is indicated. (F) Western blot analysis of endogenous (Ago1) and FLAG-MYC-tagged Ago1 (FM-Ago1) protein levels in wild-type S2 cells or three clones of expressing FLAG-MYC-tagged Ago1 (FM-Ago1OE). Actin indicates loading control. Relative Ago1 signal intensities are shown. (G) Northern hybridization assay probing for bantam-3p and miR-184-3p in wild-type S2 cells or three clones expressing FLAG-MYC-tagged Ago1 (FM-Ago1OE). Relative signal intensities of three independent experiments (mean ± stdev) normalized to 2S rRNA signal are indicated. (H) Ago-bound noncoding RNA levels (ncRNAs, normalized to 1 million miRNAs) in wild-type S2 cells (in black), S2 cells expressing FLAG-MYC-tagged Ago1 (clone 3) (in red, FM-Ago1OE) and S2 cells depleted of Tailor (tailorko) (Reimão-Pinto et al., 2016). Non-coding RNAs comprise ribosomal (rRNA), transfer (tRNA), small nuclear (snRNA) and small nucleolar (snoRNA) RNA species. Mean ± stdev of three (wt and FM-Ago1OE) or two (tailorko) replicate small RNA libraries are shown. P-values (two-tailed unpaired t-test) are indicated. See also Figure S3.
Figure 3
Figure 3. Dynamic emergence of isomiRs unravels molecular signatures of aging miRNAs.
(A) Schematic representation of 3´ isomiRs. See text for details. (B) Median 3′ end heterogeneity of 42 abundantly expressed miRNAs in S2 ago2ko cells is shown for all (steady-state) or T>C conversion-containing (4sU-labeled) reads across a 4sU labeling time course. (C) Model for exonucleolytic miRNA maturation in Drosophila. See text for details. (D) Steady-state length distribution of miR-34-5p in Drosophila ago2ko S2 cells as determined by high-throughput sequencing of small RNAs (left, heat map represents mean of 9 measurements; average cloning count is indicated in parts per million, ppm) or Northern-hybridization experiments (right). (E) Length distribution of miR-34-5p in libraries prepared from Drosophila ago2ko S2 cells subjected to 4sU metabolic labeling for the indicated time. Length distribution of T>C conversion containing reads (4sU-labeled, red) and all reads (steady-state, black) are shown. Read count (in ppm) is indicated. (F) Weighted average length of miR-34-5p in libraries prepared from Drosophila ago2ko S2 cells subjected to 4sU metabolic labeling for the indicated time. Data represent mean ± stdev of T>C conversion-containing reads (labeled, red) and all reads (steady-state, black) from two independent biological replicates. Decrease in weighted average length of T>C conversion-containing reads indicates exonucleolytic trimming (highlighted by grey area). (G) Loading of miR-34-5p as determined by the relative abundance of T>C conversion-containing (4sU labeled) reads in miR-34-5p (miR strand, red) and miR-34-3p (miR* strand, blue) after 4sU metabolic labeling of Drosophila ago2ko S2 cells. Mean ± stdev of two independent experiments is shown. Loading is highlighted by grey area. (H) Mean weighted average nucleotide length of T>C conversion containing (4sU-labeled) reads (labeled in brown) or median and interquartile range of the change in 3´ end heterogeneity (relative to ≤1h, in red) is shown across a 4sU labeling time course or at steady-state in Drosophila ago2ko S2 cells for miRNAs classified as Nbr substrates (left, n=25) or non-Nbr substrates (right, n=17). See also Figure S4.
Figure 4
Figure 4. Contribution of stability to miRNA abundance
(A) Model for the loading and turnover of small RNAs during assembly of the miRNA-induced silencing complex (miRISC). See main text for details. (B) The stability of miRNAs was determined by plotting the fraction of 4sU-labeling averaged across individual positions of small RNAs determined in a 4sU-metabolic labeling time course in Drosophila ago2ko S2 cells and normalized to the conversion rate measured at final time point (24h). The median 4sU-labeling fraction and interquartile range of 42 miR (red) or 18 miR*s (blue) is shown for individual time points. Data was fit to single exponential saturation kinetics to derive median half-lives (t½) and 95% confidence interval (CI95%). (C) Scatter dot plot reports the half-life of 42 miRs (red) and 18 miR*s (blue). Median and interquartile range are indicated. P-value (Mann-Whitney test) is shown. (D) Half-life of individual miRs (bantam-3p, miR-184-3p, miR-277-3p and miR-12-5p) was determined as described in (B). Values represent the mean ± stdev of two independent experiments. (E) Steady-state abundance and average half-life (t½) for the indicated miR (red) and miR* (blue). Individual half-life measurements for two independent experiments (r1 and r2) are reported. Half-life data that exceeded the maximum time of the measurement are indicated as > 24h. (F) MicroRNA biogenesis and turnover determine steady-state miRNA abundance in a miRNA-specific manner. MicroRNAs were ranked according to biogenesis rate (kbiogenesis), stability (t½) or steady-state abundance (steady-state) and the respective rank score (see heatmap reference) of three pairs of miRNAs that accumulate to similarly high, medium, or low levels at steady-state are shown. See also Figure S5.
Figure 5
Figure 5. RNA decay kinetics resolve compound fates of small RNAs.
(A) The stability of miR* (blue) strands of the indicated duplexes was determined by plotting the fraction of 4sU-labeled small RNAs across a 4sU-metabolic labeling time course in Drosophila ago2ko S2 cells to single exponential (dotted line) or two-phase (solid line) saturation kinetics. Data represent mean ± stdev of two independent experiments. Half-lives determined from the dual-phase decay kinetics (t½fast and t½slow) are indicated. MicroRNA duplex structures are shown as previously predicted (Kozomara and Griffiths-Jones, 2010). The miR* strand (blue) is defined by lower steady-state abundance relative to the miR strand (red). Base-pairing of three 5´ terminal nucleotides of the miR* strand is highlighted in blue and was used to determine the minimal free energy (MFE) duplex stability (see panel E). The 5´U of miR-2b-2-5p is highlighted in red and may contribute to loading of the miR* strand. (B) Median and interquartile range of stability measurements of 18 miR*s that either follow single-exponential (dark blue, n=12) or dual-phase decay kinetics (light blue, n=6). (C) Half-lives of miRs (red) and miR*s (blue) that followed single-exponential decay kinetics (single-fate) are compared to the two half-lives (slow and fast) observed for miR*s that were best described by dual-phase kinetics (dual-fate). Median ± interquartile range is shown. P-values (Mann-Whitney test) are indicated. (D) Steady-state abundance of miR* that follow single-exponential decay kinetics (single-fate, n=12) or dual-phase kinetics (dual-fate, n=6) are compared. Median ± interquartile range is shown. P-values (Mann-Whitney test) are indicated. (E) Minimal free energy (MFE, kcal/mol) of the three 5´-terminal nucleotides of the miR* strand (highlighted by blue boxes in panel A for dual-fate duplexes) in a single-fate (dark blue, n=12) or dual-fate (light blue, n=6) duplex. Median ± interquartile range is shown. P-value (Mann-Whitney test) is shown.
Figure 6
Figure 6. Molecular determinants of miRNA turnover.
(A) In Drosophila, miRNAs preferentially load into Ago1 to form miRISC. At the same time, a subset of miR*s load onto Ago2 to form siRISC, prompting the methylation of Ago2-bound small RNAs at the 2´ position of the 3´-terminal ribose. If and how Argonaute protein identity influences small RNA stability remains unknown. (B) Median decay kinetics of Ago2-enriched miRNAs (n=8; classified in Figure S6B) in an 4sU metabolic labeling time course in wild-type (wt, black) or ago2ko S2 cells (red) or from wild-type S2 cells employing a cloning strategy that enriches for small RNAs with modified 3´ termini (wt oxidized, blue). Median and interquartile range of two-phase or one-phase saturation kinetics (as specified in main text) are shown. The half-lives (t½) as determined by curve-fitting are indicated. (C) Comparison of small RNA stabilities in the context of Ago1 and Ago2. Half-lives of the 30 most abundant Ago1-bound miRNAs (red, Ago1) compared to the most abundant miRs and miR*s in small RNA libraries employing a cloning strategy that enriches for small RNAs with modified 3´ termini (blue, Ago2). The median and interquartile range is indicated. P-value (Mann-Whitney test) is shown. (D) Half-lives of miRNAs subjected to exonucleolytic 3´ end trimming by Nbr (in red, n=25) and non-Nbr substrates (in black, n=17) as classified in Figure S4. Median and interquartile range are shown. P-value (Mann-Whitney test) is indicated. See also Figure S6.

Comment in

Similar articles

Cited by

References

    1. Alberti C, Manzenreither RA, Sowemimo I, Burkard TR, Wang J, Mahofsky K, Ameres SL, Cochella L. Cell-type specific sequencing of microRNAs from complex animal tissues. Nat Methods. 2018;15:283–289. doi: 10.1038/nmeth.4610. - DOI - PMC - PubMed
    1. Ameres SL, Horwich MD, Hung JH, Xu J, Ghildiyal M, Weng Z, Zamore PD. Target RNA-Directed Trimming and Tailing of Small Silencing RNAs. Science. 2010;328:1534–1539. doi: 10.1126/science.1187058. - DOI - PMC - PubMed
    1. Ameres SL, Zamore PD. Diversifying microRNA sequence and function. Nat Rev Mol Cell Biol. 2013;14:475–488. doi: 10.1038/nrm3611. - DOI - PubMed
    1. Andrus A, Kuimelis RG. Analysis and purification of synthetic nucleic acids using HPLC. Curr Protoc Nucleic Acid Chem. 2001;Chapter 10:Unit 10.5–10.5.13. doi: 10.1002/0471142700.nc1005s01. - DOI - PubMed
    1. Bartel DP. Metazoan MicroRNAs. Cell. 2018;173:20–51. doi: 10.1016/j.cell.2018.03.006. - DOI - PMC - PubMed

Publication types

LinkOut - more resources