. 2019 Jul 25;129(10):4419-4432.
doi: 10.1172/JCI129143.

Gene loci associated with insulin secretion in islets from non-diabetic mice

Affiliations

Gene loci associated with insulin secretion in islets from non-diabetic mice

Mark P Keller et al. J Clin Invest. .

Abstract

Genetic susceptibility to type 2 diabetes is primarily due to β-cell dysfunction. However, a genetic study to directly interrogate β-cell function ex vivo has never been previously performed. We isolated 233,447 islets from 483 Diversity Outbred (DO) mice maintained on a Western-style diet, and measured insulin secretion in response to a variety of secretagogues. Insulin secretion from DO islets ranged >1,000-fold even though none of the mice were diabetic. The insulin secretory response to each secretagogue had a unique genetic architecture; some of the loci were specific for one condition, whereas others overlapped. Human loci that are syntenic to many of the insulin secretion QTL from mouse are associated with diabetes-related SNPs in human genome-wide association studies. We report on three genes, Ptpn18, Hunk and Zfp148, where the phenotype predictions from the genetic screen were fulfilled in our studies of transgenic mouse models. These three genes encode a non-receptor type protein tyrosine phosphatase, a serine/threonine protein kinase, and a Krϋppel-type zinc-finger transcription factor, respectively. Our results demonstrate that genetic variation in insulin secretion that can lead to type 2 diabetes is discoverable in non-diabetic individuals.

Keywords: Cell Biology; Diabetes; Genetics; Glucose metabolism; Mouse models.


Conflict of interest statement

Conflict of interest: The authors declare that no conflict of interest exists.

Figures

Figure 1
Figure 1. Ex vivo insulin secretion measurements from 479 DO mice maintained on a Western-style diet.
Distribution of female (n = 240) and male (n = 239) DO mice. Black ticks show sex for each mouse. Insulin secretion was determined from single isolated islets in response to 7 conditions: 3.3, 8.3, and 16.7 mM glucose (G); the amino acids (aa) leucine (0.5 mM), alanine (1.25 mM), and glutamine (2 mM) plus 8.3 mM G; KCl (40 mM) plus 3.3 mM G; GLP1 (100 nM) plus 8.3 mM G; and the fatty acid (PA) palmitate (0.5 mM) plus 16.7 mM G. Heatmap illustrates the amount of insulin secreted into the medium for each condition. Mice are ordered by the median value of their insulin secretory responses to the 7 conditions, highlighting mice that demonstrated low (left side) versus high (right side) secretory capacity. Insulin secretion values are the geometric mean of 6 individual measurements/condition/mouse for 479 DO mice, yielding a total of approximately 20,000 measures.
Figure 2
Figure 2. The genetic architecture of insulin and glucagon secretion.
Inferred QTL (LOD ≥ 6) for ex vivo islet phenotypes determined from DO mice maintained on HF/HS diet. (A) Total islet content for insulin and glucagon (n = 482 mice each). (B) Insulin secretion in response to 7 different conditions; low (3.3 mM), medium (8.3 mM) or high (16.7 mM) glucose (G), medium glucose plus amino acids (aa; Leu, Ala and Gln) or the incretin hormone GLP1 (100 nM), high glucose plus palmitic acid (PA; 0.5 mM), or low glucose plus KCl (40 mM) (n = 479 mice). (C) Glucagon secretion in response to low glucose plus KCl (n = 365 mice). Secretion traits were mapped without or with conditioning ( | ) on the islet content for insulin (ins/islet) or glucagon (gcg/islet), or the concentration of glucose used for the condition (e.g., 16.7 mM for PA-induced secretion). Red = high LOD, yellow = low LOD. (D) Profile illustrating the number of QTL (LOD > 5) occurring within a 4 Mb genomic window. QTL hotspots with 7 or more co-mapping traits were identified on chromosomes 1, 3, and 9 (see black arrowheads). Supplemental Table 1 lists all QTL, their LOD scores, genomic position, and allele effect values at the peak.
Figure 3
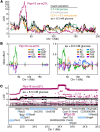
Figure 3. An insulin secretion hotspot on Chr 1 demonstrates shared genetic architecture with islet expression of Ptpn18.
(A) LOD profiles on Chr 1 for the islet expression of Ptpn18, and insulin secretion in response to 3.3 mM or 8.3 mM glucose, GLP1, or amino acids (aa). A quantitative trait locus was identified for all 5 traits at approximately 34 Mb. (B) Allele effect plots for Ptpn18 local eQTL and insulin secretion in response to aa. Both traits were linked to CAST as the high allele at the quantitative trait locus. (C) SNP association plots for Ptpn18 local eQTL and aa-induced insulin secretion. Twenty-four annotated genes are located within the region showing highest SNP association (~33.6 Mb and ~35 Mb), including Ptpn18. Ptpn18 was the only gene to show a local expression quantitative trait locus with a matching allele dependence to the insulin secretion quantitative trait locus. All data derive from QTL analysis of traits measured in 479 DO mice.
Figure 4
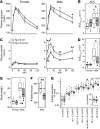
Figure 4. Ptpn18D197A mutant mice show reduced body weight, improved insulin sensitivity, and reduced insulin secretion from pancreatic islets.
Plasma glucose (A) and insulin (C) during an oGTT in female (n = 12, 13) and male (n = 19, 22) Ptpn18-WT and Ptpn18D197A mice, respectively, that were maintained on the HF/HS diet for 4 months; area under the curve (AUC) values for glucose (B) and insulin (D). Body weight at 18 weeks of age in female (n = 12, 13) and male (n = 19, 22) Ptpn18-WT and Ptpn18D197A mice, respectively (E). Number of islets harvested per mouse (F) (n = 8, 12) and insulin secretion (G) (n = 13, 16; G indicates glucose) from male Ptpn18-WT and Ptpn18D197A mice, respectively. *P < 0.05; **P < 0.01 for Student’s 2-tailed t test.
Figure 5
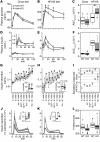
Figure 5. Hunk is necessary for Western diet–induced islet dysfunction.
Plasma glucose (A, B) and insulin (D, E) for Hunk-WT and Hunk-KO male mice maintained on either chow diet (n = 15 and 17, respectively) or the HF/HS diet (n = 8 each); AUC values for glucose (C) and insulin (F). Ex vivo insulin secretion measures for Hunk-WT and Hunk-KO male mice maintained on chow diet (G) (n = 14, 15) or HF/HS diet (H) (n = 8 each). Insets in G and H show total insulin content per islet for Hunk-WT and Hunk-KO mice. Ratio (HF/HS vs. chow diet) of insulin secretory responses (I). Insulin secretion during dynamic perifusion assay for Hunk-WT and Hunk-KO male mice maintained on chow diet (J) (n = 4 each) or HF/HS diet (K) (n = 3 and 5, respectively). Glucose was increased from 3.3 mM to 16.7 mM from time 0 to 40 minutes, after which glucose was returned to 3.3 mM. Insets in J and K show AUC for insulin responses during perifusion. Number of islets harvested per mouse (L); n = 23, 21 (chow), and n = 12 each (HF/HS) for Hunk-WT and Hunk-KO male mice, respectively. *P < 0.05 for Hunk-WT versus Hunk-KO, for Student’s 2-tailed t test. In G, H, and I, G indicates glucose.
Figure 6
Figure 6. β-Zfp148-KO mice show enhanced glucose tolerance during oGTT.
Plasma glucose (A) and insulin (C) responses during an oGTT performed on female and male control (Zfp148fl/fl) and β cell–specific Zfp148 knockout (β-Zfp148-KO) mice maintained on either chow diet (n = 8, 6 Zfp148fl/fl and β-Zfp148-KO female and male mice, respectively) or the HF/HS diet (n = 8 female each and n = 11, 7 for male Zfp148fl/fl and β-Zfp148-KO mice, respectively); AUC for glucose (B) and insulin (D). Ex vivo secretion measurements on Zfp148fl/fl and β-Zfp148-KO female and male mice maintained on either chow diet (n = 5, 3, 3 and 3, respectively), or the HF/HS diet (n = 5, 6, 5 and 5, respectively) (E). Insets show total islet insulin content (ng Ins/islet) for each sex/diet group. Total number of islets harvested per mouse maintained on either chow diet (n = 5, 3, 3, and 5, respectively) or the HF/HS diet (n = 6, 6, 8 and 8, respectively) for Zfp148fl/fl and β-Zfp148-KO female and male mice, respectively (F). Insulin secretion measurements during islet perifusion for HF/HS diet–fed female (n = 5, 4) and male (n = 5, 7) Zfp148fl/fl and β-Zfp148-KO mice, respectively (G). Islets were exposed to 16.7 mM glucose from 0 minutes to 30 minutes. Insets, total insulin content per islet for perifusion studies. AUC for insulin values in response to 16.7 mM glucose determined during perifusion studies (H). *P < 0.05; **P < 0.01 for Zfp148fl/fl versus β-Zfp148-KO mice, for Student’s 2-tailed t test.
Figure 7
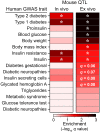
Figure 7. Insulin secretion QTL enrich for diabetes GWAS SNPs.
SNPs nominally associated (P < 10–4) to 16 diabetes-related traits were obtained from GWAS Central. QTL identified for whole-body physiological phenotypes in live mice (in vivo), or for insulin secretion traits from isolated islets (ex vivo) were mapped onto the human genome to identify syntenic regions. Enrichment for SNPs associated with one or more traits was determined for mapped regions; q values are corrected for number of tests; *q < 0.05.

Comment in

Similar articles

Cited by

References

    1. Poulsen P, Levin K, Petersen I, Christensen K, Beck-Nielsen H, Vaag A. Heritability of insulin secretion, peripheral and hepatic insulin action, and intracellular glucose partitioning in young and old Danish twins. Diabetes. 2005;54(1):275–283. doi: 10.2337/diabetes.54.1.275. - DOI - PubMed
    1. Billings LK, Florez JC. The genetics of type 2 diabetes: what have we learned from GWAS? Ann N Y Acad Sci. 2010;1212:59–77. doi: 10.1111/j.1749-6632.2010.05838.x. - DOI - PMC - PubMed
    1. Mohlke KL, Boehnke M. Recent advances in understanding the genetic architecture of type 2 diabetes. Hum Mol Genet. 2015;24(R1):R85–R92. doi: 10.1093/hmg/ddv264. - DOI - PMC - PubMed
    1. Prasad RB, Groop L. Genetics of type 2 diabetes-pitfalls and possibilities. Genes (Basel) 2015;6(1):87–123. doi: 10.3390/genes6010087. - DOI - PMC - PubMed
    1. Popkin BM. Nutrition transition and the global diabetes epidemic. Curr Diab Rep. 2015;15(9):64. doi: 10.1007/s11892-015-0631-4. - DOI - PMC - PubMed

Publication types

MeSH terms

Substances