. 2019 Jul 23;9(1):10684.
doi: 10.1038/s41598-019-47116-5.

Simulated microgravity increases polyploid giant cancer cells and nuclear localization of YAP

Affiliations

Simulated microgravity increases polyploid giant cancer cells and nuclear localization of YAP

Raj Pranap Arun et al. Sci Rep. .

Abstract

Physical cues are vital in determining cellular fate in cancer. In vitro 3D culture do not replicate forces present in vivo. These forces including tumor interstitial fluid pressure and matrix stiffness behave as switches in differentiation and metastasis, which are intricate features of cancer stem cells (CSCs). Gravity determines the effect of these physical factors on cell fate and functions as evident from microgravity experiments on space and ground simulations. Here, we described the role of simulation of microgravity (SMG) using rotary cell culture system (RCCS) in increasing stemness in human colorectal cancer cell HCT116. We observed distinct features of cancer stem cells including CD133/CD44 dual positive cells and migration in SMG which was not altered by autophagy induction or inhibition. 3D and SMG increased autophagy, but the flux was staggered under SMG. Increased unique giant cancer cells housing complete nuclear localization of YAP were observed in SMG. This study highlights the role of microgravity in regulating stemness in CSC and importance of physical factors in determining the same.


Conflict of interest statement

The authors declare no competing interests.

Figures
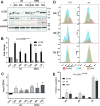
Figure 1
Figure 1
Autophagic Flux is staggered under Simulated Microgravity. Autophagy is significantly increased under 3D and SMG. Western blot images of autophagy markers LC3B, p62 in 3D and SMG at time points 24 h, 48 h and 72 h compared to control (A). The red box marks 37 kDa band for native form of p62. The corresponding fold change of expression normalized against GAPDH through densitometry (B) represented as mean ± S.D. The LC3B upregulation, P62 downregulation represents increase of autophagy process. The black bars represent relative LC3B expression and lighter bars represent p62 expression. The logarithmic ratio between LC3B-II/LC3B-I represented in graph (C). The black bar represent control, the plain light shaded bars represent 3D at 24, 48 and 72 h respectively and the light shaded bars with vertical lines represent SMG at 24,48 and 72 h. The experiment was repeated thrice and the mean ± S.D. of the log ratio was represented. The statistical significance was calculated using unpaired t test with Welch’s correction. Histogram of red and green fluorescence intensity of cells stained with Acridine orange at different time of experimentation (D), pink colour represents control cells intensity, blue colour represents cells subjected to 3D and orange colour represent cells subjected to SMG intensity. The representative graph (E). The black bars represent control, light bars represent cells subjected to 3D and dark bars represent cells subjected to SMG. The gating of autophagosome positive cell percentage from Acridine orange stained cells was represented in Supplementary Fig. S1. *P < 0.05, **P < 0.005, ***P < 0.001, statistical analysis done using Two-way anova with 95% confidence interval.
Figure 2
Figure 2
Autophagy core complex proteins are increased under SMG. Western blot images for Autophagic core complex proteins (Autopahgy-Related proteins) ATG3, ATG5, ATG7, ATG12, ATG16L1 at 48 h post 3D or SMG (A) and its corresponding graph (B) representing mean ± S.D of fold change. Western blot images for autophagy regulator Beclin1 and upstream regulators of autophagy (Forkhead box O3) FOXO3, (protein kinase B) AKT, (phosphatase and tensin homolog) PTEN and housekeeping protein GAPDH at 48 hours post 3D or SMG (C). the corresponding graph of expression fold change (D). The data represented as mean ± S.D. The expression intensity was measured through densitometry of western blot images fold change was normalized against GAPDH. The experiments were repeated thrice *P < 0.05, **P < 0.005, ***P < 0.001, statistical analysis done using unpaired t-test with Welch’s correction.
Figure 3
Figure 3
CD133/CD44 expressing cells are more in 3D and SMG. Dot plot for the surface expression of cancer stemness markers CD44 and CD133 analysed with FACS. CD44 stained with FITC, along Y axis and CD133 stained with PE along X axis (A). The experimental panel are grouped as rows (no experimental platform 1st row, 3D 2nd row and SMG 3rd row) and treatment groups AI and AE in columns (no treatment 1st column, Bafilomycin treatment (AI) 2nd column and Rapamycin treatment (AE) 3rd column) the top left pane represents control (untreated). The red gating boxed represent unique CD133/CD44 high cells in SMG. The graph representing cells positive for CD44 expression (quadrants 1 + 2) (B), cells positive for CD133 expression (quadrants 2 + 3) (C) and dual positive population counted form quadrant 2 (D). The experiment was repeated thrice and the graphs are represented as mean ± S.D. Significance measured using unpaired t test with Welch’s correction of individual groups with control is represented over the bar and the comparison between AI /AE with 3D/SMG is marked separately. The black bars represent control, light bars represent 3D and dark bars SMG. The bars with (/) lines represent AI and bars with (\) lines represent AE.
Figure 4
Figure 4
Migration assay. The images of colonies formed from trans-well migration of cells, assayed between 3D and SMG along the rows and treatment for AI and AE along columns against control (top left pane) (A). The bar graph representing fold increase in migration compared against control represented as mean fold change ± S.D (B). The experiment was repeated thrice, *P < 0.05, **P < 0.005, ***P < 0.001, statistical analysis done using unpaired t test with Welch’s correction. The bars with (/) lines represent AI and bars with (\) lines  represent AE.
Figure 5
Figure 5
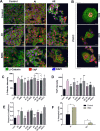
SMG causes YAP nuclear localization and PGCC formation: Confocal images of Stemness regulators β-Catenin and Yes Associated Protein (YAP) stained with FITC (green) and PE (red) respectively, nucleus stained with DAPI (blue) (A). The scale bars are 20 µm for all the images. The images were represented with experimental groups 3D and SMG in rows and treatment groups AI and AE in columns. Red arrow heads represent cells in AE with no nuclear YAP and White arrow heads represent cells with nuclear YAP. The confocal images of giant cells observed in SMG cells (B) regardless of treatment, with scale bar 20 µm. Bar chart representing average fluorescence intensity for β-Catenin (C), and YAP (D). The intensity measured between individual cells and the average intensity ± S.D represented. Nuclear localization of YAP measured as terms of Pearson’s coefficient (E) represented as mean ± S.D. The bar graphs are represented with control black bars, 3D with light bars and SMG with darker bars. The Bafilomycin treatment AI are represented with (/) lines and Rapamycin treatment (AE) are represented with (\) lines in bars. The checkered bars represent PGCC. Bar graph representing percentage distribution of aneuploid cells among control and SMG with different stages of aneuploid replication (F). The light colour depicts SMG and black bar represents control. The experiment was repeated twice and data represented as mean + S.D. statistical analysis performed using unpaired t test with Welch’s correction. *P < 0.05, **P < 0.005, ***P < 0.001, statistical analysis done using Mann Whitney t test for expression intensity (C,D) and Pearson’s coefficient (E).
Figure 6
Figure 6
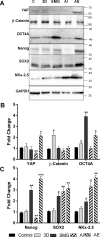
Nuclear YAP causes Yamanaka factor expression. Images for western blot for β-Catenin, (yes associated protein) YAP and Yamanaka factors (Octamer-binding transcription factor 4) OCT4A, (SRY-Box 2) SOX2, (Homeobox protein) Nanog and (NK2 Homeobox 5) NKx-2.5 (A) among control, 3D, SMG, Autophagy inhibition and Autophagy elevation. The protein expression represented as fold change normalized against GAPDH, compared against control (B) for proteins YAP, β-Catenin and OCT4A and bar graph of protein expression of SOX2, Nanog and NKX2.5 (C). The experiments were repeated thrice and the data represented as mean + S.D. *P < 0.05, **P < 0.005, ***P < 0.001, statistical analysis done using unpaired t test with Welch’s correction. The black bars represent control, light bars represent 3D and dark grey bars SMG. The bars with (/) lines represent AI and bars with (\) lines represent AE.

Similar articles

Cited by

References

    1. Li X, et al. Mitochondrial pyruvate carrier function determines cell stemness and metabolic reprogramming in cancer cells. Oncotarget. 2017;8:46363–46380. doi: 10.18632/oncotarget.18199. - DOI - PMC - PubMed
    1. Sharif T, et al. Autophagic homeostasis is required for the pluripotency of cancer stem cells. Autophagy. 2017;13:264–284. doi: 10.1080/15548627.2016.1260808. - DOI - PMC - PubMed
    1. Kim H, Lin Q, Glazer PM, Yun Z. The hypoxic tumor microenvironment in vivo selects the cancer stem cell fate of breast cancer cells. Breast Cancer Res. 2018;20:16. doi: 10.1186/s13058-018-0944-8. - DOI - PMC - PubMed
    1. Lathia JD, Heddleston JM, Venere M, Rich JN. Deadly teamwork: neural cancer stem cells and the tumor microenvironment. Cell Stem Cell. 2011;8:482–485. doi: 10.1016/j.stem.2011.04.013. - DOI - PMC - PubMed
    1. Ariffin A, Forde P, Jahangeer S, Soden D, Hinchion J. Releasing Pressure in Tumors: What Do We Know So Far and Where Do We Go from Here? A Review. Cancer Research. 2014;74:2655–2662. - PubMed

Publication types