. 2019 Jul 18;10(8):544.
doi: 10.1038/s41419-019-1757-0.

Hypoxia inducible factor 1α in vascular smooth muscle cells promotes angiotensin II-induced vascular remodeling via activation of CCL7-mediated macrophage recruitment

Affiliations

Hypoxia inducible factor 1α in vascular smooth muscle cells promotes angiotensin II-induced vascular remodeling via activation of CCL7-mediated macrophage recruitment

Dan Qi et al. Cell Death Dis. .

Abstract

The process of vascular remodeling is associated with increased hypoxia. However, the contribution of hypoxia-inducible factor 1α (HIF1α), the key transcription factor mediating cellular hypoxic responses, to vascular remodeling is established, but not completely understood. In the angiotensin II (Ang II)-induced vascular remodeling model, HIF1α was increased and activated in vascular smooth muscle cells (VSMCs). Selective genetic disruption of Hif1a in VSMCs markedly ameliorated Ang II-induced vascular remodeling, as revealed by decreased blood pressure, aortic thickness, collagen deposition, inflammation, and aortic stiffness. VSMC Hif1a deficiency also specifically suppressed Ang II-induced infiltration of CD45+CD11b+F4/80+CD206- M1 macrophages into the vessel. Mechanistically, HIF1α deficiency in VSMCs dramatically suppressed the expression of CCL7, a chemokine critical for macrophage recruitment. Bioinformatic analysis and chromatin immunoprecipitation assays revealed three functional hypoxia-response elements in the Ccl7 promoter, indicating that Ccl7 is a direct HIF1α target gene. Blocking CCL7 with antibody in vivo alleviated Ang II-induced hypertension and vascular remodeling, coincident with decreased macrophage infiltration. This study provides direct evidence that HIF1α activation in VSMCs exacerbates Ang II-induced macrophage infiltration and resultant vascular remodeling via its target gene Ccl7, and thus may serve as a potential therapeutic target for remodeling-related vascular disease.


Conflict of interest statement

The authors declare that they have no conflict of interest.

Figures

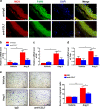
Fig. 1
Fig. 1. HIF1α is activated in VSMCs during Ang II-induced vascular remodeling.
WT mice were infused with saline or 1000 ng/kg/min Ang II for 28 days. a Immunofluorescence analysis of representative cross-sections of mice aortas for HIF1α (red) and α-SMA (green), nuclei was stained with DAPI. VSMCs were isolated form WT mice and treated with 1 μM Ang II for 24 h. b Hif1a mRNA was measured by qPCR analysis. c HIF1α protein was detected by western blot. **P < 0.01, ***P < 0.001, n = 3 per group, statistical significance was determined by the unpaired t-test
Fig. 2
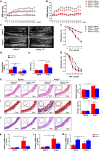
Fig. 2. HIF1α deficiency in SMCs suppresses Ang II-induced vascular remodeling in mice.
Hif1afl/fl and Hif1aΔSMC mice were infused with saline or Ang II (1000 ng/kg/min) for 28 days. a SBP and b DBP were measured by the tail-cuff method. *P < 0.05, **P < 0.01, ***P < 0.001 vs. Hif1afl/fl + Ang II; n = 10 per group, statistical significance was determined by two-way ANOVA analysis. M-mode ultrasound of abdominal aorta was acquired c, and the distensibility (d) as well as pulse wave velocity (PWV) (e) were measured. *P < 0.05, **P < 0.01, n = 6 per group. f, g Concentration–response curves of endothelium-dependent (acetylcholine, Ach) and endothelium-independent (sodium nitroprusside, SNP) relaxation. *P < 0.05 vs. Hif1afl/fl + Ang II, n = 6 per group. h Representative images of H&E staining and the mean medium thickness for the aortas. i Representative images of Masson’s trichrome staining and the fibrotic area of each group were analyzed. j Representative images of Elastin staining for the aortas. *P < 0.05, **P < 0.01, n = 8/saline group, n = 12/Ang II group. k–m Aortic Col1a1, Col3a1, and Mmp9 mRNAs were measured by qPCR. *P < 0.05, n = 6 per group. Statistical significance was determined by one-way ANOVA test followed by the unpaired t-test
Fig. 3
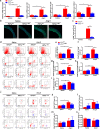
Fig. 3. SMC-specific HIF1α deficiency abolishes Ang II-induced M1 macrophage infiltration and vascular inflammation.
Hif1afl/fl and Hif1aΔSMC mice were infused with saline or 1000 ng/kg/min Ang II for 28 days. a Il1b, Il6, Tnfa, Mcp1 mRNAs in aortas after saline or angiotensin II infusion for 28 days were measured by qPCR. *P < 0.05, **P < 0.01, n = 6 per group. b Immunofluorescence staining of representative cross-sections of mice aortas for the F4/80-positive (green) cells and quantification (c) *P< 0.05, n = 6, statistical significance was determined by the unpaired t-test. Flow cytometry analysis was performed for the aortas (d, j) and CD45+ cells (e), CD45+CD11b+F4/80+ macrophages (f), CD45+CD11b+F4/80+CD206 M1 macrophages (g), CD45+CD11b+F4/80+CD206+ M2 macrophages (h), CD45+CD11b+LY6G+ neutrophils (i), CD45+CD3+ T cells (k), CD45+CD3+CD4+ T cells (l),CD45+CD3+CD8+ T cells (m), and CD45+CD3+NK11+ NKT cells (n) were quantified, respectively. *P < 0.05, **P < 0.01, ***P < 0.001, n = 6 per group. Statistical significance was determined by one-way ANOVA test followed by the unpaired t-test
Fig. 4
Fig. 4. HIF1α deficiency leading to low CCL7 expression suppresses macrophage recruitment by Ang II-induced VSMCs.
a Il1b, Il6, and Tnfa mRNA levels in 1 μM Ang II-treated Hif1afl/fl and Hif1aΔSMC VSMCs. **P < 0.01, n = 6 (independent experiments) per group. b Macrophage chemotaxis driven by supernatants from vehicle or 1 μM Ang II-treated Hif1afl/fl and Hif1aΔSMC VSMCs. ***P < 0.001, n = 6 (independent experiments) per group. c Adhesion assay of Calcein-AM-labeled macrophages with vehicle or 1 μM Ang II-treated Hif1afl/fl and Hif1aΔSMC VSMCs. **P < 0.01, ***P < 0.001, n = 6 (independent experiments) per group. d The cluster heat map of expression values for differentially expressed chemokines in the VSMCs after 150 μM CoCl2 treatment. Validation of chemokine mRNAs by qPCR in Ang II-treated aortas (e) and VSMCs (f) *P < 0.05, **P < 0.01, ***P < 0.001, n = 6 (independent experiments) per group, statistical significance was determined by one-way ANOVA test followed by the unpaired t-test. g Detection of CCL7 levels by ELISA in the supernatants from vehicle or Ang II-treated VSMCs. *P < 0.05, ***P < 0.001, n = 6 (independent experiments) per group
Fig. 5
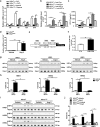
Fig. 5. Ccl7 is a HIF1α direct target gene.
a qPCR analysis of Ccl7 mRNA expression in Hif1afl/fl and Hif1aΔSMC VSMCs treated with vehicle, CoCl2, normoxia, or hypoxia (2% O2) for 6, 12, and 24 h. *P < 0.05, **P < 0.01, ***P < 0.001, n = 6 (independent experiments) per group. VSMCs isolated from Hif1afl/fl mice and Hif1aΔSMC mice were infected with oxygen-stable HIF1α-expressing lentivirus, and then treated with Ang II for 24 h, b Ccl7 mRNA was measured by qPCR and c CCL7 protein was detected by ELISA. d qPCR analysis of Ccl7 mRNA expression in vehicle or Ang II-treated Hif2afl/fl and Hif2aΔSMC VSMCs. e Schematic diagram of the mouse Ccl7 promoter illustrating the HREs in the regulatory region; the upstream regions were numbered in relation to the transcription initiation site. f Luciferase-reporter constructs under the control of the mouse Ccl7 promoter. HEK293T human embryonic kidney cells transiently transfected with the luciferase construct, and cotransfected with empty vector or HIF1a expression plasmids. Standard dual-luciferase assays were performed. EV, empty vector. **P < 0.01, n = 3. g, h ChIP assays of vehicle or Ang II-treated wild-type VSMCs using HIF1α or HIF2α antibodies. Data were normalized to input. *P < 0.05, **P < 0.01, n = 6 per group. i, j ChIP assays of vehicle or Ang II-treated Hif1afl/fl and Hif1aΔSMC VSMCs using HIF1α antibody. Data were normalized to input. *P < 0.05, **P < 0.01, n = 6 per group. Statistical significance was determined by one-way ANOVA test followed by the unpaired t-test
Fig. 6
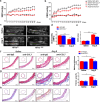
Fig. 6. CCL7 neutralization suppresses Ang II-induced vascular remodeling.
Wild-type mice were infused with saline or 1000 ng/kg/min Ang II for 28 days in the presence of normal IgG (anti-IgG) or CCL7-neutralizing antibody (anti-CCL7). SBP (a) and DBP (b) were measured by the tail-cuff method. *P < 0.05, **P < 0.01 vs. Ang II + anti-IgG; n = 8 per group, statistical significance was determined by two-way ANOVA test. c M-mode ultrasound of abdominal aortas, d measurement of distensibility, and e pulse wave velocity (PWV). *P < 0.05, **P < 0.01, n = 8 per group. f H&E staining of arterial sections and the medium thickness were measured. g Masson’s trichrome staining of arterial sections and the fibrotic area were measured. h Elastin staining was performed with the Gomori’s aldehyde-fuchsin of arterial sections. *P < 0.05, **P < 0.01, n = 8 per group. Statistical significance was determined by one-way ANOVA test followed by the unpaired t-test
Fig. 7
Fig. 7. CCL7 neutralization alleviates Ang II-induced M1 macrophage infiltration.
Wild-type mice were infused with 1000 ng/kg/min Ang II for 28 days in the present of control IgG (anti-IgG) or CCL7-neutralizing antibody (anti-CCL7). a Immunofluorescence analysis of representative cross-sections of mice aortas for iNOS (red) and F4/80 (green) with DAPI counterstaining (blue). The mRNA expression of Il1b (b), Il6 (c), and Tnfa (d) in aortas were analyzed by qPCR. *P < 0.05, **P < 0.01, n = 6 per group. e Chemotaxis assay for BMDM induced by supernatant from vehicle or Ang II-treated wild-type VSMCs in the presence of 8 μg/mL of control IgG or CCL7-neutralizing antibody. *P < 0.05 and **P < 0.01, n = 6 (independent experiments)

Similar articles

Cited by

References

    1. Collaborators, G. B. D. R. F. Global, regional, and national comparative risk assessment of 79 behavioural, environmental and occupational, and metabolic risks or clusters of risks, 1990-2015: a systematic analysis for the Global Burden of Disease Study 2015. Lancet. 2016;388:1659–1724. doi: 10.1016/S0140-6736(16)31679-8. - DOI - PMC - PubMed
    1. McMaster WG, Kirabo A, Madhur MS, Harrison DG. Inflammation, immunity, and hypertensive end-organ damage. Circ Res. 2015;116:1022–1033. doi: 10.1161/CIRCRESAHA.116.303697. - DOI - PMC - PubMed
    1. Viel EC, Lemarie CA, Benkirane K, Paradis P, Schiffrin EL. Immune regulation and vascular inflammation in genetic hypertension. Am J Physiol Heart Circ Physiol. 2010;298:H938–H944. doi: 10.1152/ajpheart.00707.2009. - DOI - PubMed
    1. Capers Qt, et al. Monocyte chemoattractant protein-1 expression in aortic tissues of hypertensive rats. Hypertension. 1997;30:1397–1402. doi: 10.1161/01.HYP.30.6.1397. - DOI - PubMed
    1. Rudemiller NP, Crowley SD. The role of chemokines in hypertension and consequent target organ damage. Pharmacol Res. 2017;119:404–411. doi: 10.1016/j.phrs.2017.02.026. - DOI - PMC - PubMed

Publication types

MeSH terms