Fluid shear stress stimulates breast cancer cells to display invasive and chemoresistant phenotypes while upregulating PLAU in a 3D bioreactor
- PMID: 31317530
- PMCID: PMC6774895
- DOI: 10.1002/bit.27119
Fluid shear stress stimulates breast cancer cells to display invasive and chemoresistant phenotypes while upregulating PLAU in a 3D bioreactor
Abstract
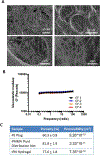
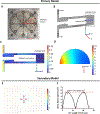
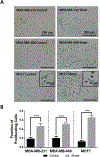
Breast cancer cells experience a range of shear stresses in the tumor microenvironment (TME). However most current in vitro three-dimensional (3D) models fail to systematically probe the effects of this biophysical stimuli on cancer cell metastasis, proliferation, and chemoresistance. To investigate the roles of shear stress within the mammary and lung pleural effusion TME, a bioreactor capable of applying shear stress to cells within a 3D extracellular matrix was designed and characterized. Breast cancer cells were encapsulated within an interpenetrating network hydrogel and subjected to shear stress of 5.4 dynes cm-2 for 72 hr. Finite element modeling assessed shear stress profiles within the bioreactor. Cells exposed to shear stress had significantly higher cellular area and significantly lower circularity, indicating a motile phenotype. Stimulated cells were more proliferative than static controls and showed higher rates of chemoresistance to the anti-neoplastic drug paclitaxel. Fluid shear stress-induced significant upregulation of the PLAU gene and elevated urokinase activity was confirmed through zymography and activity assay. Overall, these results indicate that pulsatile shear stress promotes breast cancer cell proliferation, invasive potential, chemoresistance, and PLAU signaling.
Keywords: 3D bioreactor; PLAU; breast cancer; interpenetrating hydrogel; mechanotransduction; shear stress.
© 2019 Wiley Periodicals, Inc.
Conflict of interest statement
Conflicts of Interest
The authors have no conflicts to declare.
Figures


Similar articles
-
High expression of MnSOD promotes survival of circulating breast cancer cells and increases their resistance to doxorubicin.Oncotarget. 2016 Aug 2;7(31):50239-50257. doi: 10.18632/oncotarget.10360. Oncotarget. 2016. PMID: 27384484 Free PMC article.
-
Roles for GP IIb/IIIa and αvβ3 integrins in MDA-MB-231 cell invasion and shear flow-induced cancer cell mechanotransduction.Cancer Lett. 2014 Mar 1;344(1):62-73. doi: 10.1016/j.canlet.2013.10.019. Epub 2013 Oct 28. Cancer Lett. 2014. PMID: 24176823
-
Regulation of AKT phosphorylation by GSK3β and PTEN to control chemoresistance in breast cancer.Breast Cancer Res Treat. 2019 Jul;176(2):291-301. doi: 10.1007/s10549-019-05239-3. Epub 2019 Apr 20. Breast Cancer Res Treat. 2019. PMID: 31006103
-
Encapsulated explant in novel low shear perfusion bioreactor improve cell isolation, expansion and colony forming unit.Cell Tissue Bank. 2019 Mar;20(1):25-34. doi: 10.1007/s10561-019-09749-8. Epub 2019 Jan 23. Cell Tissue Bank. 2019. PMID: 30673903
-
The matrix environmental and cell mechanical properties regulate cell migration and contribute to the invasive phenotype of cancer cells.Rep Prog Phys. 2019 Jun;82(6):064602. doi: 10.1088/1361-6633/ab1628. Epub 2019 Apr 4. Rep Prog Phys. 2019. PMID: 30947151 Review.
Cited by
-
A modular microfluidic platform to study how fluid shear stress alters estrogen receptor phenotype in ER+ breast cancer cells.Microsyst Nanoeng. 2024 Feb 16;10:25. doi: 10.1038/s41378-024-00653-0. eCollection 2024. Microsyst Nanoeng. 2024. PMID: 38370397 Free PMC article.
-
A Bioreactor for 3D In Vitro Modeling of the Mechanical Stimulation of Osteocytes.Front Bioeng Biotechnol. 2022 Mar 25;10:797542. doi: 10.3389/fbioe.2022.797542. eCollection 2022. Front Bioeng Biotechnol. 2022. PMID: 35402411 Free PMC article.
-
Beyond matrix stiffness: targeting force-induced cancer drug resistance.Trends Cancer. 2023 Nov;9(11):937-954. doi: 10.1016/j.trecan.2023.07.006. Epub 2023 Aug 8. Trends Cancer. 2023. PMID: 37558577 Free PMC article. Review.
-
Extracellular Matrix Cues Regulate Mechanosensing and Mechanotransduction of Cancer Cells.Cells. 2024 Jan 2;13(1):96. doi: 10.3390/cells13010096. Cells. 2024. PMID: 38201302 Free PMC article. Review.
-
Subpathway Analysis of Transcriptome Profiles Reveals New Molecular Mechanisms of Acquired Chemotherapy Resistance in Breast Cancer.Cancers (Basel). 2022 Oct 5;14(19):4878. doi: 10.3390/cancers14194878. Cancers (Basel). 2022. PMID: 36230801 Free PMC article.
References
-
- Afrimzon E, Botchkina G, Zurgil N, Shafran Y, Sobolev M, Moshkov S, Ravid-Hermesh O, Ojima I, Deutsch M. 2016. Hydrogel microstructure live-cell array for multiplexed analyses of cancer stem cells, tumor heterogeneity and differential drug response at single-element resolution. Lab. Chip 16:1047–1062. - PubMed
-
- Akimoto S, Mitsumata M, Sasaguri T, Yoshida Y. 2000. Laminar Shear Stress Inhibits Vascular Endothelial Cell Proliferation by Inducing Cyclin-Dependent Kinase Inhibitor p21Sdi1/Cip1/Waf1. Circ. Res 86:185–190. - PubMed
-
- Avraham-Chakim L, Elad D, Zaretsky U, Kloog Y, Jaffa A, Grisaru D. 2013. Fluid-Flow Induced Wall Shear Stress and Epithelial Ovarian Cancer Peritoneal Spreading: e60965. PLoS One 8 http://search.proquest.com.proxy.lib.umich.edu/docview/1330895410/abstra.... - PMC - PubMed
-
- Avvisato CL, Yang X, Shah S, Hoxter B, Li W, Gaynor R, Pestell R, Tozeren A, Byers SW. 2007. Mechanical force modulates global gene expression and β-catenin signaling in colon cancer cells. J Cell Sci 120:2672–2682. - PubMed
Publication types
MeSH terms
Substances
Grants and funding
LinkOut - more resources
Full Text Sources
Medical

