. 2019 Jul 17;11(14):5008-5034.
doi: 10.18632/aging.102095.

Ginsenoside Rb1 regulates prefrontal cortical GABAergic transmission in MPTP-treated mice

Affiliations

Ginsenoside Rb1 regulates prefrontal cortical GABAergic transmission in MPTP-treated mice

Yan Liu et al. Aging (Albany NY). .

Abstract

Parkinson's disease (PD) is a common neurodegenerative disease, featured by motor deficits and non-motor symptoms such as cognitive impairment, and malfunction of gamma-aminobutyric acid (GABA) mediated inhibitory transmission plays an important role in PD pathogenesis. The ginsenoside Rb1 molecule, a major constituent of the extract from the Ginseng root, has been demonstrated to ameliorate motor deficits and prevent dopaminergic neuron death in PD. However, whether Rb1 can regulate GABAergic transmission in PD-associated deficits and its underlying mechanisms are still unclear. In this study, we explored the effects of Rb1 on the GABAergic synaptic transmission in 1-methyl-4-phenyl-1,2,3,6-tetrahydropyridine (MPTP) mouse model of PD. We demonstrated that Rb1 can bind with GABAARα1 and increase its expression in the SH-SY5Y cells and in the prefrontal cortex (PFC) of MPTP model in vitro and in vivo. Furthermore, Rb1 can promote prefrontal cortical GABA level and GABAergic transmission in MPTP-treated mice. We also revealed that Rb1 may suppress presynaptic GABABR1 to enhance GABA release and GABAA receptor-mediated inhibitory transmission. In addition, Rb1 attenuated MPTP-induced dysfunctional gait dynamic and cognitive impairment, and this neuroprotective mechanism possibly involved regulating prefrontal cortical GABAergic transmission. Thus, Rb1 may serve as a potential drug candidate for the treatment of PD.

Keywords: GABA receptors; GABAergic transmission; Ginsenoside Rb1; Parkinson’s disease; cognitive impairment.


Conflict of interest statement

CONFLICTS OF INTEREST: The authors declare no conflicts of interest.

Figures

Figure 1
Figure 1
Molecular docking analysis shows Ginsenoside Rb1 binding with GABAA receptor. (A) Original 2D image of Rb1. (B) Modified 3D image of Rb1. (C) Overall map of Rb1 interaction with GABAARα1. (D) Interaction between Rb1 with the TMD of GABAARα1 receptor. Note that when Rb1 (indicted by green stick) was docked in the TMD of GABAARα1, two hydrogen bonds formed with Ile239 and Trp246 sites (indicated by red dotted line). Besides, Rb1 also formed a hydrophobic interaction with multiple hydrophobic amino acids or hydrophobic parts of polar amino acids in the TMD domain of GABAARα1 (Ile235, Val238, Ile239, Val243, Trp246, Phe298, Ile302, Ala305, Thr306, Tyr309, Phe310, Ary397, Pro401, Leu402, Phe404) (indicated by blue stick).
Figure 2
Figure 2
Rb1 increases GABAARα1 and gephyrin expression in normal or MPP+-treated SH-SY5Y cell. (A) Effect of different concentrations of MPP+ on the expression of GABAARα1, GAD67, gephyrin, and PSD-95 in SH-SY5Y cell. (B) Effect of different concentrations of Rb1 on the expression of GABAARα1, GAD67, gephyrin, and PSD-95 in SH-SY5Y cell. (C) Effect of different concentrations of Rb1 on the expression of GABAARα1, gephyrin, and vGAT in 500 μM MPP+-treated SH-SY5Y cell. n = 3. Results are expressed as the mean ± SEM. **P < 0.01 and *P < 0.05 vs. control; ##P < 0.01 and #P < 0.05 vs. MPP+ group. Statistical significance was determined by one-way ANOVA and the Bonferroni post-hoc test for pairwise comparisons.
Figure 3
Figure 3
Rb1 prevented MPTP-induced altered gait dynamics. (A) shows the image extracted from a video recording of the underside of a walking mouse. (BD) Effect of Rb1 on the stride time, stride length, and stride frequency in MPTP-treated mice. (E and F) Effect of Rb1 on the step sequence in MPTP-treated mice. Note that Rb1-prevented MPTP-induced disorder of step sequence as indicated by black dotted arrow in the figure. (G and H) Effect of Rb1 on the swing duration and ataxia coefficient in MPTP-treated mice. n = 12 per group. Results are expressed as the mean ± SEM. **P < 0.01 and *P < 0.05 vs. control group; ##P < 0.01 vs. MPTP group. Statistical significance was determined by one-way ANOVA and the Bonferroni post-hoc test for pairwise comparisons.
Figure 4
Figure 4
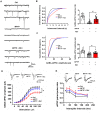
Rb1 modulates GABAergic transmission in the PFC in MPTP-treated mice. (A) Representative traces of GABA receptor-mediated mIPSCs. All mIPSCs were recorded at a holding potential of −65 mV. (B) Cumulative frequency plots of the inter-event interval (left) and quantitative analysis of the frequency of GABA receptor-mediated mIPSCs (right). (C) Cumulative frequency plots of mIPSC amplitude (left) and quantitative analysis of the amplitude of GABA receptor-mediated mIPSCs (right). (D) Representative traces of eIPSCs at 40, 60, and 100 μA stimulus intensities (top) and stimulus-response curves of PFC neurons from the indicated treatment groups (bottom). (E) Paired-pulse ratio analysis. Representative traces (top) and quantification analysis (bottom). Data were obtained from the whole-cell recordings of the prefrontal cortex pyramidal neurons from the three groups of mice including Ctrl mice, MPTP-treated mice, MPTP+Rb1 treated mice. n = 14–20 per group. Results are expressed as the mean ± SEM. **P < 0.01 and *P < 0.05 vs. control group; ##p < 0.01, #p < 0.05 vs. MPTP group. Statistical significance was determined by one-way ANOVA and Bonferroni test as post hoc comparisons.
Figure 5
Figure 5
Rb1 increases GABA level in the PFC in MPTP-treated mice. (A-a, b, and c) Three different imaging orientations of the structural scans of the mouse brain. (A-d) The regions of interest (ROIs) in a brain slice positioned in the transverse plane to access the maximum of the PFC. GABA-CEST, B0, and B1 maps were also acquired from this slice (thickness = 3 mm). (B) The top two panels show GABA-CEST maps of the whole brain in (a) the MPTP group and (b) the MPTP+Rb1 group. The bottom two panels show GABA-CEST maps of the ROIs in the PFC of (c) the MPTP group and (d) the MPTP+Rb1 treatment group. (C and D) Superimposed maps of the Z-spectrum and magnetization transfer ratio asymmetry (MTRasym) spectrum between the MPTP group and the MPTP+Rb1 treatment group. (E) Quantification of GABA level in the PFC of the MPTP group and the MPTP+Rb1 treatment group. n = 5 per group. Results are expressed as the mean ± SEM. ##P < 0.01 vs. MPTP group. Statistical significance was determined by a Student's t-test.
Figure 6
Figure 6
Rb1 promotes GABAARα1 receptor expression in the PFC in MPTP-treated mice. (A and B) The effect of Rb1 on total GABAARα1 expression and expression in the membrane fraction of the PFC of MPTP-treated mice was determined by western blotting. (C) The effect of Rb1 on GAD67 and gephyrin expression in the PFC of MPTP-treated mice was determined by western blotting. (D) Immunofluorescence staining of GABAARα1 (green), gephyrin (red) and NeuN (purple) in the PFC of MPTP-treated mice. Nuclei are labeled with DAPI (blue). Scale bar = 10 μm. Western blotting results are from two of the six mice in each group and are expressed as the mean ± SEM of three experiments. **P < 0.01 and *P < 0.05 vs. control; ##P < 0.01 and #P < 0.05 vs. MPTP group. Statistical significance was determined by one-way ANOVA and the Bonferroni post-hoc test for pairwise comparisons.
Figure 7
Figure 7
Rb1 modulates GABAB receptor in the PFC of MPTP-treated mice. (A) Overall map of Rb1 interaction with GABABR1 receptor. (B) Interaction between Rb1 with the extracellular domain of 4MS1, agonist conformation of GABABR1 receptor. Note that when Rb1 (indicted by green stick) was docked in the extracellular domain of 4MS1, four hydrogen bonds formed with the amino group of main chain and hydroxyl group of side chain of Ser130 sites, the amino group of main chain of Ser131 site, and the side chain of Asp104 site (indicated by red dotted line). Besides, Rb1 also formed a hydrophobic interaction with multiple hydrophobic amino acids or hydrophobic parts of polar amino acids in the extracellular domain of 4MS1 (Cys103, Cys129, Trp65, His170, Ser153, Tyr250, Val201) (indicated by blue stick). (C and D) The effect of Rb1 on the GABAB receptor expression in the synaptosome and PSD fraction of the PFC of MPTP-treated mice was determined by western blotting. Western blotting results are from two of the six mice in each group and are expressed as the mean ± SEM of three experiments. (E) Representative traces of GABA receptor-mediated mIPSCs in the presence of Rb1 and GABAB-receptor agonist Baclofen. All mIPSCs were recorded at a holding potential of −65 mV. (F) Cumulative frequency plots of the inter-event interval (left) and quantitative analysis of the frequency of GABA receptor-mediated mIPSCs (right) in the presence of Rb1 and presence of Baclofen. (G) Cumulative frequency plots (left) and quantitative analysis (right) of the amplitude of GABA receptor-mediated mIPSCs in the presence of Rb1 and presence of Baclofen. n = 14–20 per group. **P < 0.01 and *P < 0.05 vs. control; ##P < 0.01 and #P < 0.05 vs. MPTP group; &P < 0.05 vs. MPTP+Rb1 group. Statistical significance was determined by one-way ANOVA and the Bonferroni post-hoc test for pairwise comparisons.
Figure 8
Figure 8
Rb1 attenuates memory impairments in the MPTP mouse model of PD. (A) Representative path tracings in the open field test. (BE) Total travelled distance, movement speed, number of entries to the center, and the time spent in the center of the open-field after Rb1 administration in MPTP-treated mice. (F) T-maze results after Rb1 administration in MPTP-treated mice are presented as alternation triplets (consecutive triplets of different arm-choices). (G) Design of the novel-object recognition (NOR) task. In the training phase, the mouse is exposed to two objects “A” and “B”. In the testing phase 1 h later, the mouse is exposed to the same object “A” and a novel object “C”. (H) Percent time spent with object A or B in the training phase of the NOR test. (I) Results from the testing phase of the NOR test show percent time spent with the novel object (exploratory preference). n = 8 in control group, n = 9 in MPTP group, n = 10 in MPTP+Rb1 group and n = 8 in Rb1 group. Results are expressed as the mean ± SEM. **P < 0.01 and *P < 0.05 vs. control group; ##P < 0.01 and #P < 0.05 vs. MPTP group. Statistical significance was determined by one-way ANOVA and the Bonferroni post-hoc test for pairwise comparisons.

Similar articles

Cited by

References

    1. Goetz CG. The history of Parkinson’s disease: early clinical descriptions and neurological therapies. Cold Spring Harb Perspect Med. 2011; 1:a008862. 10.1101/cshperspect.a008862 - DOI - PMC - PubMed
    1. Sanjari Moghaddam H, Zare-Shahabadi A, Rahmani F, Rezaei N. Neurotransmission systems in Parkinson’s disease. Rev Neurosci. 2017; 28:509–36. 10.1515/revneuro-2016-0068 - DOI - PubMed
    1. Elmaki EE, Gong T, Nkonika DM, Wang G. Examining alterations in GABA concentrations in the basal ganglia of patients with Parkinson’s disease using MEGA-PRESS MRS. Jpn J Radiol. 2018; 36:194–99. 10.1007/s11604-017-0714-z - DOI - PubMed
    1. Dupont E, Christensen SE, Hansen AP, de Fine Olivarius B, Orskov H. Low cerebrospinal fluid somatostatin in Parkinson disease: an irreversible abnormality. Neurology. 1982; 32:312–14. 10.1212/WNL.32.3.312 - DOI - PubMed
    1. Iwasawa C, Kuzumaki N, Suda Y, Kagawa R, Oka Y, Hattori N, Okano H, Narita M. Reduced expression of somatostatin in GABAergic interneurons derived from induced pluripotent stem cells of patients with parkin mutations. Mol Brain. 2019; 12:5. 10.1186/s13041-019-0426-7 - DOI - PMC - PubMed

Publication types