

Highly Dynamic Changes in the Activity and Regulation of Macroautophagy in Hearts Subjected to Increased Proteotoxic Stress
- PMID: 31297061
- PMCID: PMC6606963
- DOI: 10.3389/fphys.2019.00758
Highly Dynamic Changes in the Activity and Regulation of Macroautophagy in Hearts Subjected to Increased Proteotoxic Stress
Abstract
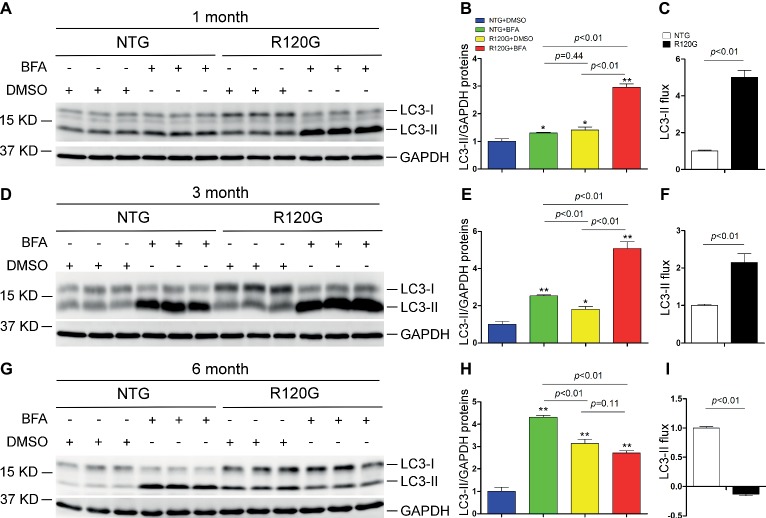
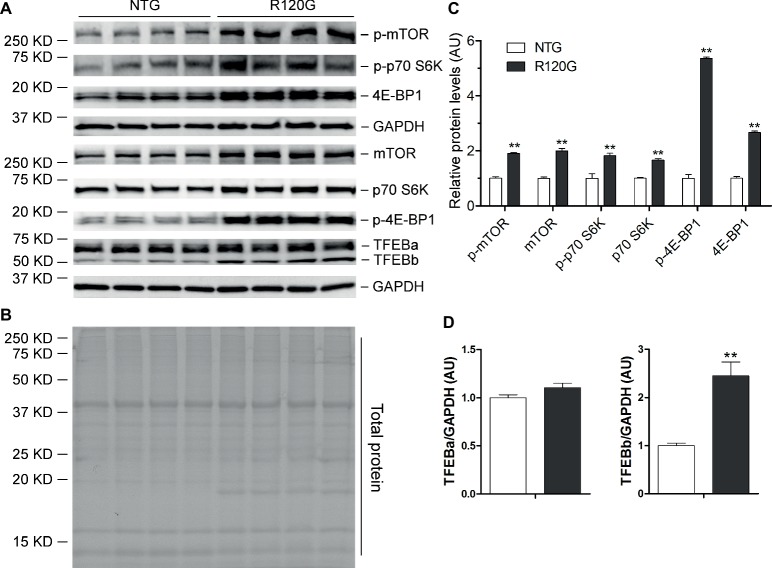
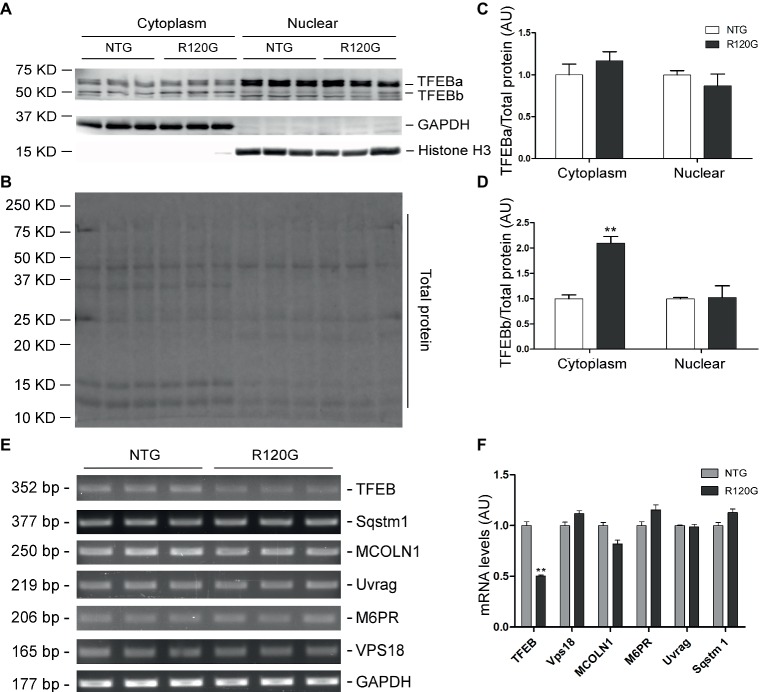
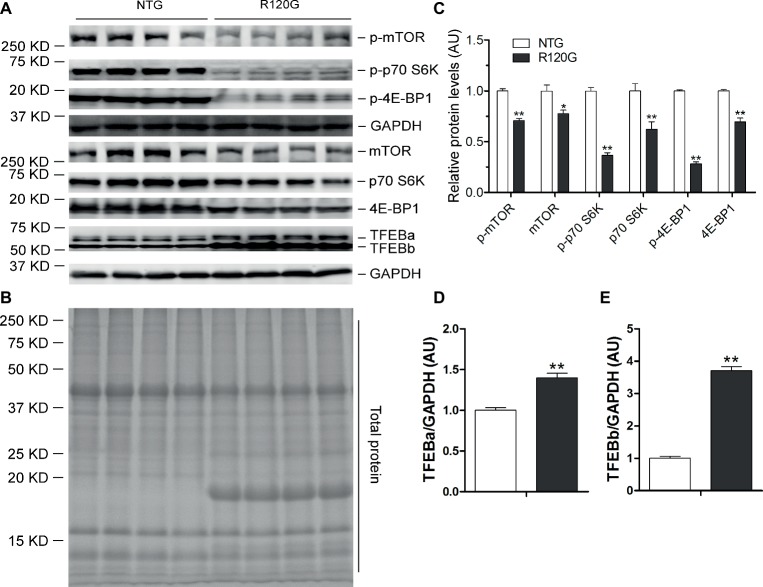
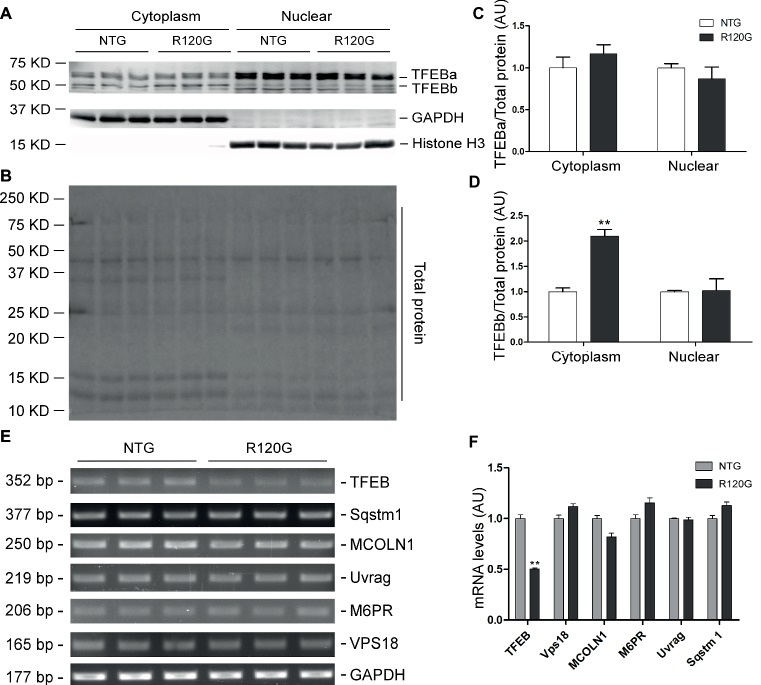
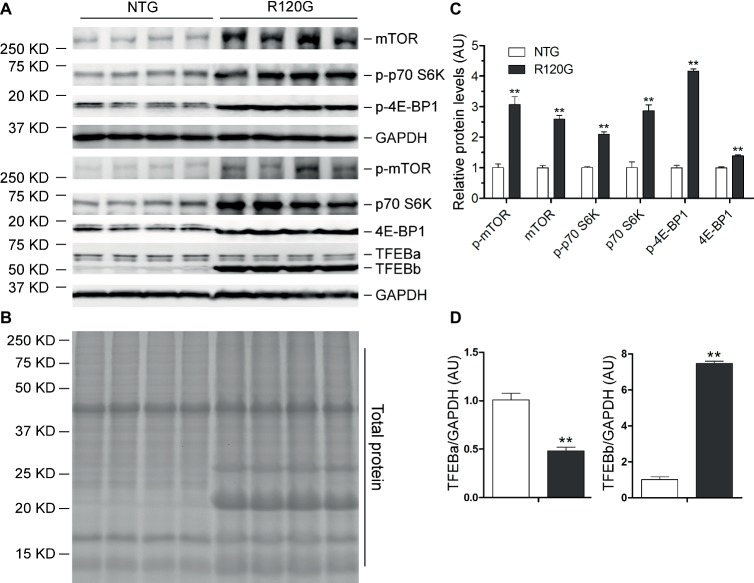
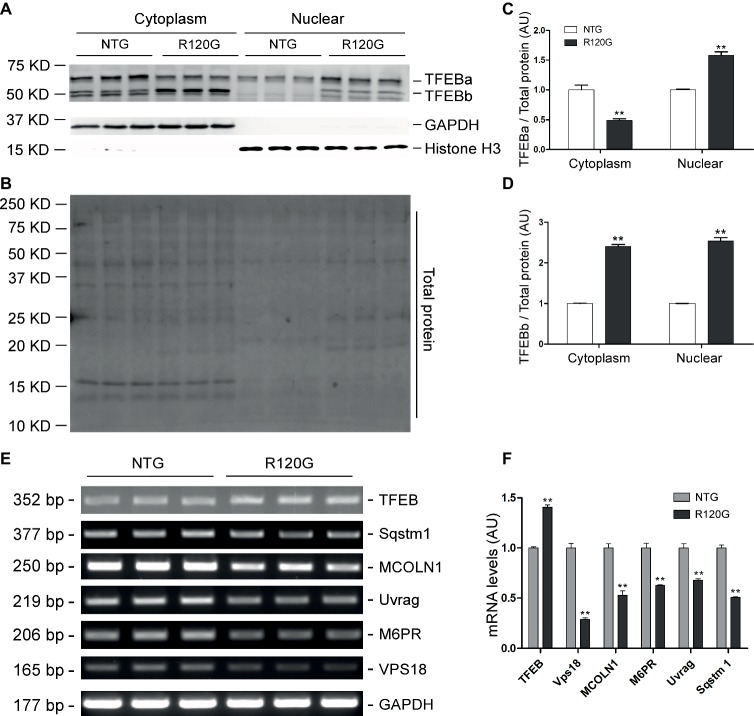
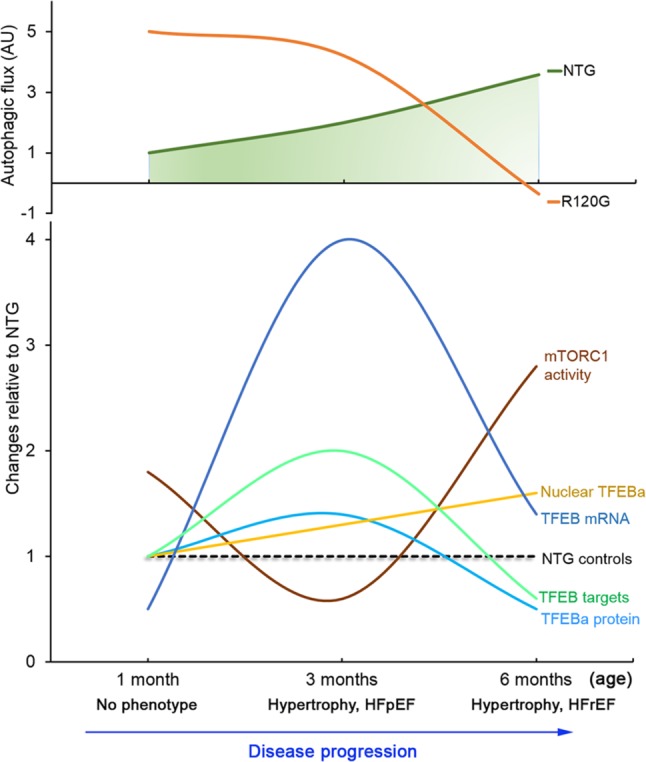
Macroautophagy (referred to as autophagy hereafter) plays an important role in the quality control of cellular proteins and organelles. Transcription Factor EB (TFEB) globally activates the expression of genes in the autophagic-lysosomal pathway (ALP) to replenish lysosomes and ALP machineries. We previously reported that myocardial TFEB signaling was impaired in advanced cardiac proteinopathy; however, myocardial ALP status and TFEB activity at earlier stages of cardiac proteinopathy remain uncharacterized. Here a stable line of CryABR120G transgenic (R120G) and non-transgenic (NTG) littermate mice with cardiomyocyte-restricted overexpression of CryABR120G were used at 1, 3, and 6 months of age. At 1 month when no cardiac phenotypes other than aberrant protein aggregation are discernible, R120G mice displayed a 5-fold increase in myocardial LC3-II flux. Interestingly, the LC3-II flux increase co-existed with increases in mTOR complex 1 (mTORC1) activities as well as cytoplasmic, but not nuclear, TFEB proteins. This increase in cytoplasmic TFEB proteins occurred without any discernible alteration in TFEB activity as reflected by unchanged mRNA levels of representative TFEB target genes (Mcoln1, M6pr, Sqstm1, Vps18, and Uvrag). At 3 months of age when hypertrophy and diastolic malfunction start to develop, the LC3-II flux remained significantly increased but to a lesser degree (2-fold) than at 1 month. The LC3-II flux increase was associated with decreased mTORC1 activities and with increased nuclear TFEB proteins and TFEB activities. At 6 months of age when congestive heart failure is apparent in R120G mice, both LC3-II flux and TFEB activities were severely suppressed, while mTORC1 activity increased. We conclude that changes in both autophagy and TFEB signaling are highly dynamic during the progression of cardiac proteinopathy. Increases in autophagy occur before increases in TFEB activities but both increase in the compensatory stage of cardiac proteinopathy. Once congestive heart failure develops, both autophagy and TFEB signaling become impaired. Our results suggest that TFEB signaling is regulated by both mTORC1-dependent and -independent mechanisms in hearts subjected to increased proteotoxic stress. For therapeutic exploration, it will be important to test the effect of TFEB stimulation at the early, intermediate, and late stages of cardiac proteinopathy.
Keywords: TFEB; mTOR; macroautophagy; mice; proteinopathy; proteotoxicity.
Figures
Similar articles
-
TFEB Dependent Autophagy-Lysosomal Pathway: An Emerging Pharmacological Target in Sepsis.Front Pharmacol. 2021 Nov 26;12:794298. doi: 10.3389/fphar.2021.794298. eCollection 2021. Front Pharmacol. 2021. PMID: 34899355 Free PMC article. Review.
-
TFEB activation protects against cardiac proteotoxicity via increasing autophagic flux.J Mol Cell Cardiol. 2017 Dec;113:51-62. doi: 10.1016/j.yjmcc.2017.10.003. Epub 2017 Oct 7. J Mol Cell Cardiol. 2017. PMID: 28993153 Free PMC article.
-
The Calcineurin-TFEB-p62 Pathway Mediates the Activation of Cardiac Macroautophagy by Proteasomal Malfunction.Circ Res. 2020 Jul 31;127(4):502-518. doi: 10.1161/CIRCRESAHA.119.316007. Epub 2020 May 5. Circ Res. 2020. PMID: 32366200 Free PMC article.
-
Proteasome malfunction activates the PPP3/calcineurin-TFEB-SQSTM1/p62 pathway to induce macroautophagy in the heart.Autophagy. 2020 Nov;16(11):2114-2116. doi: 10.1080/15548627.2020.1816666. Epub 2020 Sep 22. Autophagy. 2020. PMID: 32960686 Free PMC article.
-
Reduce, Reuse, Recycle, Run ! : 4 Rs to improve cardiac health in advanced age.Aging (Albany NY). 2022 Dec 1;14(23):9388-9392. doi: 10.18632/aging.204415. Epub 2022 Dec 1. Aging (Albany NY). 2022. PMID: 36470665 Free PMC article. Review.
Cited by
-
Silencing of circFoxO3 Protects HT22 Cells from Glutamate-Induced Oxidative Injury via Regulating the Mitochondrial Apoptosis Pathway.Cell Mol Neurobiol. 2020 Oct;40(7):1231-1242. doi: 10.1007/s10571-020-00817-2. Epub 2020 Mar 5. Cell Mol Neurobiol. 2020. PMID: 32140899
-
TFEB Dependent Autophagy-Lysosomal Pathway: An Emerging Pharmacological Target in Sepsis.Front Pharmacol. 2021 Nov 26;12:794298. doi: 10.3389/fphar.2021.794298. eCollection 2021. Front Pharmacol. 2021. PMID: 34899355 Free PMC article. Review.
-
Blocking C3d+/GFAP+ A1 Astrocyte Conversion with Semaglutide Attenuates Blood-Brain Barrier Disruption in Mice after Ischemic Stroke.Aging Dis. 2022 Jun 1;13(3):943-959. doi: 10.14336/AD.2021.1029. eCollection 2022 Jun. Aging Dis. 2022. PMID: 35656116 Free PMC article.
-
Ad-VT enhances the sensitivity of chemotherapy-resistant lung adenocarcinoma cells to gemcitabine and paclitaxel in vitro and in vivo.Invest New Drugs. 2022 Apr;40(2):274-289. doi: 10.1007/s10637-021-01204-4. Epub 2022 Jan 4. Invest New Drugs. 2022. PMID: 34981275 Free PMC article.
-
Biologic TNF-α inhibitors reduce microgliosis, neuronal loss, and tau phosphorylation in a transgenic mouse model of tauopathy.J Neuroinflammation. 2021 Dec 31;18(1):312. doi: 10.1186/s12974-021-02332-7. J Neuroinflammation. 2021. PMID: 34972522 Free PMC article.
References
-
- Ahmed M. I., Guichard J. L., Soorappan R. N., Ahmad S., Mariappan N., Litovsky S., et al. . (2016). Disruption of desmin-mitochondrial architecture in patients with regurgitant mitral valves and preserved ventricular function. J. Thorac. Cardiovasc. Surg. 152, 1059.e2–1070.e2. 10.1016/j.jtcvs.2016.06.017, PMID: - DOI - PMC - PubMed
Grants and funding
LinkOut - more resources
Full Text Sources
Molecular Biology Databases
Research Materials
Miscellaneous