. 2019 Jun 25:10:1452.
doi: 10.3389/fimmu.2019.01452. eCollection 2019.

Functional Enrichment and Analysis of Antigen-Specific Memory B Cell Antibody Repertoires in PBMCs

Affiliations

Functional Enrichment and Analysis of Antigen-Specific Memory B Cell Antibody Repertoires in PBMCs

Eric Waltari et al. Front Immunol. .

Abstract

Phenotypic screening of antigen-specific antibodies in human blood is a common diagnostic test for infectious agents and a correlate of protection after vaccination. In addition to long-lived antibody secreting plasma cells residing in the bone marrow, memory B cells are a latent source of antigen-experienced, long-term immunity that can be found at low frequencies in circulating peripheral blood mononuclear cells (PBMCs). Assessing the genotype, clonal frequency, quality, and function of antibodies resulting from an individual's persistent memory B cell repertoire can help inform the success or failure of immune protection. Using in vitro polyclonal stimulation, we functionally expand the memory repertoire from PBMCs and clonally map monoclonal antibodies from this population. We show that combining deep sequencing of stimulated memory B cell repertoires with retrieving single antigen-specific cells is a promising approach in evaluating the latent, functional B cell memory in PBMCs.

Keywords: PBMC; antibody; clonal families; memory B cell; repertoire; sequencing.


Figures

Figure 1
Figure 1
Schematic of the BCR analysis workflow. Raw paired MiSeq reads (300 × 250 bp) are inputted into the Immcantation pipeline. The pRESTO package processes the MiSeq reads and does QC, UMI processing, primer and isotype/subtype annotation and paired read assembly to output annotated sequence lists (.fastq). Change-O next runs the IgBLAST algorithm on all processed Ig sequences, annotating germline information to output tabular files (.tab). TigGER calculates novel germlines, while SHazaM calculates the optimal threshold for clonal clustering. Change-O then clusters the sequences into clones and Alakazam summarizes the outputs in graphical form (.png &.pdf). Throughout the workflow, a Reflow script pieces all of the parts together, delineating outputs and inputs and allowing the pipeline to run in the cloud (using Amazon Web Services).
Figure 2
Figure 2
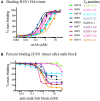
ELISA binding of mAbs to H1N1 HA and functional epitope mapping to the stalk region. (A) Purified recombinant monoclonal antibodies were tested for binding to the H1N1 HA trimer compared to the reference in house synthesized MEDI8852 IgG (shown in dotted black line). Replicate data is plotted as a percentage of the maximum in-assay OD450 signal which was saturated at 50 nM for all IgG. (B) The binding of monoclonal antibodies was measured after blocking the coated HA trimer with increasing concentrations of MEDI8852 Fab. The binding of antibodies INF3, INF7, INF9, and INF11 to the HA trimer were effectively blocked by the Fab fragment of MEDI8852 (Fab blocking the intact MEDI8852 mAb itself is shown in the dotted black line), indicative of common binding of these mAbs to the HA stalk region. In this assay, only INF11 was close to completely blocked at high Fab concentrations. During the 1 h incubation time, higher avidity and affinity IgG (including MEDI8852 IgG) may have reached an equilibrium by displacing bound Fab or by binding to partial epitopes on the trimer independent of the stalk region.
Figure 3
Figure 3
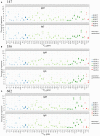
Germline V-gene usage among PBMC and Stimulated PBMC repertoires. Plots show V-gene usage for one replicate of each of the three donor repertoires (A: 147, B: 536, and C: 682) sampled at the August 2018 timepoint, and are separated by isotype, with only IgM and IgG sequences shown. Plots were made using the Alakazam R scripts in the Immcantation pipeline. Corresponding V-gene usage plots for light chains are in Supplementary Image S3.
Figure 4
Figure 4
Heavy chain isotype and subtype usage among PBMC and stimulated PBMC repertoires. Plots show the proportion of heavy chain isotypes for one replicate of each of the three donors (147, 536, and 682) sampled at the August 2018 timepoint. While pie chart numbers show unique Ig sequences found with >2 reads per UMI, the more stringent criteria for enumerating clonal families by V-D-J sequence similarity is also shown (in bold numbers on pie charts). A constant clonal threshold value of 12% was used to assign sequences into clonal families, so data could be compared across samples (see Methods). Plots were made using the Alakazam R scripts in the Immcantation pipeline.
Figure 5
Figure 5
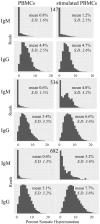
Somatic hypermutation among PBMC and stimulated PBMC repertoires. Plots show distributions of SHM values across all IgM and IgG sequences in PBMC repertoires vs. stimulated PBMC repertoires in one replicate, for each of the three donors (147, 536, and 682) sampled at the August 2018 timepoint. Plots were made using the Alakazam R scripts in the Immcantation pipeline. Since the total number of sequences in each distribution plot are different, to compare across samples, the y-axis were normalized to the maximum number of sequences.
Figure 6
Figure 6
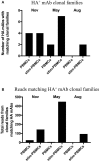
Clonal families of 8 HA+ memory B cell sequences found among PBMC and stimulated PBMC repertoires. (A) Number of mAbs out of the eight HA+ memory B cell sequences found with clonal families in either PBMC repertoires or stimulated PBMC repertoires, for all three timepoints of donor 536. One mAb (INF15) was not found in any of the repertoires. (B) Number of sequences found within these clonal families, in either PBMC repertoires or stimulated PBMC repertoires for all three timepoints of donor 536.
Figure 7
Figure 7
Number of persistent sequences found in all three timepoints in a single donor, among PBMC or stimulated PBMC repertoires. Each column indicates the number of identical heavy chain sequences for IgM (black) or IgG (gray) sequences found across all three timepoints of donor 536, for PBMC or stimulated PBMC. Either total sequences or mutated sequences (>1% SHM) are shown as indicated on the x-axis.
Figure 8
Figure 8
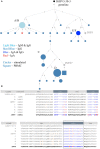
Clonal family lineage of Influenza A HA+ memory B cell mAb INF9. (A) The clonal lineage of mAb INF9 deriving from the germline (IGHV3-30-3) in black, with IgG sequences in steel blue, IgM/IgG sequences (i.e., identical except for constant region) in light blue, IgG/IgA sequences in royal blue, one IgA sequence in red, and reference mAb B cell sequence INF9 shown in gray. White dots indicate putative sequences not found. INF87, found toward the bottom of the lineage and shown in gray, is another memory B cell sequence cloned after HA+ FACS but not tested to confirm HA-binding. The sizes indicate the relative read count per UMI. The sequences in this lineage were pooled from two replicates each of the PBMC and stimulated PBMC repertoires from the May 2018 timepoint of donor 536. Only a single sequence, shown as a square at the bottom of the lineage was derived from the unstimulated PBMC. This sequence was different by two nucleotides but identical at the amino acid level to INF87. The lineage was made using the Alakazam R scripts in the Immcantation pipeline, with a parsimony-based approach. Numbers between sequences indicate mutational steps at the nucleotide level. (B) An amino acid alignment of variable heavy chain sequences selected from the clonal family lineage shown in A. Somatic hypermutation from germline in the CDR1, CDR2, and CDR3 regions are shown in red and in the framework (FR) regions in orange. The reference mAb INF9 is shown on the bottom line, in bold.
Figure 9
Figure 9
Immunodominance plot of the May stimulated PBMC repertoire of donor 536. Clonal families of mAb IGVH sequences were found and plotted onto a heat map made from the total May IGVH clonal repertoire. The number of unique clonal families in the May IGVH repertoire at a given abundance and average SHM is indicated using a color scale, ranging from pinks for >1,000 unique clonal families to blues for <10 unique clonal families. Since the heat map plots all clonal families from the repertoire at a given abundance and average SHM, individual mAb clonal family diversity cannot be interpreted by color. The y-axis shows the average somatic hypermutation of clonal families and the x-axis the abundance of clonal families by number of sequencing reads. Because whole numbers are plotted using a log scale on the x-axis, this gives rise to an appearance of gaps between the lowest values. The plot was made using the Alakazam R scripts in the Immcantation pipeline.

Similar articles

Cited by

References

    1. Sallusto F, Lanzavecchia A, Araki K, Ahmed R. From vaccines to memory and back. Immunity. (2010) 33:451–63. 10.1016/j.immuni.2010.10.008 - DOI - PMC - PubMed
    1. De Silva NS, Klein U. Dynamics of B cells in germinal centres. Nat Rev Immunol. (2015) 15:137–48. 10.1038/nri3804 - DOI - PMC - PubMed
    1. Olson BJ, Matsen FA, IV. The Bayesian optimist's guide to adaptive immune receptor repertoire analysis. Immunol Rev. (2018) 284:148–66. 10.1111/imr.12664 - DOI - PMC - PubMed
    1. Abbas AK, Lichtman AH, Pillai S. Cellular and Molecular Immunology, 9th ed. Philadelphia, PA: Elsevier Health Sciences; (2017). ISBN: 9780323523233.
    1. Yoshida T, Mei H, Dörner T, Hiepe F, Radbruch A, Fillatreau S, et al. . Memory B and memory plasma cells. Immunol Rev. (2010) 237:117–39. 10.1111/j.1600-065X.2010.00938 - DOI - PubMed

Publication types

LinkOut - more resources