. 2019 Jun 25:10:1419.
doi: 10.3389/fimmu.2019.01419. eCollection 2019.

Distinct Spatio-Temporal Dynamics of Tumor-Associated Neutrophils in Small Tumor Lesions

Affiliations

Distinct Spatio-Temporal Dynamics of Tumor-Associated Neutrophils in Small Tumor Lesions

Simon Sody et al. Front Immunol. .

Abstract

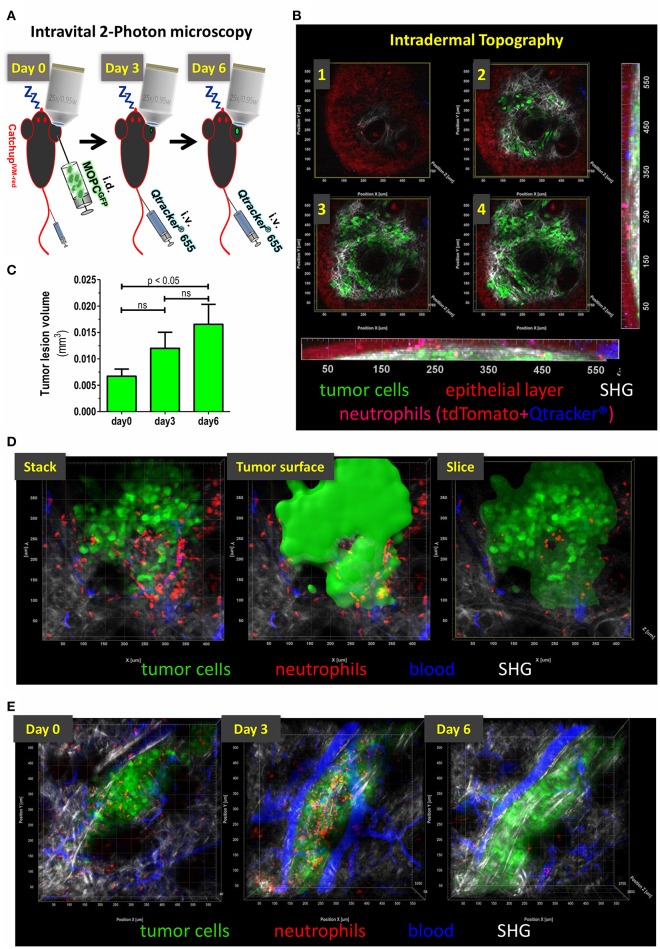
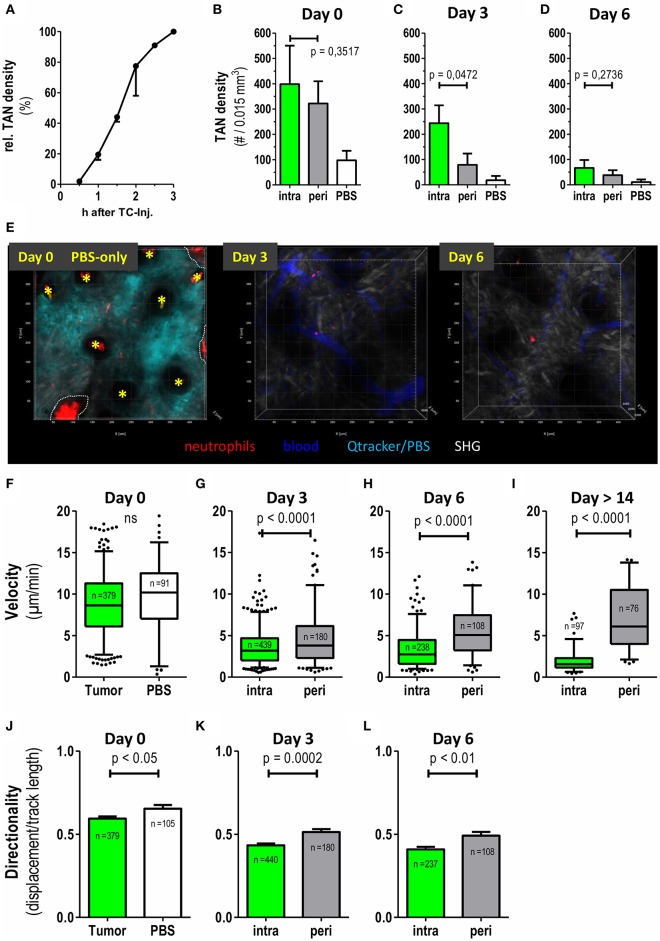
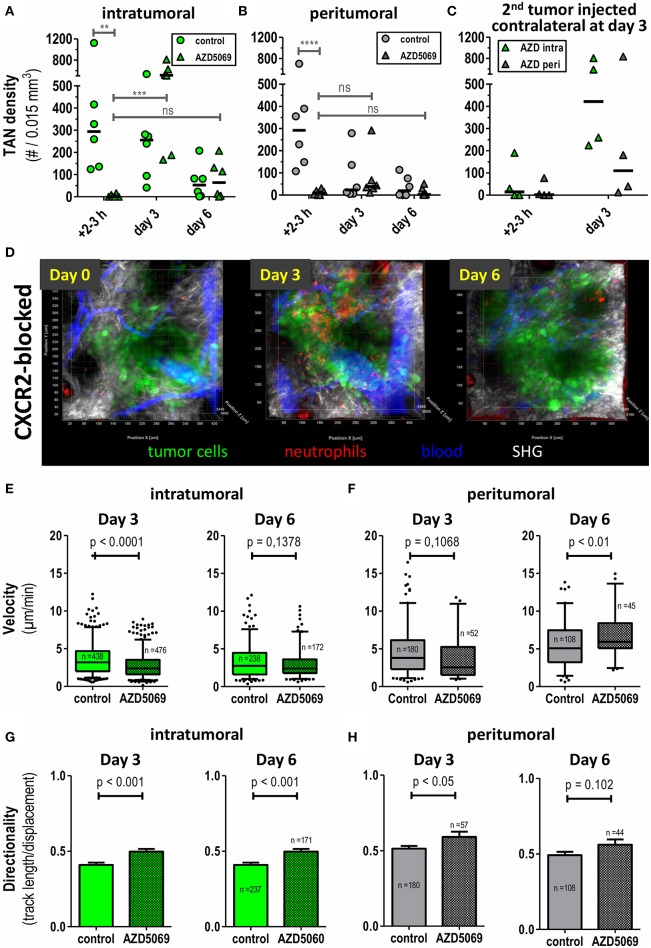
Across a majority of cancer types tumor-associated neutrophils (TAN) are linked with poor prognosis. However, the underlying mechanisms, especially the intratumoral behavior of TAN, are largely unknown. Using intravital multiphoton imaging on a mouse model with neutrophil-specific fluorescence, we measured the migration of TAN in distinct compartments of solid tumor cell lesions in vivo. By longitudinally quantifying the infiltration and persistence of TAN into growing tumors in the same animals, we observed cells that either populated the peripheral stromal zone of the tumor (peritumoral TAN) or infiltrated into the tumor core (intratumoral TAN). Intratumoral TAN showed prolonged tumor-associated persistence and reduced motility compared to peritumoral TAN, whose velocity increased with tumor progression. Selective pharmacological blockade of CXCR2 receptors using AZD5069 profoundly inhibited recruitment of TAN into peritumoral regions, while intratumoral infiltration was only transiently attenuated and rebounded at later time points. Our findings unravel distinct spatial dynamics of TAN that are partially and differentially regulated via the CXCR2 signaling pathway.

Keywords: AZD5069; CXCR2; intravital imaging; multiphoton microscopy; neutrophil granulocytes; tumor immunology; tumor microenvironment; tumor-associated neutrophils.


Figures

Figure 1
Figure 1
Topography of small intradermal lesions of tumor cells. (A) Experimental scheme for longitudinal analysis of spatio-temporal dynamics of TAN. After narcosis CatchupIVM−red mice were intradermally injected with MOPCEGFP cells into the dorsal ear skin (day 0). Directly before imaging Qtracker® vascular label 655 was injected i.v. into the tail vein or retrobulbar to visualize blood vessels. Imaging procedure on the same tumor lesion was repeated on days 3 and 6. (B) Images 1–4 show single cross sections in different depth in a multidimensional 2-Photon stack of an advanced tumor (>day 10). Orthogonal maximum intension projection (MIP) in the x-z-plane (bottom) and y-z-plane (right). Epidermal layer shows a weak autofluorescent signal in the tdTomato emission spectrum (red). Neutrophils show highly fluorescent tdTomato signals and weakly accumulate Qtracker® over time (here 1.5 h post-injection is shown). After fluorescence overlay, neutrophils are displayed in magenta. This enables additional differentiation from autofluorescence by mixed color. Only residual Qtracker® (blue) from leakage or clotting and no blood staining is visible since i.v. injection occurred 1.5 h prior to image acquisition in this case. MOPCEGFP tumor cells are in green. Collagen fibers of the basal membrane and dermal matrix are visualized through SHG signal (white). Image 1 represents the epidermal-basal membrane border. (C) Means (+/– SEM) of tumor lesion volumes at different time points after tumor cell injection. Day 0 = 120–180 min after tumor cell injection. N = 6 animals. (D) Definition of tumoral compartments. Tumor volume was assessed by semi-automated surface generation of tumor cells (solid green). TAN inside tumor surface area were termed “intratumoral,” cells outside were designated as “peritumoral.” Cross-section through tumor volume reveals intra- vs. peritumoral TAN. (E) Intravital multidimensional 2-Photon images of representative tumor cell lesions in MIP from days 0 (120 min after tumor cell injection), 3, and 6 are depicted. 3D reconstruction was performed with Imaris® (Bitplane).
Figure 2
Figure 2
Differential recruitment and migratory patterns of intratumoral vs. peritumoral neutrophils. CatchupIVM−red mice were injected with MOPCEGFP cells into the dorsal ear dermis. TAN infiltration and motility was assessed by transdermal intravital 2PM. (A) Time course of TAN recruitment during the first 3 h after tumor cell inoculation. TAN density at 3 h was defined as 100% (mean with SEM of 2 representative mice is shown). (B–D) Neutrophil densities were quantified in intratumoral (green bars) and peritumoral (gray bars) compartment and after PBS injection only (white bars) at days 0, 3, and 6 and depicted as number of TAN per 0.015 mm3 tumor tissue volume (n = 6 mice for tumor and n = 2 mice for PBS). (E) Representative 2-D still images generated from three-dimensional multiphoton images in maximum intension projection (MIP) demonstrating low neutrophil recruitment and persistence in control CatchupIVM−red mice injected with PBS+Qtracker® at day0. At day 0 the Qtracker dye (+PBS) (cyan) was injected into the ear dermis only. On day 3 and 6 blood vessels were labeled by i.v. Qtracker® (blue) injection. Yellow asterisks mark hair follicles (day 0). Dotted white line indicate areas of invaginated epidermal layer (wrinkle) with high red autofluorescence. Scattered neutrophils are represented by cell-associated red signals in the tissue parenchyma. (F–I) Velocities of neutrophils in the tumor compartments assessed by semi-automated tracking. (J–L) Migration of TAN in (F–H) was also analyzed for directionality (track length/displacement). (F–L) n = 4 for tumor bearing mice, n = 2 for PBS, n = 3 in (I) and cumulative number of analyzed single neutrophils depicted in each plot. Statistical significance was assessed with paired t-test (B–D) and unpaired two-tailed t-test (F–L), α = 0.05. Mean +/– SEM is shown in bar graphs and 5–95% percentiles in boxplots. 3D reconstruction, quantification and tracking were performed with Imaris® (Bitplane).
Figure 3
Figure 3
Intratumoral and peritumoral TAN are differentially affected by CXCR2 blockade to AZD5069 treatment. CatchupIVM−red mice were injected with MOPCEGFP cells into the dorsal ear dermis. TAN infiltration and motility was assessed by transdermal intravital 2PM. To block CXCR2 AZD5069 was orally administered twice daily starting from day−1 before tumor cell inoculation until the end of the experiment. Intratumoral (A) and peritumoral (B) TAN infiltration was quantified as neutrophils per 0.015 mm3. Note the efficient reduction of both intratumoral and peritumoral TAN by AZD5069 at day 0. Also note the rebound of intratumoral, but not peritumoral, TAN under AZD5069 treatment at days 3 and 6. (C) Three days after injection of the primary tumor, AZD5069-treated mice received a second tumor injection into the contralateral ear dermis. TAN density was determined in intra- and peritumoral areas 2–3 h and 3 days after 2nd tumor injection. (D) Intravital multidimensional 2-Photon images of representative tumors of AZD5069 treated mice in maximum intension projection (MIP) on days 0, 3, and 6. Velocities and directionality of intratumoral (E,G) and peritumoral (F,H) TAN in AZD5069-treated compared to control mice were determined on days 3 and 6 by intravital 2PM and semi-automated tracking (pooled data from n = 4 mice per group). Statistical significance of difference was assessed with unpaired two-tailed t-test (α = 0.05). Data in (A–C) are individual mice and the bar represents the median. Data in (E–F) are presented as box-plots with whiskers indicating the 5–95% percentile. In (G–H) barplots of means with SEM. In (A–C) each symbol represents one mouse. **p < 0.01, ***p < 0.001, ****p < 0.0001, ns = p > 0.05. 3D representation, quantification, and tracking were performed with Imaris® (Bitplane).

Similar articles

Cited by

References

    1. Gentles AJ, Newman AM, Liu CL, Bratman SV, Feng W, Kim D, et al. . The prognostic landscape of genes and infiltrating immune cells across human cancers. Nat Med. (2015) 21:938–45. 10.1038/nm.3909 - DOI - PMC - PubMed
    1. Shen M, Hu P, Donskov F, Wang G, Liu Q, Du J. Tumor-associated neutrophils as a new prognostic factor in cancer: a systematic review and meta-analysis. PLoS ONE. (2014) 9:e98259. 10.1371/journal.pone.0098259 - DOI - PMC - PubMed
    1. Trellakis S, Bruderek K, Dumitru CA, Gholaman H, Gu X, Bankfalvi A, et al. . Polymorphonuclear granulocytes in human head and neck cancer: enhanced inflammatory activity, modulation by cancer cells and expansion in advanced disease. Int J Cancer. (2011) 129:2183–93. 10.1002/ijc.25892 - DOI - PubMed
    1. Coffelt SB, Wellenstein MD, de Visser KE. Neutrophils in cancer: neutral no more. Nat Rev Cancer. (2016) 16:431–46. 10.1038/nrc.2016.52 - DOI - PubMed
    1. Deryugina EI, Zajac E, Juncker-Jensen A, Kupriyanova TA, Welter L, Quigley JP. Tissue-infiltrating neutrophils constitute the major in vivo source of angiogenesis-inducing MMP-9 in the tumor microenvironment. Neoplasia. (2014) 16:771–88. 10.1016/j.neo.2014.08.013 - DOI - PMC - PubMed

Publication types

MeSH terms

Substances