

MAP7 and MUCL1 Are Biomarkers of Vitamin D3-Induced Tolerogenic Dendritic Cells in Multiple Sclerosis Patients
- PMID: 31293564
- PMCID: PMC6598738
- DOI: 10.3389/fimmu.2019.01251
MAP7 and MUCL1 Are Biomarkers of Vitamin D3-Induced Tolerogenic Dendritic Cells in Multiple Sclerosis Patients
Abstract
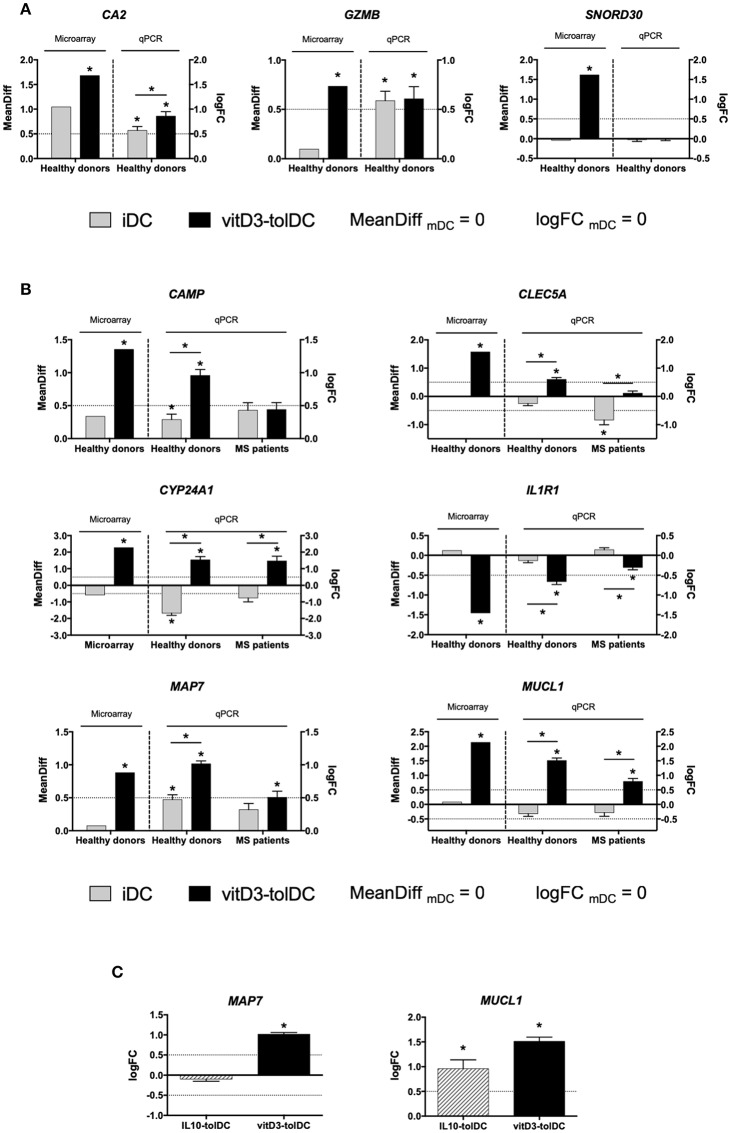
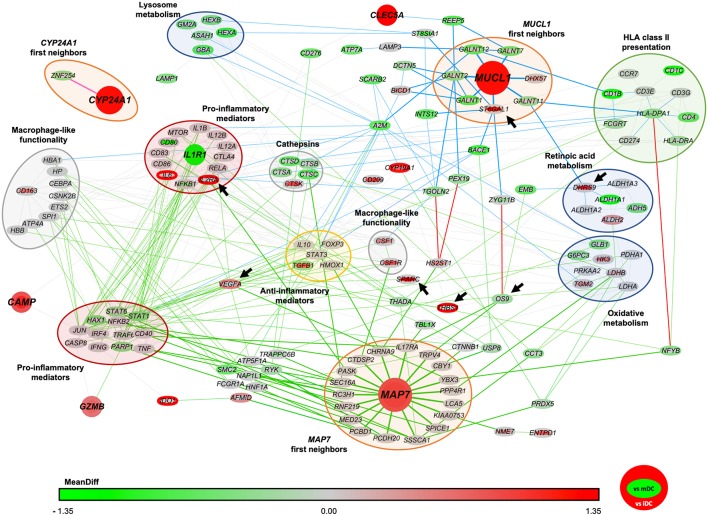
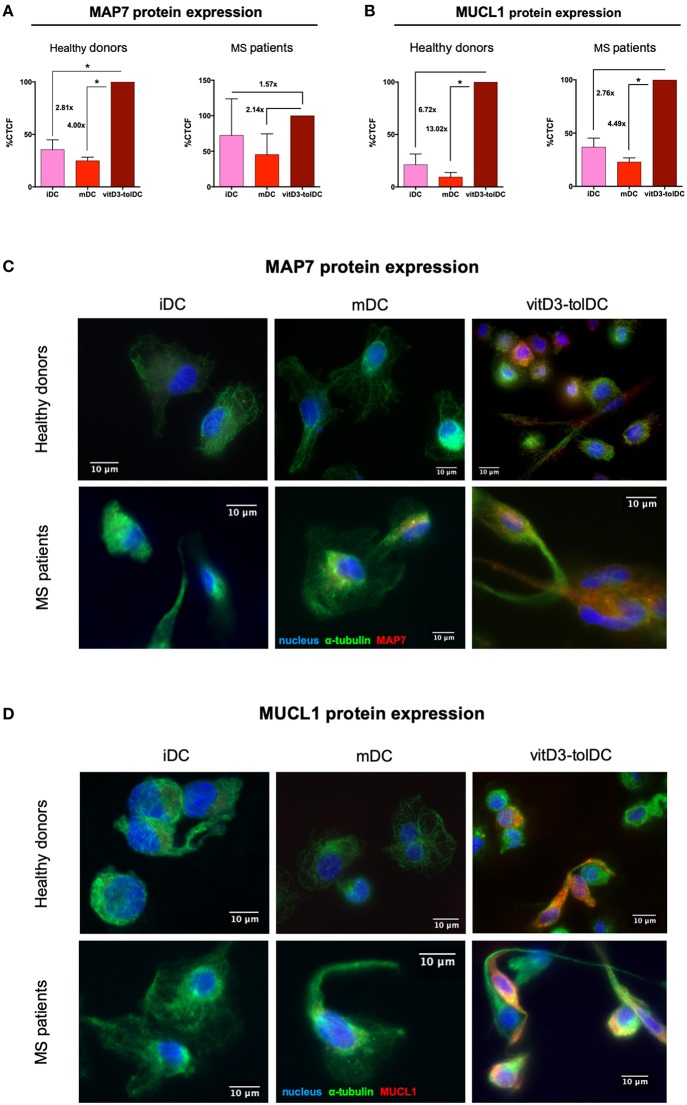
The administration of autologous tolerogenic dendritic cells (tolDC) has become a promising alternative for the treatment of autoimmune diseases, such as multiple sclerosis (MS). Specifically, the use of vitamin D3 for the generation of tolDC (vitD3-tolDC) constitutes one of the most widely studied approaches, as it has evidenced significant immune regulatory properties, both in vitro and in vivo. In this article, we generated human vitD3-tolDC from monocytes from healthy donors and MS patients, characterized in both cases by a semi-mature phenotype, secretion of IL-10 and inhibition of allogeneic lymphocyte proliferation. Additionally, we studied their transcriptomic profile and selected a number of differentially expressed genes compared to control mature and immature dendritic cells for their analysis. Among them, qPCR results validated CYP24A1, MAP7 and MUCL1 genes as biomarkers of vitD3-tolDC in both healthy donors and MS patients. Furthermore, we constructed a network of protein interactions based on the literature, which manifested that MAP7 and MUCL1 genes are both closely connected between them and involved in immune-related functions. In conclusion, this study evidences that MAP7 and MUCL1 constitute robust and potentially functional biomarkers of the generation of vitD3-tolDC, opening the window for their use as quality controls in clinical trials for MS.
Keywords: biomarkers; immune tolerance; multiple sclerosis; tolerogenic dendritic cells; vitamin D3.
Figures
Similar articles
-
Transfection of Vitamin D3-Induced Tolerogenic Dendritic Cells for the Silencing of Potential Tolerogenic Genes. Identification of CSF1R-CSF1 Signaling as a Glycolytic Regulator.Int J Mol Sci. 2021 Jul 8;22(14):7363. doi: 10.3390/ijms22147363. Int J Mol Sci. 2021. PMID: 34298983 Free PMC article.
-
Comparative transcriptomic profile of tolerogenic dendritic cells differentiated with vitamin D3, dexamethasone and rapamycin.Sci Rep. 2018 Oct 8;8(1):14985. doi: 10.1038/s41598-018-33248-7. Sci Rep. 2018. PMID: 30297862 Free PMC article.
-
Vitamin D3-Induced Tolerogenic Dendritic Cells Modulate the Transcriptomic Profile of T CD4+ Cells Towards a Functional Hyporesponsiveness.Front Immunol. 2021 Jan 20;11:599623. doi: 10.3389/fimmu.2020.599623. eCollection 2020. Front Immunol. 2021. PMID: 33552054 Free PMC article.
-
Searching for the Transcriptomic Signature of Immune Tolerance Induction-Biomarkers of Safety and Functionality for Tolerogenic Dendritic Cells and Regulatory Macrophages.Front Immunol. 2018 Sep 19;9:2062. doi: 10.3389/fimmu.2018.02062. eCollection 2018. Front Immunol. 2018. PMID: 30298066 Free PMC article. Review.
-
Developing tolerogenic dendritic cell therapy for rheumatoid arthritis: what can we learn from mouse models?Ann Rheum Dis. 2011 Sep;70(9):1526-33. doi: 10.1136/ard.2011.151654. Ann Rheum Dis. 2011. PMID: 21804099 Review.
Cited by
-
Current Paradigms of Tolerogenic Dendritic Cells and Clinical Implications for Systemic Lupus Erythematosus.Cells. 2019 Oct 21;8(10):1291. doi: 10.3390/cells8101291. Cells. 2019. PMID: 31640263 Free PMC article. Review.
-
Tolerogenic dendritic cell reporting: Has a minimum information model made a difference?PeerJ. 2023 May 31;11:e15352. doi: 10.7717/peerj.15352. eCollection 2023. PeerJ. 2023. PMID: 37273539 Free PMC article.
-
Dendritic Cells: Versatile Players in Renal Transplantation.Front Immunol. 2021 May 19;12:654540. doi: 10.3389/fimmu.2021.654540. eCollection 2021. Front Immunol. 2021. PMID: 34093544 Free PMC article. Review.
-
Paving the way towards an effective treatment for multiple sclerosis: advances in cell therapy.Cell Mol Immunol. 2021 Jun;18(6):1353-1374. doi: 10.1038/s41423-020-00618-z. Epub 2021 May 6. Cell Mol Immunol. 2021. PMID: 33958746 Free PMC article. Review.
-
Transfection of Vitamin D3-Induced Tolerogenic Dendritic Cells for the Silencing of Potential Tolerogenic Genes. Identification of CSF1R-CSF1 Signaling as a Glycolytic Regulator.Int J Mol Sci. 2021 Jul 8;22(14):7363. doi: 10.3390/ijms22147363. Int J Mol Sci. 2021. PMID: 34298983 Free PMC article.
References
Publication types
MeSH terms
Substances
LinkOut - more resources
Full Text Sources
Medical