. 2019 Jul 8;9(1):9806.
doi: 10.1038/s41598-019-46082-2.

Amino-acid inserts of HIV-1 capsid (CA) induce CA degradation and abrogate viral infectivity: Insights for the dynamics and mechanisms of HIV-1 CA decomposition

Affiliations

Amino-acid inserts of HIV-1 capsid (CA) induce CA degradation and abrogate viral infectivity: Insights for the dynamics and mechanisms of HIV-1 CA decomposition

Masayuki Amano et al. Sci Rep. .

Abstract

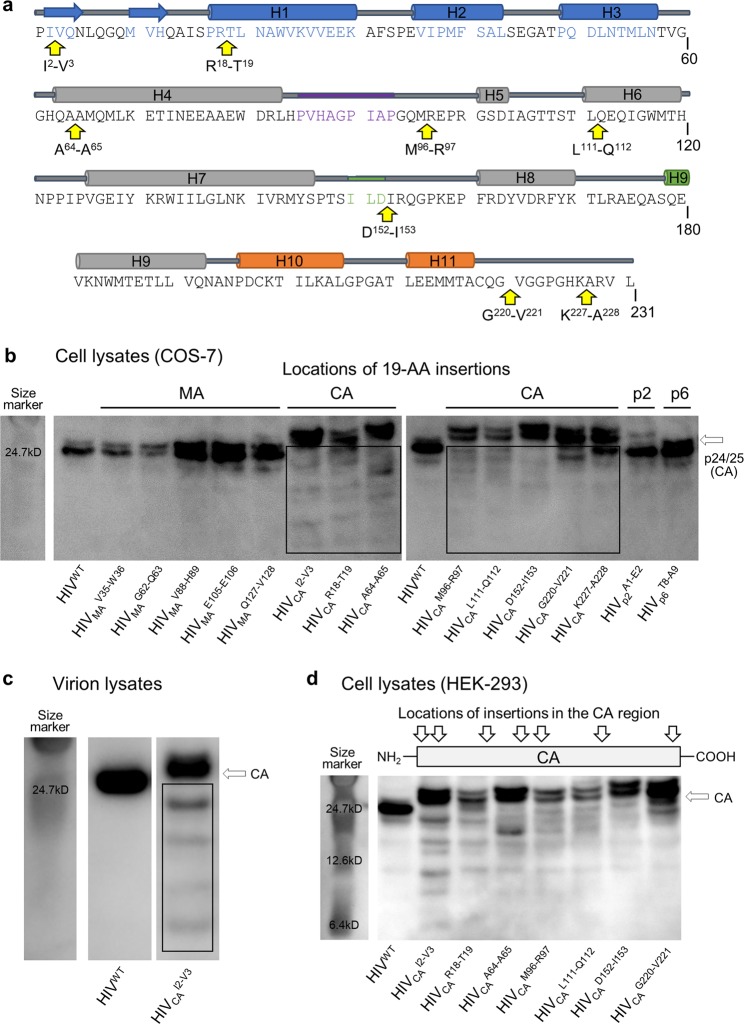
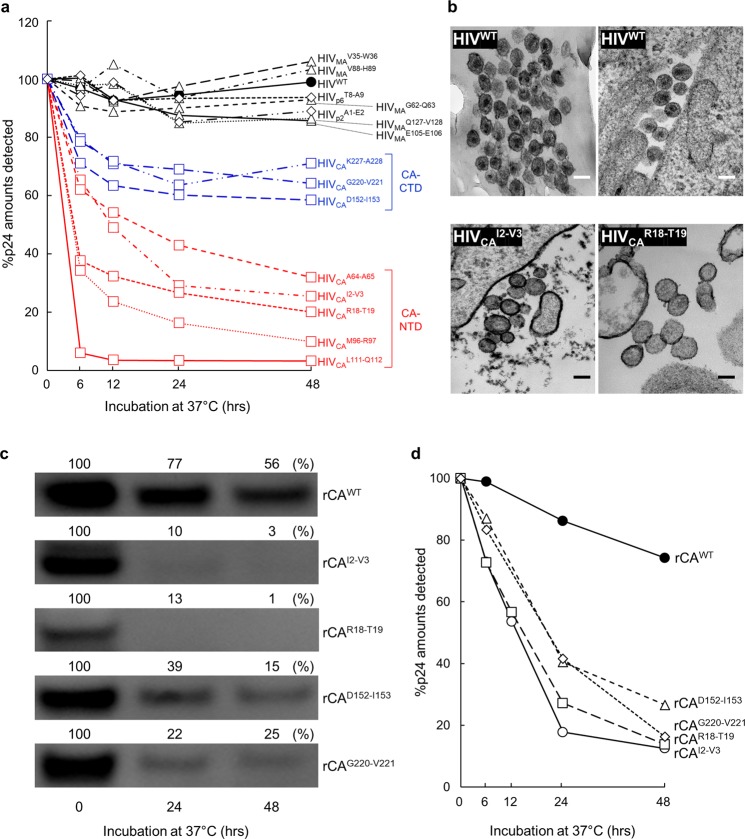
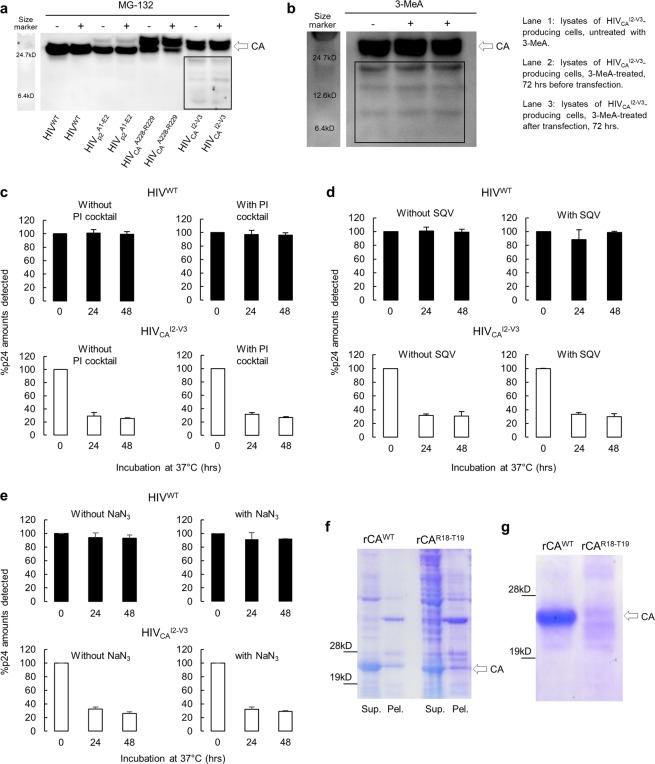
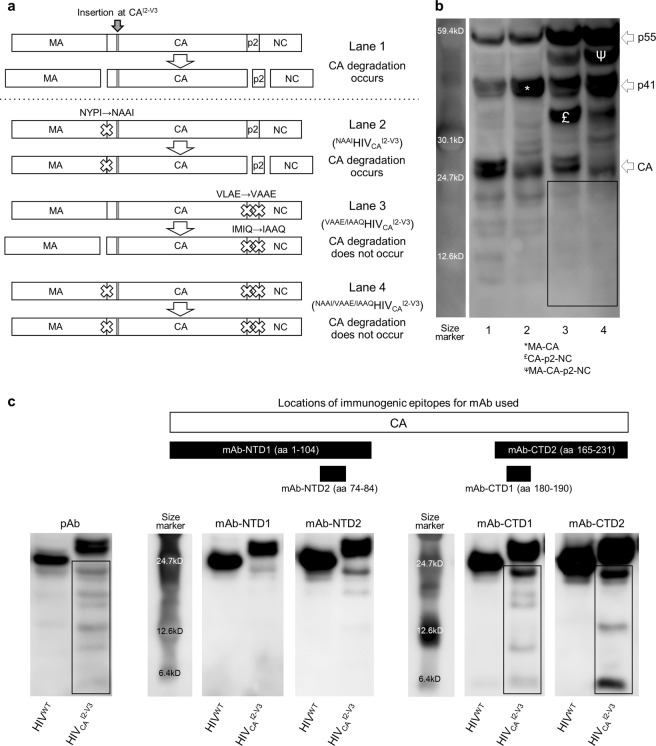
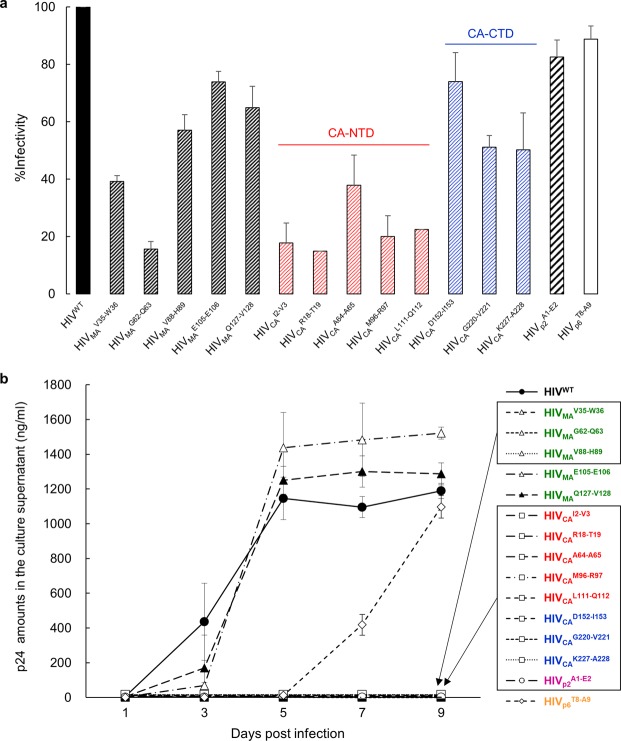
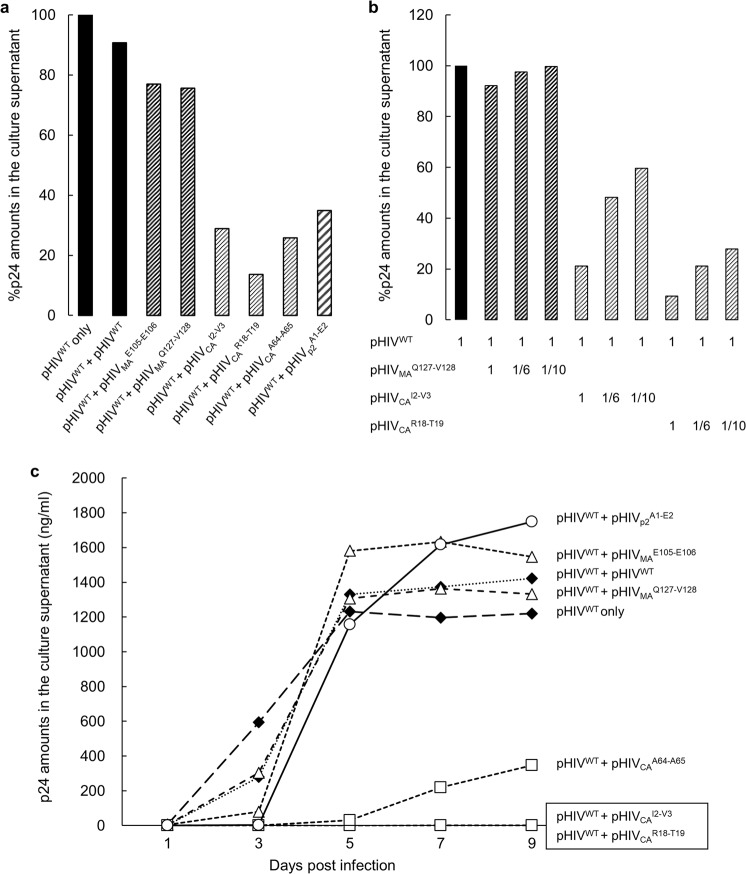
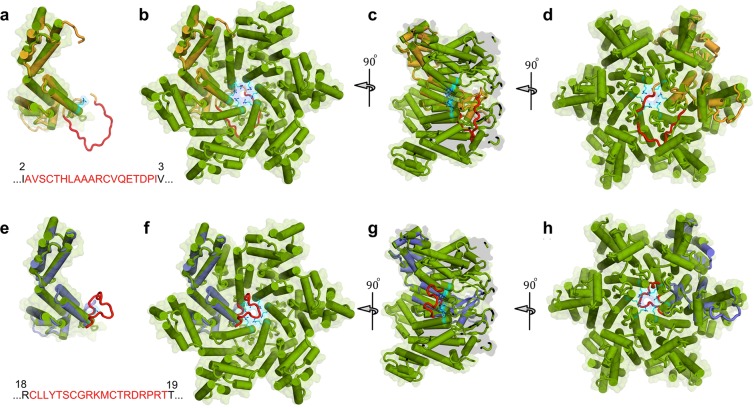
Accumulation of amino acid (AA) insertions/substitutions are observed in the Gag-protein of HIV-1 variants resistant to HIV-1 protease inhibitors. Here, we found that HIV-1 carrying AA insertions in capsid protein (CA) undergoes aberrant CA degradation. When we generated recombinant HIV-1s (rHIV-1s) containing 19-AAs in Gag, such insertions caused significant CA degradation, which initiated in CA's C-terminal. Such rHIV-1s had remarkable morphological abnormality, decreased infectivity, and no replicative ability, which correlated with levels of CA degradation. The CA degradation observed was energy-independent and had no association with cellular/viral proteolytic mechanisms, suggesting that the CA degradation occurs due to conformational/structural incompatibility caused by the 19-AA insertions. The incorporation of degradation-prone CA into the wild-type CA resulted in significant disruption of replication competence in "chimeric" virions. The data should allow better understanding of the dynamics and mechanisms of CA decomposition/degradation and retroviral uncoating, which may lead to new approach for antiretroviral modalities.


Conflict of interest statement

The authors declare no competing interests.

Figures

Figure 1
Figure 1
CA degradation observed in HIV-1 variants with the AA insertion in Gag region. (a) Locations of each 19-AA insertion in CA of HIVTP clones generated by using the Tn5-based transposon system are shown. The sequence of wild-type CA (CAWT) is shown with its secondary structure diagram. HIV-1 CA consists of the N-terminal domain (NTD; residues 1–145) and the C-terminal domain (CTD; residues 151–231) connected by 5 AAs that act as a flexible linker. Each insertion site is indicated by yellow arrow. The hexamer structure is stabilized by interactions formed by s hairpin and first 3 helices H1, H2, H3 as shown in blue. Two- and three-fold interactions take place between hexamer units are shown in green and orange, respectively. Cyclophilin A-binding site is indicated in purple. (b) CA degradation in the lysates of COS-7 cells producing various 19-AAs-containing HIV clones (HIVTPs). The lysates of COS-7 cells producing HIVWT or HIVTPs were examined for enhanced degradation. Each lysate sample was prepared 72 hrs after transfection and subjected to WB with anti-p24 polyclonal anti-serum. The boxes indicate lower-molecular-weight CA degradation products than the mature p24/p25 (CA). Results shown is representative of more than ten independent experiments. (c) The CA degradation products are identified in the lysates of HIVCAI2-V3. The supernatants of COS-7 cells producing HIVWT or HIVCAI2-V3 were collected 72 hrs after transfection, cleaned with 0.22 μm pore size filters, and subjected to ultracentrifugation (20,000 g, 4 °C, 24 hrs). The obtained virions were lysed and was subjected to WB. Results shown is representative of three independent experiments. (d) The lysates of HEK-293 cells producing HIVWT or HIVTPs showed the similar degradation products as seen in the COS-7 cell lysates as above. All samples in (bd) were normalized by their protein concentrations (20 μg/well). Results shown is representative of seven independent experiments. Full-length blots/gels are presented in Fig. S9.
Figure 2
Figure 2
Time-dependent progression of the CA degradation in HIVTPs and recombinant CA-containing 19-AA insert. (a) Cell lysates of HIVWT- or various HIVTP-producing COS-7 cells were incubated at 37 °C for different periods of time, and the CA concentration of each sample was determined using ELISA. The sample at time 0 was stored at −80 °C immediately following the cell lysate preparation. “Percent p24 (CA)” was determined using equation described in the Methods section. Note that the lysates of COS-7 cells producing a panel of HIV-1-containing the 19-AAs in CA-NTD most rapidly lost CA, followed by the cells producing HIV-1 with the insert in CA-CTD. The data shown represent mean values derived from the results of two independent experiments. (b) Morphology of HIVCAI2-V3 and HIVCAR18-T19. HIVWT, HIVCAI2-V3 and HIVCAR18-T19 producing transfected COS-7 cells were subjected TEM study, as described in the Methods section. Note that HIVWT virions had the typically-condensed mature core, while the cores within HIVCAI2-V3 and HIVCAR18-T19 are much less condensed or absent. The frequency of mature and aberrant cores are 75.7% (56/74) and 24.3% (18/74) for HIVWT virions; 25.2% (27/107) and 74.8% (80/107) for HIVCAI2-V3 virions; 8.7% (2/23) and 91.3% (21/23) for HIVCAR18-T19 virions, respectively. Scale bars: 100 nm. (c) Various recombinant CAs such as wild-type HIV-1 CA (rCAWT) and the 19-AAs-containing CAs (rCAI2-V3, rCAR18-T19, rCAD152-I153, and rCAG220-V221) were expressed in COS-7 cells, the lysates of the cells incubated at 37 °C, subjected to WB using anti-p24 anti-serum, and the signal densities of rCAs quantified using the NIH Image J Program. Percent p24 (CA) was determined using equation described in the Methods section. The unincubated samples (0 hr) were normalized by their p24 concentrations (5 ng/well). 24 hrs and 48 hrs incubated samples were applied as same volumes as each unincubated (0 hr) sample. Results shown is representative of two independent experiments. (d) The same samples as in panel c were subjected to ELISA. Note that all the 19-AAs-containing CAs examined rapidly lost the immunogenicity as compared with rCAWT. Results shown is representative of two independent experiments. Full-length blots/gels are presented in Fig. S9.
Figure 3
Figure 3
The CA degradation observed has no association with cellular/viral proteolytic mechanisms. (a–d) MG-132, an inhibitor of proteasome; 3-MeA, an autophagy inhibitor; a mixture of 7 potent cellular protease inhibitors; and SQV, a potent HIV-1-derived aspartyl protease failed to block CA degradation. (a) The lysates of COS-7 cells producing HIVWT or HIVTPs were prepared 72 hrs after transfection and subjected to WB with anti-p24 polyclonal antibody. MG-132 was added to transfection medium with 20 μM concentration at 6 hrs before harvest. Results shown is representative of four independent experiments. (b) The lysates of HEK-293 cells producing HIVWT or HIVTPCAI2-V3 were prepared 72 hrs after transfection and subjected to WB with anti-p24 polyclonal antibody. HEK-293 cells were incubated for 5 hrs with 5 mM of 3-MeA and were washed just before transfection (lane 2) or were incubated with 3-MeA for 72 hrs after transfection (lane 3). Results shown is representative of two independent experiments. All samples in (a) or (b) were normalized by their protein concentrations, 30 or 20 μg/well, respectively. (c,d) The lysates of COS-7 cells producing HIVWT or HIVTPCAI2-V3 were prepared 72 hrs after transfection with lysis buffer-containing the PI cocktail or 1 μM of SQV. Data are represented as mean ± S.D. of two independent experiments. (e) The lysates of COS-7 cells producing HIVWT or HIVCAI2-V3 were prepared with lysing buffer-containing 13.4 mM of sodium azide, incubated at 37 °C for different periods of time indicated and subjected to ELISA. Note that the presence of a high concentration of sodium azide did not block the CA degradation, suggesting that the degradation event is ATP-independent process. Data are represented as mean ± S.D. of two independent experiments. (f) rCAWT and rCAR18-T19 produced by E. coli staining with Coomassie Brilliant Blue (CBB) are shown. rCAWT and rCAR18-T19 were expressed in E. coli and each cultured cell preparation was lysed and ammonium-sulfate-precipitated. Subsequently, the lysed samples and ammonium-sulfate-precipitates were subjected to SDS-PAGE and CBB staining. (g) The ammonium-sulfate-precipitates of the rCAWT and rCAR18-T19 samples described above were run through size-exclusion-chromatography and the fractions-containing rCAWT and rCAR18-T19 were subjected to SDS-PAGE and CBB staining. Results shown is representative of two independent experiments. Full-length blots/gels are presented in Fig. S9.
Figure 4
Figure 4
The degradation of mutant CAs requires the CA’s C-terminal cleavage and originates from the CA-CTD. (a) A genetic map of the three following HIVCAI2-V3-based constructs lacking the cleavage(s) of Gag polyproteins generated: (i) a construct, in which the MA-CA cleavage of HIVCAI2-V3 was blocked by changing the cleavage site “NYPI” to “NAAI” (thus referred to NAAIHIVCAI2-V3), (ii) a construct, in which the CA-p2 and p2-NC cleavages were blocked by changing the two cleavage sites “VLAE” and “IMIQ” to “VAAE” and “IAAQ”, respectively (VAAE/IAAQHIVCAI2-V3), and (iii) a construct, in which all the three cleavages were blocked (NAAI/VAAE/IAAQHIVCAI2-V3). (b) Reduced degradation in VAAE/IAAQHIVCAI2-V3 and NAAI/VAAE/IAAQHIVCAI2-V3. The lysates of COS-7 cells producing HIVCAI2-V3 (Lane 1), NAAIHIVCAI2-V3 (Lane 2), VAAE/IAAQHIVCAI2-V3 (Lane 3), or NAAI/VAAE/IAAQHIVCAI2-V3 (Lane 4) were subjected to WB using anti-p24 anti-serum. CA degradation was clearly seen in Lanes 1 and 2, while the degradation levels in Lanes 3 and 4 were drastically reduced, indicating that the blockade of cleavages in the CA-p2-NC cleavage sites resulted in reduction of the CA degradation. (c) The CAI2-V3 degradation products are derived from the CTD of CAI2-V3. The lysates of HEK-293 cells producing HIVCAI2-V3 were subjected to WB using two monoclonal antibodies specific to the CA-NTD (mAb-NTD1 and mAb-NTD2), and two monoclonal antibodies specific to the CA-CTD (mAb-CTD1 and mAb-CTD2). The locations of each immunogen recognized are shown in the top of Panel c. Note that the ladder-like signals were identified only in the lysates examined with the two CA-CTD-specific mAbs. All samples in (b,c) were normalized by their protein concentrations (20 μg/well). Results shown is representative of three to five independent experiments for each mAb. Full-length blots/gels are presented in Fig. S9.
Figure 5
Figure 5
Degradation-prone HIVTP-CAINS variants are replication-incompetent. (a) The infectivity of each of HIVTP-CAINSNTDs (shown in red) and HIVTP-CAINSCTDs (in blue) was determined with the single-round infectivity assay using U373-MagiCD4+CXCR4+ cells. Note that the infectivity of HIVTP-CAINSs was substantially reduced, while that of three HIVTP-MAINSs (HIVMAV35-W36, HIVMAG62-Q63, and HIVMAV88-H89) were also substantially reduced. Data are represented as mean ± S.D. (n = 3). (b) Loss of replication capacity of HIVTP-CAINSNTDs (in red) and HIVTP-CAINSCTDs (in blue). Replication kinetics of HIVTP-CAINSs was determined with the amounts of p24 production in cultures of MT-4 cells exposed to each HIVTP. The boxes denote that all HIVTP-CAINSs examined completely failed to replicate in MT-4 cells, while the three HIVTP-MAINS (in green) described above and HIVp2A1-E2 (in purple) also failed to replicate. HIVp6T8-A9 (in orange) showed slower replication in MT-4 cells compared to HIVWT. Data are represented as mean ± S.D. (n = 2).
Figure 6
Figure 6
Co-expression of pHIVWT and pHIVTP-CAINSNTD produces highly compromised or replication-incompetent HIV-1. (a) HEK-293 cells were transfected with pHIVWT alone, pHIVWT plus pHIVWT, pHIVMAE105-E106, pHIVMAQ127-V128, pHIVCAI2-V3, pHIVCAR18-T19, pHIVCAA64-A65 or pHIVp2A1-E2, cultured for 72 hrs, and the p24 amounts of each culture supernatant were determined. Note that when co-transfected with pHIVWT and either of 3 pHIVTP-CAINSNTD (pHIVCAI2-V3, pHIVCAR18-T19, pHIVCAA64-A65) and pHIVp2A1-E2, p24 production was drastically reduced as compared when transfected with pHIVWT and pHIVWT plus pHIVWT. (b) HEK-293 cells were transfected with pHIVWT alone, co-transfected with 1:1, 1:1/6, and 1:1/10 ratios of pHIVWT and pHIVp17Q127-V128, pHIVCAI2-V3, or pHIVCAR18-T19, cultured for 72 hrs, and the p24 amounts of each culture supernatant were determined. Results shown is representative of three independent experiments. (c) The supernatants harvested from each of the cultures described in Panel a were subjected to 9-day HIV-1 replication assays using MT-4 cells as target cells, after all the supernatants were normalized to contain an equal amount of p24. Note that the supernatants from transfection with pHIVWT alone or pHIVWT plus pHIVWT, pHIVp2A1-E2, pHIVMAE105-E106, or pHIVMAQ127-V128 produced large amounts of p24 over the 9-day culture period, while those from transfection with pHIVWT plus either of the three pHIVTP-CAINSNTD (pHIVCAI2-V3, pHIVCAR18-T19, pHIVCAA64-A65) produced no or least p24 protein. All p24 values are single-point determinations.
Figure 7
Figure 7
Modeling study of the mechanism of the CA degradation. The 19-AA inserts are indicated by red color for both CAI2-V3 and CAR18-T19. On the upper panel, the model of CAI2-V3 in orange are superimposed into the monomer (a) and the hexamer (b–d) forms of the CAWT structure (PDB ID: 5HGL). Similarly, lower panel dedicated to the structural comparison of the CAR18-T19 model colored in purple with the CAWT monomer (e) as well as the hexamer form (f–h) structures. Hexamers are shown from top views (b,f), 90°-rotated side views (c,g), and 180°-rotated views (d,h). Note that the presence of 19-AA inserts let to formation of extended loops, which wrap around the CA pore composed of 6 arginine residues (shown in cyan). It is assumed that the extended loops are likely to push each monomer apart and effectively block the formation of physiologic hexamer complexes.

Similar articles

Cited by

References

    1. Department of Health and Human Services. Panel on Antiretroviral Guidelines for Adults and Adolescents. Guidelines for the use of antiretroviral agents in HIV-1-infected adults and adolescents. (2106).
    1. Yeni PG, et al. Antiretroviral treatment for adult HIV infection in 2002: updated recommendationsof the International AIDS Society-USA Panel. JAMA. 2002;288:222–235. doi: 10.1001/jama.288.2.222. - DOI - PubMed
    1. Grabar S, et al. Factors associated with clinical and virological failure in patients receiving a triple therapy including a protease inhibitor. AIDS. 2000;14:141–149. doi: 10.1097/00002030-200001280-00009. - DOI - PubMed
    1. Mitsuya, H. & Erickson, J. W. In Textbook Of AIDS Medicine. (eds Merigan, T. C., Bartlet, J. G. & Bolognes, D.), 751–780 (The Williams & Wilkins Co., Baltimore, Md., 1999).
    1. Paredes R, et al. Predictors of Virological Success and Ensuing Failure in HIV-Positive Patients Starting Highly Active Antiretroviral Therapy in Europe. Arch. Intern. Med. 2000;160:1123–1132. doi: 10.1001/archinte.160.8.1123. - DOI - PubMed

Publication types

Substances

LinkOut - more resources