. 2019 Jul 3;10(1):2950.
doi: 10.1038/s41467-019-10755-3.

PRC1 collaborates with SMCHD1 to fold the X-chromosome and spread Xist RNA between chromosome compartments

Affiliations

PRC1 collaborates with SMCHD1 to fold the X-chromosome and spread Xist RNA between chromosome compartments

Chen-Yu Wang et al. Nat Commun. .

Abstract

X-chromosome inactivation triggers fusion of A/B compartments to inactive X (Xi)-specific structures known as S1 and S2 compartments. SMCHD1 then merges S1/S2s to form the Xi super-structure. Here, we ask how S1/S2 compartments form and reveal that Xist RNA drives their formation via recruitment of Polycomb repressive complex 1 (PRC1). Ablating Smchd1 in post-XCI cells unveils S1/S2 structures. Loss of SMCHD1 leads to trapping Xist in the S1 compartment, impairing RNA spreading into S2. On the other hand, depleting Xist, PRC1, or HNRNPK precludes re-emergence of S1/S2 structures, and loss of S1/S2 compartments paradoxically strengthens the partition between Xi megadomains. Finally, Xi-reactivation in post-XCI cells can be enhanced by depleting both SMCHD1 and DNA methylation. We conclude that Xist, PRC1, and SMCHD1 collaborate in an obligatory, sequential manner to partition, fuse, and direct self-association of Xi compartments required for proper spreading of Xist RNA.


Conflict of interest statement

J.T.L. is a co-founder of and a scientific advisor for Translate Bio and Fulcrum Therapeutics. The other authors declare no competing interests.

Figures
Fig. 1
Fig. 1
Depleting structural maintenance of chromosomes hinge domain containing 1 (SMCHD1) leads to reappearance of S1/S2 compartments in post-X-chromosome inactivation (XCI) cells. a Depth-corrected chromatin interaction maps of the inactive X chromosome (Xi) in wild-type (WT) and Smchd1−/− mouse embryonic fibroblasts (MEFs) binned at 200-kb resolution. Gray-shaded areas, unmappable regions. Also see Supplementary Fig. 2a for the active X chromosome (Xa) maps. b The corresponding Pearson’s correlation maps of the Xi in WT and Smchd1−/− MEFs binned at 200-kb resolution. Also see Supplementary Fig. 2a for the Xa maps. c Principal component 1 (PC1) and PC2 values of the Xi in WT and Smchd1−/− MEFs. Regions with positive PC1 values on the Smchd1−/− Xi represent the S1 (Xist-rich) compartment (red). Also shown are Xi-specific H3K4me3 chromatin immunoprecipitation followed by deep sequencing (ChIP-seq) peaks (Xmus, GSE33823), Xist CHART-seq (capture hybridization analysis of RNA targets with deep sequencing) (GSE48649), H3K27me3 ChIP-seq (GSE33823), H2AK119ub ChIP-seq (GSE107217), and SMCHD1 DNA adenine methyltransferase identification by sequencing (DamID-seq) (GSE99991) profiles in WT MEFs. Xist, H3K27me3, and H2AK119ub profiles were displayed as heatmaps, with scale bars shown below the tracks. Also see Supplementary Fig. 2b for the PCs of the Xa. d PC1 values of the Xi in Smchd1−/− MEFs and embryoid bodies formed after 4 days of differentiation of female WT mouse embryonic stem cells (D4 EB, early XCI) (GSE99991). Regions with positive PC1 values represent the S1 (Xist-rich) compartment (red). e Comparison of the compartment profile (PC1) (top) of the Smchd1−/− Xi and the topologically associated domain (TAD) insulation profiles (bottom) of the WT (black) and Smchd1−/− Xi (red) at two representative X-linked regions. TADs (as defined in Dixon et al.) were depicted as blue bars between plots and as dashed lines (TAD boundaries) within each plot. Green dashed lines, the borders of S1/S2 compartments. Yellow-shaded area: Dxz4. Gray-shaded areas, unmappable regions. f Box plots comparing the insulation scores of the TAD boundaries associated with borders of S1/S2 compartments (green) and the other TAD boundaries (gray) on the Xi. Note that lower insulation scores indicate stronger insulation effects. P values are given by the Wilcoxon’s rank-sum test. NS, not significant (P > 0.05). *P = 0.0018; **P = 0.0015. Midline, median. Top and bottom of the box, first and third quartile. Whiskers, extension from the top or bottom to the furthest datum within 1.5 times the interquartile range
Fig. 2
Fig. 2
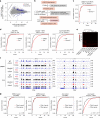
Structural maintenance of chromosomes hinge domain containing 1 (SMCHD1) and DNA methylation synergistically maintain inactive X chromosome (Xi) silencing. a An RNA-sequencing (RNA-seq) MA plot comparing the gene expression profiles of wild-type (WT) and Smchd1−/− mouse embryonic fibroblasts (MEFs) treated with dimethyl sulfoxide (DMSO). Gray dots, genes not differentially expressed. Blue dots, autosomal differentially expressed genes. Red dots, X-linked differentially expressed genes. b Workflow showing the identification of genes subject to X-chromosome inactivation (XCI). Please see Supplementary Data 1 for the full list of genes subject to XCI and escapees. c Cumulative distribution plots (CDPs) of %mus for genes subject to XCI in DMSO-treated WT and Smchd1−/− MEFs. P values are given by the Wilcoxon’s rank-sum test (paired, one-sided). d Cumulative distribution plots (CDPs) of %mus for genes subject to XCI in DMSO/5-aza-2′-deoxycytidine (Aza)-treated WT and Smchd1−/− MEFs. P values are given by the Wilcoxon’s rank-sum test (paired, one-sided). e A heatmap showing the %mus of genes subject to XCI in eight different RNA-seq datasets, with unsupervised hierarchical clustering accurately grouping clones with the same genotype and treatment together. f Allele-specific RNA-seq coverage tracks of Flna and Ftsj1, two representative genes subject to XCI. cas, cas-specific reads (active X chromosome; Xa); mus, mus-specific reads (Xi). comp, all reads. To visualize rare mus reads originating from the Xi, the scales of mus tracks were set differently from the cas tracks. For simplicity, only the minus strand was shown. g CDPs comparing %mus of Class I genes vs. other genes subject to XCI. P values are given by the Wilcoxon’s rank-sum test (unpaired, one-sided). Please see Supplementary Data 2 for the full list of Class I genes defined previously
Fig. 3
Fig. 3
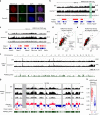
Aberrant accumulation of H3K27me3 in the S1 compartment on the Smchd1−/− inactive X chromosome (Xi). a Immuno-RNA-fluorescent in situ hybridization (immuno-RNA-FISH) for H3K27me3 and Xist on wild-type (WT) and Smchd1−/− mouse embryonic fibroblasts (MEFs). Number of cells with H3K27me3 foci co-localizing with Xist clouds is shown. Scale bar, 5 μm. b H3K27me3 profiles for a representative X-linked region harboring several Class I genes and an escapee (Kdm5c). Red bars, Class I genes. Scales shown in brackets. Δ, Smchd1−/− minus WT. Note that we displayed the “comp” tracks (compiled from all reads) of H3K27me3 ChIP-seq (chromatin immunoprecipitation followed by deep sequencing), as most of the H3K27me3 signals are from the Xi. Allele-specific tracks have been deposited to Gene Expression Omnibus (GEO) (GSE116413). c H3K27me3 profiles for another representative X-linked region. d H3K27me3 density in gene bodies between WT (x axis) vs. Smchd1−/− (y axis) MEFs. Three categories of X-linked genes are shown. e H3K27me3 density in X-linked intergenic regions between WT (x axis) vs. Smchd1−/− (y axis) MEFs. Inter-Class I, intergenic regions flanked by two Class I genes. f H3K27me3 enrichment profiles across the entire genome. g H3K27me3 enrichment profiles across the X chromosome. Gray areas, unmappable regions. Also shown are the locations of Class I genes (red bars), and S1/S2 compartments in Smchd1−/− MEFs. h Box plots comparing the difference in H3K27me3 density between WT and Smchd1−/− cells of each 200-kb bin in S1 vs. S2 compartments. P values are given by the Wilcoxon’s rank-sum test (unpaired, one-sided). Midline, median. Top and bottom of the box, first and third quartile. Whiskers, extension from the top or bottom to the furthest datum within 1.5 times the interquartile range
Fig. 4
Fig. 4
Ablating Smchd1 traps Xist RNA in the S1 compartment. a RNA-sequencing (RNA-seq) fragments per kilobase of transcript per million mapped reads (FPKM) values of Xist in wild-type (WT) and Smchd1−/− mouse embryonic fibroblasts (MEFs). RNA-seq data from two WT and two Smchd1−/− clones treated with dimethyl sulfoxide (DMSO) were analyzed. P values are given by t test (unpaired, two-sided). Error bars, s.d. b Xist CHART (capture hybridization analysis of RNA target) profiles for a representative X-linked region harboring several Class I genes. Red bars, Class I genes. Scales shown in brackets. Δ, Smchd1−/− minus WT. c Xist CHART profiles for another representative X-linked region. Green-shaded area, an escapee (Kdm5c). d Xist density in gene bodies between WT (x axis) vs. Smchd1−/− (y axis) MEFs. Three categories of X-linked genes are shown. e Xist density in X-linked intergenic regions between WT (x axis) vs. Smchd1−/− (y axis) cells. Inter-Class I, intergenic regions flanked by two Class I genes. f Xist enrichment profiles across the X chromosome. Gray areas, unmappable regions. Also shown are H3K27me3 ChIP (chromatin immunoprecipitation followed by deep sequencing) profiles, the locations of Class I genes (red bars), and S1/S2 compartments in Smchd1−/− MEFs. g Box plots comparing the difference in Xist density between WT and Smchd1−/− cells of each 200-kb bin in S1 vs. S2 compartments. P values are given by the Wilcoxon’s rank-sum test (unpaired, one-sided). Midline, median. Top and bottom of the box, first and third quartile. Whiskers, extension from the top or bottom to the furthest datum within 1.5 times the interquartile range
Fig. 5
Fig. 5
Ablating Xist RNA does not reveal S1/S2 compartments despite failed structural maintenance of chromosomes hinge domain containing 1 (SMCHD1) recruitment. a Schematic representation of the epigenetic status of the inactive X chromosome (Xi) in wild-type (WT), Smchd1−/−, and XiΔXist fibroblasts. b Immuno-RNA-fluorescent in situ hybridization (Immuno-RNA-FISH) for SMCHD1 and Xist on WT [XiWT, 2lox(Xist+)] and XiΔXist fibroblasts. Scale bar, 10 μm. c Depth-corrected chromatin interaction maps of the Xi in WT, Smchd1−/_, and XiΔXist fibroblasts binned at 200-kb resolution (top) and the corresponding Pearson’s correlation maps (bottom). Gray-shaded areas, unmappable regions. Also see Supplementary Fig. 2a for active X chromosome (Xa) maps. Note that in the Xi maps of XiΔXist fibroblasts, the “super-loops” (arrowheads) formed by association between Xi regions exhibiting ATAC-seq (assay for transposase-accessible chromatin using sequencing) accessibility, BRG1 binding, cohesin binding, and topologically associated domain (TAD)-like structures not seen on the WT Xi can also be observed. Please see our reanalysis of Hi-C data from the same XiΔXist fibroblasts for in-depth description. d Principal component 1 (PC1) and PC2 values of the Xi. Gray-shaded areas, unmappable regions. Also see Supplementary Fig. 2b for PCs of the Xa. e Bar plots displaying the fraction of long-range interactions (>10 Mb) that span the megadomain boundary (“inter-megadomain” interactions) on the Xa and Xi in WT and XiΔXist fibroblasts. Two replicates were analyzed, with P -values determined by the t test (unpaired, one-sided). Error bars, s.d. f Immuno-RNA-FISH for H2AK119ub and Xist on WT [2lox(Xist+)] and XiΔXist fibroblasts. Number of cells with Xist clouds and co-localizing H2AK119ub foci is shown. Scale bar, 5 μm. g Immuno-RNA-FISH for H2AK119ub and Xist on WT and Smchd1−/− MEFs. Number of cells with H2AK119ub foci co-localizing with Xist clouds is shown. Scale bar, 5 μm
Fig. 6
Fig. 6
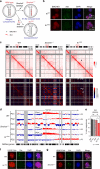
Depleting polycomb repressive complex 1 (PRC1) or heterogeneous nuclear ribonucleoprotein K (HNRNPK) disrupts S1/S2 compartments in Smchd1−/− mouse embryonic fibroblasts (MEFs). a H2AK119ub enrichment profiles across the X chromosome. Gray areas, unmappable regions. Also shown are Xist CHART (capture hybridization analysis of RNA target) profiles, the locations of Class I genes (red bars), and S1/S2 compartments inSmchd1−/− MEFs. Δ, Smchd1−/− minus wild type (WT). Shown are “comp” tracks (compiled from all reads) of H2AK119ub ChIP-seq (chromatin immunoprecipitation followed by deep sequencing). Allele-specific tracks have been deposited to Gene Expression Omnibus (GEO) (GSE116413). b Box plots comparing the difference in H2AK119ub density between WT and Smchd1−/− cells of each 200-kb bin in S1 vs. S2 compartments. P values are given by the Wilcoxon’s rank-sum test (unpaired, one-sided). Midline, median. Top and bottom of the box, first and third quartile. Whiskers, extension from the top or bottom to the furthest datum within 1.5 times the interquartile range. c Depth-corrected chromatin interaction maps of the inactive X chromosome (Xi) in WT MEFs treated with control (Scramble) small interfering RNA (siRNA), and Smchd1−/− MEFs treated with control, RING1A/RING1B (PRC1 KD), or HNRNPK (HNRNPK KD) siRNA binned at 200-kb resolution (top) and the corresponding Pearson’s correlation maps (bottom). Gray-shaded areas, unmappable regions. Also see Supplementary Fig. 13a for the active X chromosome (Xa) maps. d Principal component 1 (PC1) and PC2 values of the Xi. Regions with positive PC1 values represent the S1 compartment or the telomeric megadomain. Gray-shaded areas, unmappable regions. Also see Supplementary Fig. 13b for PCs of the Xa. e Bar plots displaying the fraction of long-range interactions (>10 Mb) that span the Dxz4 megadomain boundary (“inter-megadomain” interactions) under different conditions. Two replicates were analyzed, with P values determined by the t test (unpaired, one-sided). Error bars, s.d.
Fig. 7
Fig. 7
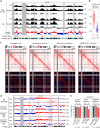
Heterogeneous nuclear ribonucleoprotein K (HNRNPK) and polycomb repressive complex 1 (PRC1) mediate structural maintenance of chromosomes hinge domain containing 1 (SMCHD1) recruitment and the stepwise folding of the inactive X chromosome (Xi). a Immuno-RNA-fluorescent in situ hybridization (immuno-RNA-FISH) for SMCHD1 and Xist on female wild-type mouse embryonic fibroblasts (WT MEFs) treated with small interfering RNA (siRNA) targeting HNRNPK, PRC1, and PRC2. Number of cells with SMCHD1 foci co-localizing with Xist clouds in a representative biological replicate is shown. Scale bar, 10 μm. b Immuno-RNA-FISH for SMCHD1 and Xist on female WT MEFs treated with dimethyl sulfoxide (DMSO) or MG132. Number of cells with SMCHD1 foci co-localizing with Xist clouds in a representative biological replicate is shown. Scale bar, 10 μm. c Chromatin binding profiles of H2AK119ub (GSE107217), H3K27me3 (GSE33823), and SMCHD1 (GSE99991) in female wild-type MEFs averaged over each 20-kb region centered at the summit of a H2AK119ub peak. d Depth-corrected chromatin interaction maps of the Xi in WT MEFs treated with control (scramble) siRNA, Smchd1−/− MEFs treated with control siRNA, and WT MEFs treated with RING1A/RING1B (PRC1 knockdown (KD)) or HNRNPK (HNRNPK KD) siRNA binned at 200-kb resolution (top) and the corresponding Pearson’s correlation maps (bottom). Gray-shaded areas, unmappable regions. Also see Supplementary Fig. 13a for the active X chromosome (Xa) maps. e Principal component 1 (PC1) and PC2 values of the Xi. Regions with positive PC1 values represent the S1 compartment or the telomeric megadomain. Gray-shaded areas, unmappable regions. Also see Supplementary Fig. 13b for PCs of the Xa. f Bar plots displaying the fraction of long-range interactions (>10 Mb) that span the Dxz4 megadomain boundary (“inter-megadomain” interactions) under different conditions. For HNRNPK KD, two replicates were analyzed, with P values determined by the t test (unpaired, one-sided). Error bars, s.d.
Fig. 8
Fig. 8
A model for the folding and unfolding of the inactive X chromosome (Xi) origami. a Summary: A stepwise folding process for the transformation of the Xi (“Origami Model”). Xist RNA is produced from the A compartment. Following transcription, Xist initially spreads to co-segregated A-compartmental chromatin. Through recruiting polycomb repressive complex 1 (PRC1), Xist reconfigures the Xi into S1/S2 compartments. Following structural maintenance of chromosomes hinge domain containing 1 (SMCHD1) recruitment (via a mechanism requiring heterogeneous nuclear ribonucleoprotein K (HNRNPK), PRC1, and H2AK119ub), S1/S2 compartments are merged to form a compartment-less structure. In cells losing SMCHD1 after completing XCI, S1/S2 compartments reappear, coinciding with accumulation of Xist, H3K27me3, and H2AK119ub in the S1 compartment and destabilized gene silencing. Depleting PRC1 or HNRNPK diminishes the reappeared S1/S2 compartments, resulting in a “de-compartmentalized” Xi with sharper partition between the two megadomains. In cells that have undergone Xist ablation post XCI, both SMCHD1 and PRC1 fail to be recruited to the Xi, also leading to a “de-compartmentalized” Xi with sharper megadomains. b Model: In the absence of SMCHD1, Xist-rich chromatin co-segregates, likely via PRC1 self-association, leading to the formation of S1/S2 compartments. The self-association between S1 chromatin creates long-range interaction across the Dxz4 boundary, thus partially obscuring megadomains. c Three major folding mechanisms that define the large-scale Xi architecture: self-association between Xist/H2AK119ub-enriched chromatin to form S1/S2 compartments through PRC1, potential chromatin mixing activity of SMCHD1, and inter-megadomain insulation by Dxz4. When superimposed on the Xi, these folding mechanisms sometimes interfere with each other—SMCHD1 attenuates S1/S2 structure, and PRC1 obscures megadomains

Similar articles

Cited by

References

    1. Lieberman-Aiden E, et al. Comprehensive mapping of long-range interactions reveals folding principles of the human genome. Science. 2009;326:289–293. doi: 10.1126/science.1181369. - DOI - PMC - PubMed
    1. Dixon JR, et al. Topological domains in mammalian genomes identified by analysis of chromatin interactions. Nature. 2012;485:376–380. doi: 10.1038/nature11082. - DOI - PMC - PubMed
    1. Nora EP, et al. Spatial partitioning of the regulatory landscape of the X-inactivation centre. Nature. 2012;485:381–385. doi: 10.1038/nature11049. - DOI - PMC - PubMed
    1. Nora EP, et al. Targeted degradation of CTCF decouples local insulation of chromosome domains from genomic compartmentalization. Cell. 2017;169:930–944. doi: 10.1016/j.cell.2017.05.004. - DOI - PMC - PubMed
    1. Rao SSP, et al. Cohesin loss eliminates all loop domains. Cell. 2017;171:305–320. doi: 10.1016/j.cell.2017.09.026. - DOI - PMC - PubMed

Publication types