. 2019 Jul 2;11(7):309.
doi: 10.3390/pharmaceutics11070309.

Targeting Cell Adhesion Molecules via Carbonate Apatite-Mediated Delivery of Specific siRNAs to Breast Cancer Cells In Vitro and In Vivo

Affiliations

Targeting Cell Adhesion Molecules via Carbonate Apatite-Mediated Delivery of Specific siRNAs to Breast Cancer Cells In Vitro and In Vivo

Maeirah Afzal Ashaie et al. Pharmaceutics. .

Abstract

While several treatment strategies are applied to cure breast cancer, it still remains one of the leading causes of female deaths worldwide. Since chemotherapeutic drugs have severe side effects and are responsible for development of drug resistance in cancer cells, gene therapy is now considered as one of the promising options to address the current treatment limitations. Identification of the over-expressed genes accounting for constitutive activation of certain pathways, and their subsequent knockdown with specific small interfering RNAs (siRNAs), could be a powerful tool in inhibiting proliferation and survival of cancer cells. In this study, we delivered siRNAs against mRNA transcripts of over-regulated cell adhesion molecules such as catenin alpha 1 (CTNNA1), catenin beta 1 (CTNNB1), talin-1 (TLN1), vinculin (VCL), paxillin (PXN), and actinin-1 (ACTN1) in human (MCF-7 and MDA-MB-231) and murine (4T1) cell lines as well as in the murine female Balb/c mice model. In order to overcome the barriers of cell permeability and nuclease-mediated degradation, the pH-sensitive carbonate apatite (CA) nanocarrier was used as a delivery vehicle. While targeting CTNNA1, CTNNB1, TLN1, VCL, PXN, and ACTN1 resulted in a reduction of cell viability in MCF-7 and MDA-MB-231 cells, delivery of all these siRNAs via carbonate apatite (CA) nanoparticles successfully reduced the cell viability in 4T1 cells. In 4T1 cells, delivery of CTNNA1, CTNNB1, TLN1, VCL, PXN, and ACTN1 siRNAs with CA caused significant reduction in phosphorylated and total AKT levels. Furthermore, reduced band intensity was observed for phosphorylated and total MAPK upon transfection of 4T1 cells with CTNNA1, CTNNB1, and VCL siRNAs. Intravenous delivery of CTNNA1 siRNA with CA nanoparticles significantly reduced tumor volume in the initial phase of the study, while siRNAs targeting CTNNB1, TLN1, VCL, PXN, and ACTN1 genes significantly decreased the tumor burden at all time points. The tumor weights at the end of the treatments were also notably smaller compared to CA. This successfully demonstrates that targeting these dysregulated genes via RNAi and by using a suitable delivery vehicle such as CA could serve as a promising therapeutic treatment modality for breast cancers.

Keywords: breast cancer; carbonate apatite; gene silencing; nanoparticle; paxillin and actinin-1; siRNA; talin-1; vinculin; α-catenin; β-catenin.


Conflict of interest statement

The authors declare no conflicts of interest.

Figures

Figure 1
Figure 1
Advantages of using siRNAs as therapeutics for treatment of diseases such as breast cancer.
Figure 2
Figure 2
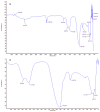
FT-IR spectra of lyophilized carbonate apatite (CA): (a) Spectra in the range of 400–3800 cm−1, and (b) magnified peaks of CO3 and PO43−.
Figure 3
Figure 3
Cell viability of MCF-7 cells and 4T1 cells via the MTT assay. Cells were treated with/without CA bound with (a) actinin-1 (ACTN1) and (b) talin-1 (TLN1) siRNA at 10 pM, 100 pM, and 1 nM concentration of siRNAs for 48 h. Transfection of this complex was done for 48 h, which was followed by absorbance reading at 595 nm with a reference wavelength of 650 nm. Data is presented as mean ± S.D.
Figure 4
Figure 4
Effect of NPs-loaded siRNA against catenin alpha 1 (CTNNA1) and catenin beta 1 (CTNNB1) gene on cell viability after 48 h using the MTT assay. CA-CTNNA1 and CA-CTNNB1 complexes were prepared at a final volume of 1 mL by combining 1 nM CTNNA1 and CTNNB1 siRNAs individually along with 4 mM CaCl2 into DMEM buffered with bicarbonate, at a pH of 7.4, followed by a 30-min incubation. Transfection of this complex was done for 48 h, which was followed by an absorbance reading at 595 nm with a reference wavelength of 650 nm. Data is presented as mean ± S.D against (a) MCF-7 cells, (b) MDA-MB-231 cells, and (c) 4T1 cells.
Figure 5
Figure 5
Effect of NPs-loaded siRNA against talin-1 (TLN1) gene on cell viability after 48 h using the MTT assay. CA-TLN1 complex were prepared at a final volume of 1 mL by combining 1 nM TLN1 siRNA along with 4 mM CaCl2 into DMEM buffered with bicarbonate, at a pH of 7.4, which was followed by a 30-min incubation. Transfection of this complex was done for 48 h, which was followed by an absorbance reading at 595 nm with a reference wavelength of 650 nm. Data is presented as mean ± S.D against (a) MCF-7 cells, (b) MDA-MB-231 cells, and (c) 4T1 cells.
Figure 5
Figure 5
Effect of NPs-loaded siRNA against talin-1 (TLN1) gene on cell viability after 48 h using the MTT assay. CA-TLN1 complex were prepared at a final volume of 1 mL by combining 1 nM TLN1 siRNA along with 4 mM CaCl2 into DMEM buffered with bicarbonate, at a pH of 7.4, which was followed by a 30-min incubation. Transfection of this complex was done for 48 h, which was followed by an absorbance reading at 595 nm with a reference wavelength of 650 nm. Data is presented as mean ± S.D against (a) MCF-7 cells, (b) MDA-MB-231 cells, and (c) 4T1 cells.
Figure 6
Figure 6
Effect of NPs-loaded siRNA against the vinculin (VCL) gene on cell viability after 48 h using an MTT assay. The CA-VCL complex was prepared at a final volume of 1 mL by combining 1 nM VCL siRNA along with 4 mM CaCl2 into DMEM buffered with bicarbonate, at a pH of 7.4, followed by a 30-min incubation. Transfection of this complex was done for 48 h. This was followed by an absorbance reading at 595 nm with a reference wavelength of 650 nm. Data is presented as mean ± S.D against (a) MCF-7 cells, (b) MDA-MB-231 cells, and (c) 4T1 cells.
Figure 7
Figure 7
Effect of NPs-loaded siRNA against the paxillin (PXN) gene on cell viability after 48 h using the MTT assay. The CA-PXN complex was prepared at a final volume of 1 mL by combining 1 nM PXN siRNA along with 4 mM CaCl2 into DMEM buffered with bicarbonate, at a pH of 7.4, which was followed by a 30-min incubation. Transfection of this complex was done for 48 h, which was followed by an absorbance reading at 595 nm with a reference wavelength of 650 nm. Data is presented as mean ± S.D against (a) MCF-7 cells, (b) MDA-MB-231 cells, and (c) 4T1 cells.
Figure 8
Figure 8
Effect of NPs-loaded siRNA against actinin-1 (ACTN1) gene on cell viability after 48 h using the MTT assay. The CA-ACTN1 complex was prepared at a final volume of 1 mL by combining 1 nM ACTN1 siRNA along with 4 mM CaCl2 into DMEM buffered with bicarbonate, at a pH of 7.4, which was followed by 30 min of incubation. Transfection of this complex was done for 48 h, which was followed by an absorbance reading at 595 nm with a reference wavelength of 650 nm. Data is presented as mean ± S.D against (a) MCF-7 cells, (b) MDA-MB-231 cells, and (c) 4T1 cells.
Figure 8
Figure 8
Effect of NPs-loaded siRNA against actinin-1 (ACTN1) gene on cell viability after 48 h using the MTT assay. The CA-ACTN1 complex was prepared at a final volume of 1 mL by combining 1 nM ACTN1 siRNA along with 4 mM CaCl2 into DMEM buffered with bicarbonate, at a pH of 7.4, which was followed by 30 min of incubation. Transfection of this complex was done for 48 h, which was followed by an absorbance reading at 595 nm with a reference wavelength of 650 nm. Data is presented as mean ± S.D against (a) MCF-7 cells, (b) MDA-MB-231 cells, and (c) 4T1 cells.
Figure 9
Figure 9
(a) Effect of intracellular delivery of CA loaded single additional cell adhesion siRNAs on protein expressions in 4T1 cells. Cells were incubated with CA loaded single additional cell adhesion siRNAs (ACTN1, PXN, CTNNA1, CTNNB1, TLN1, and VCL) siRNAs for 48 h, which was followed by cell lysis for Western blot analysis. After loading uniform (9 µg) concentration of proteins on SDS-PAGE, proteins were transferred onto a nitrocellulose membrane for detecting the expression of p-AKT, total AKT, p-MAPK, total MAPK, and the housekeeping gene GAPDH. Densitometry analysis of (b) p-AKT, (c) AKT, (d) p-MAPK, and (e) MAPK expression in 4T1 cells treated with single cell adhesion siRNAs (ACTN1, PXN, CTNNA1, CTNNB1, TLN1, and VCL) loaded CA. Data represents as mean ± S.D. * represents a significant difference of single siRNAs compared to CA, with p < 0.05.
Figure 9
Figure 9
(a) Effect of intracellular delivery of CA loaded single additional cell adhesion siRNAs on protein expressions in 4T1 cells. Cells were incubated with CA loaded single additional cell adhesion siRNAs (ACTN1, PXN, CTNNA1, CTNNB1, TLN1, and VCL) siRNAs for 48 h, which was followed by cell lysis for Western blot analysis. After loading uniform (9 µg) concentration of proteins on SDS-PAGE, proteins were transferred onto a nitrocellulose membrane for detecting the expression of p-AKT, total AKT, p-MAPK, total MAPK, and the housekeeping gene GAPDH. Densitometry analysis of (b) p-AKT, (c) AKT, (d) p-MAPK, and (e) MAPK expression in 4T1 cells treated with single cell adhesion siRNAs (ACTN1, PXN, CTNNA1, CTNNB1, TLN1, and VCL) loaded CA. Data represents as mean ± S.D. * represents a significant difference of single siRNAs compared to CA, with p < 0.05.
Figure 10
Figure 10
Average body weight of CA treated (a) CA + TLN1 (b) CA + VCL and (c) CA+ ACTN1 group of mice on Day 8 and Day 21 of the tumor regression study. Data represents an average body weight of five mice ± S.D.
Figure 11
Figure 11
Treatment effect of CA bound siRNA against CTNNA1 genes in the 4T1 induced tumor mice model. 4T1 cells were injected subcutaneously in the mammary pad of mice. After a palpable tumor, mice were treated intravenously through tail vein injection with 100 μL of CA-CTNNA1 siRNA formed in 4 μL of 1 M CaCl2. Four doses of treatment were given on Day 8, Day 11, Day 14, and Day 17. Five mice were used per group and data was represented as mean ± SD. (a) Tumor outgrowth of mice treated with CA-CTNNA1 values are significant for * representing p < 0.05 compared to the CA control. (b) Excised tumor of the CA-CTNNA1 siRNA group compared to CA at the end of the treatment. (c) Tumor weight of the treated group vs. the CA-treated group.
Figure 12
Figure 12
Treatment effect of CA bound siRNA against CTNNB1 genes in a 4T1 induced tumor mice model. 4T1 cells were injected subcutaneously in the mammary pad of mice. After a palpable tumor, mice were treated intravenously through tail vein injection with 100 μL of CA-CTNNB1 siRNA formed in 4 μL of 1 M CaCl2. Four doses of treatment were given on Day 8, Day 11, Day 14, and Day 17. Five mice were used per group and data was represented as mean ± SD. (a) Tumor outgrowth of mice treated with CA-CTNNB1 values are significant for * representing p < 0.05 compared to the CA control. (b) Excised tumor of the CA-CTNNB1 siRNA group compared to CA at the end of the treatment. (c) Tumor weight of the treated group vs. the CA treated group with * representing p < 0.05 compared to the control.
Figure 13
Figure 13
Treatment effect of CA bound siRNA against TLN1 genes in a 4T1 induced tumor mice model. 4T1 cells were injected subcutaneously in the mammary pad of mice. After a palpable tumor, mice were treated intravenously through tail vein injection with 100 μL of CA-TLN1 siRNA formed in 4 μL of 1 M CaCl2. Four doses of treatment were given on Day 8, Day 11, Day 14, and Day 17. Five mice were used per group and data was represented as mean ± SD. (a) Tumor outgrowth of mice treated with CA-TLN1 values are significant for * representing p < 0.05 compared to the CA control. (b) Excised tumor of the CA-TLN1 siRNA group compared to CA at the end of the treatment. (c) Tumor weight of the treated group vs. the CA treated group with * representing p < 0.05 compared to the control.
Figure 13
Figure 13
Treatment effect of CA bound siRNA against TLN1 genes in a 4T1 induced tumor mice model. 4T1 cells were injected subcutaneously in the mammary pad of mice. After a palpable tumor, mice were treated intravenously through tail vein injection with 100 μL of CA-TLN1 siRNA formed in 4 μL of 1 M CaCl2. Four doses of treatment were given on Day 8, Day 11, Day 14, and Day 17. Five mice were used per group and data was represented as mean ± SD. (a) Tumor outgrowth of mice treated with CA-TLN1 values are significant for * representing p < 0.05 compared to the CA control. (b) Excised tumor of the CA-TLN1 siRNA group compared to CA at the end of the treatment. (c) Tumor weight of the treated group vs. the CA treated group with * representing p < 0.05 compared to the control.
Figure 14
Figure 14
Treatment effect of CA bound siRNA against VCL genes in a 4T1 induced tumor mice model. 4T1 cells were injected subcutaneously in the mammary pad of mice. After a palpable tumor, mice were treated intravenously through tail vein injection with 100 μL of CA-VCL siRNA formed in 4 μL of 1 M CaCl2. Four doses of treatment were given on Day 8, Day 11, Day 14, and Day 17. Five mice were used per group and data was represented as mean ± SD. (a) Tumor outgrowth of mice treated with CA-VCL values are significant for * representing p < 0.05 compared to the CA control. (b) Excised tumor of the CA-VCL siRNA group compared to CA at the end of the treatment. (c) Tumor weight of the treated group vs. the CA-treated group with * representing p < 0.05 compared to the control.
Figure 15
Figure 15
Treatment effect of CA bound siRNA against PXN genes in a 4T1 induced tumor mice model. 4T1 cells were injected subcutaneously in the mammary pad of mice. After a palpable tumor, mice were treated intravenously through tail vein injection with 100 μL of CA-PXN siRNA formed in 4 μL of 1 M CaCl2. Four doses of treatment were given on Day 8, Day 11, Day 14, and Day 17. Five mice were used per group and data was represented as mean ± SD. (a) Tumor outgrowth of mice treated with CA-PXN values are significant for * representing p < 0.05 compared to the CA control. (b) Excised tumor of the CA-PXN siRNA group was compared to CA at the end of the treatment. (c) Tumor weight of the treated group vs. the CA treated group with * representing p < 0.05 compared to the control.
Figure 16
Figure 16
Treatment effect of CA bound siRNA against ACTN1 genes in a 4T1 induced tumor mice model. 4T1 cells were injected subcutaneously in the mammary pad of mice. After a palpable tumor, mice were treated intravenously through tail vein injection with 100 μL of CA-ACTN1 siRNA formed in 4 μL of 1 M CaCl2. Four doses of treatment were given on Day 8, Day 11, Day 14, and Day 17. Five mice were used per group and data was represented as mean ± SD. (a) Tumor outgrowth of mice treated with CA-ACTN1 values are significant for * representing p < 0.05 compared to the CA control. (b) Excised tumor of the CA-ACTN1 siRNA group was compared to CA at the end of the treatment. (c) Tumor weight of the treated group vs. the CA treated group with * representing p < 0.05 was compared to the control.
Figure 16
Figure 16
Treatment effect of CA bound siRNA against ACTN1 genes in a 4T1 induced tumor mice model. 4T1 cells were injected subcutaneously in the mammary pad of mice. After a palpable tumor, mice were treated intravenously through tail vein injection with 100 μL of CA-ACTN1 siRNA formed in 4 μL of 1 M CaCl2. Four doses of treatment were given on Day 8, Day 11, Day 14, and Day 17. Five mice were used per group and data was represented as mean ± SD. (a) Tumor outgrowth of mice treated with CA-ACTN1 values are significant for * representing p < 0.05 compared to the CA control. (b) Excised tumor of the CA-ACTN1 siRNA group was compared to CA at the end of the treatment. (c) Tumor weight of the treated group vs. the CA treated group with * representing p < 0.05 was compared to the control.
Figure 17
Figure 17
Intracellular essential signaling pathways involving cell adhesion molecules in tumorigenesis.
Figure 18
Figure 18
Essential cell adhesion molecules and pathways interlinked in breast tumorigenesis and aberration of these pathways and by introduction of specific siRNAs, eventually hampering tumorigenesis.

Similar articles

Cited by

References

    1. Malhotra G.K., Zhao X., Band H., Band V. Histological, molecular and functional subtypes of breast cancers. Cancer Biol.Ther. 2010;10:955–960. doi: 10.4161/cbt.10.10.13879. - DOI - PMC - PubMed
    1. Jin X., Mu P. Targeting breast cancer metastasis. Breast Cancer Basic Clin. Res. 2015 doi: 10.4137/BCBCR.S25460. - DOI - PMC - PubMed
    1. Parekh A., Weaver A.M. Regulation of cancer invasiveness by the physical extracellular matrix environment. Cell adhes. Migr. 2009;3:288–292. doi: 10.4161/cam.3.3.8888. - DOI - PMC - PubMed
    1. Bendas G., Borsig L. Cancer cell adhesion and metastasis: Selectins, integrins, and the inhibitory potential of heparins. Int. J. Cell Biol. 2012;2012:676731. doi: 10.1155/2012/676731. - DOI - PMC - PubMed
    1. Berx G., Van Roy F. The E-cadherin/catenin complex: An important gatekeeper in breast cancer tumorigenesis and malignant progression. Breast Cancer Res. 2001;3:289. doi: 10.1186/bcr309. - DOI - PMC - PubMed

LinkOut - more resources