

NUCLIZE for quantifying epigenome: generating histone modification data at single-nucleosome resolution using genuine nucleosome positions
- PMID: 31266464
- PMCID: PMC6604165
- DOI: 10.1186/s12864-019-5932-6
NUCLIZE for quantifying epigenome: generating histone modification data at single-nucleosome resolution using genuine nucleosome positions
Abstract
Background: Defining histone modification at single-nucleosome resolution provides accurate epigenomic information in individual nucleosomes. However, most of histone modification data deposited in current databases, such as ENCODE and Roadmap, have low resolution with peaks of several kilo-base pairs (kb), which due to the technical defects of regular ChIP-Seq technology.
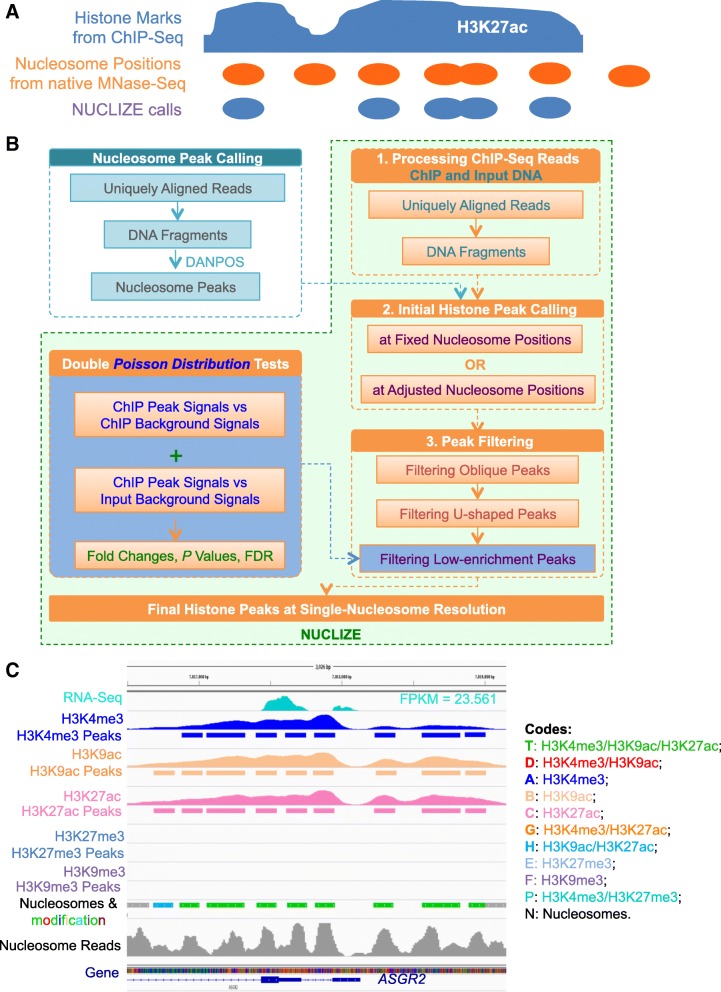
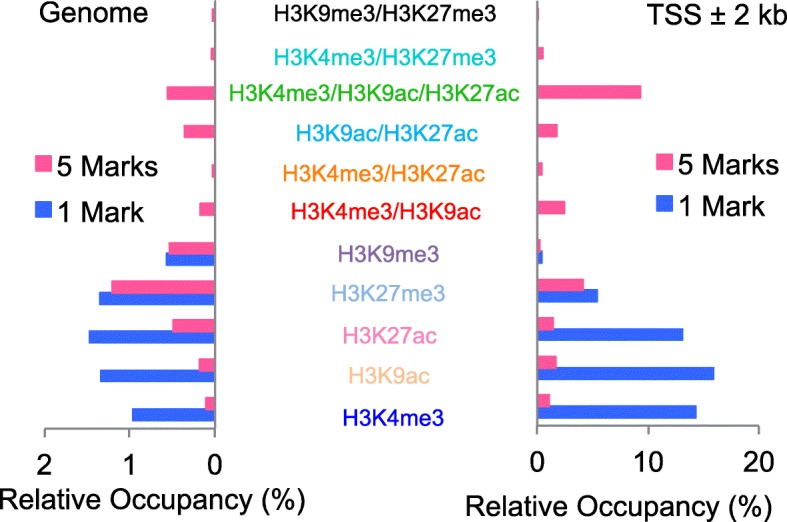
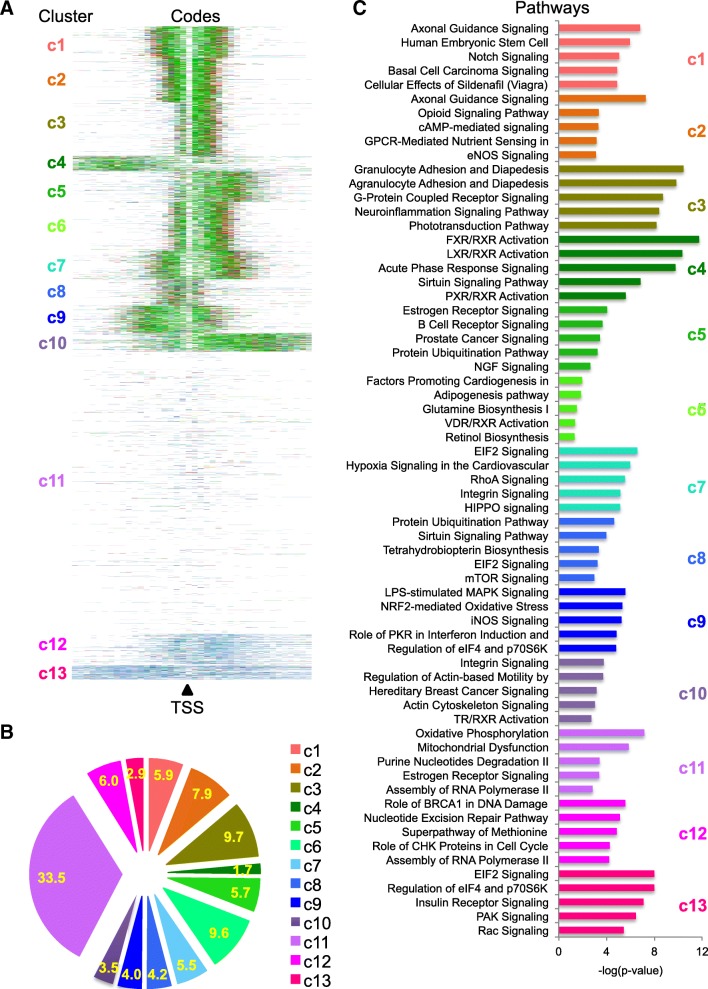
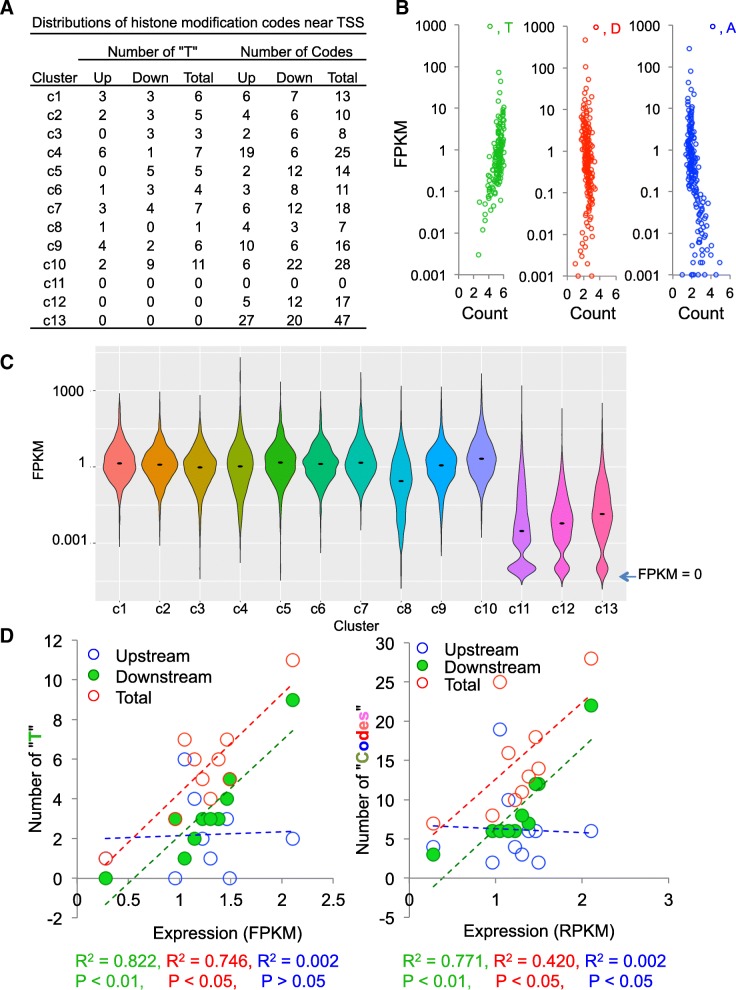
Results: To generate histone modification data at single-nucleosome resolution, we developed a novel approach, NUCLIZE, using synergistic analyses of histone modification data from ChIP-Seq and high-resolution nucleosome mapping data from native MNase-Seq. With this approach, we generated quantitative epigenomics data of single and multivalent histone modification marks in each nucleosome. We found that the dominant trivalent histone mark (H3K4me3/H3K9ac/H3K27ac) and others showed defined and specific patterns near each TSS, indicating potential epigenetic codes regulating gene transcription.
Conclusions: Single-nucleosome histone modification data render epigenomic data become quantitative, which is essential for investigating dynamic changes of epigenetic regulation in the biological process or for functional epigenomics studies. Thus, NUCLIZE turns current epigenomic mapping studies into genuine functional epigenomics studies with quantitative epigenomic data.
Keywords: Graph epigenome; Histone modification; NUCLIZE; Nucleosome positioning; Quantitative epigenomics.
Conflict of interest statement
The authors declare no competing interests.
Figures
Similar articles
-
Generation of Native Chromatin Immunoprecipitation Sequencing Libraries for Nucleosome Density Analysis.J Vis Exp. 2017 Dec 12;(130):56085. doi: 10.3791/56085. J Vis Exp. 2017. PMID: 29286469 Free PMC article.
-
Identifying positioned nucleosomes with epigenetic marks in human from ChIP-Seq.BMC Genomics. 2008 Nov 13;9:537. doi: 10.1186/1471-2164-9-537. BMC Genomics. 2008. PMID: 19014516 Free PMC article.
-
Epigenome sequencing comes of age in development, differentiation and disease mechanism research.Epigenomics. 2011 Apr;3(2):207-20. doi: 10.2217/epi.10.78. Epigenomics. 2011. PMID: 22122282 Review.
-
A high-resolution whole-genome map of the distinctive epigenomic landscape induced by butyrate in bovine cells.Anim Genet. 2014 Aug;45 Suppl 1:40-50. doi: 10.1111/age.12147. Epub 2014 Jul 2. Anim Genet. 2014. PMID: 24990294
-
Methods for ChIP-seq analysis: A practical workflow and advanced applications.Methods. 2021 Mar;187:44-53. doi: 10.1016/j.ymeth.2020.03.005. Epub 2020 Mar 30. Methods. 2021. PMID: 32240773 Review.
Cited by
-
The establishment of CDK9/RNA PolII/H3K4me3/DNA methylation feedback promotes HOTAIR expression by RNA elongation enhancement in cancer.Mol Ther. 2022 Apr 6;30(4):1597-1609. doi: 10.1016/j.ymthe.2022.01.038. Epub 2022 Feb 2. Mol Ther. 2022. PMID: 35121112 Free PMC article.
References
MeSH terms
Substances
Grants and funding
LinkOut - more resources
Full Text Sources
Molecular Biology Databases
