

The P-selectin and PSGL-1 axis accelerates atherosclerosis via activation of dendritic cells by the TLR4 signaling pathway
- PMID: 31263109
- PMCID: PMC6602970
- DOI: 10.1038/s41419-019-1736-5
The P-selectin and PSGL-1 axis accelerates atherosclerosis via activation of dendritic cells by the TLR4 signaling pathway
Abstract
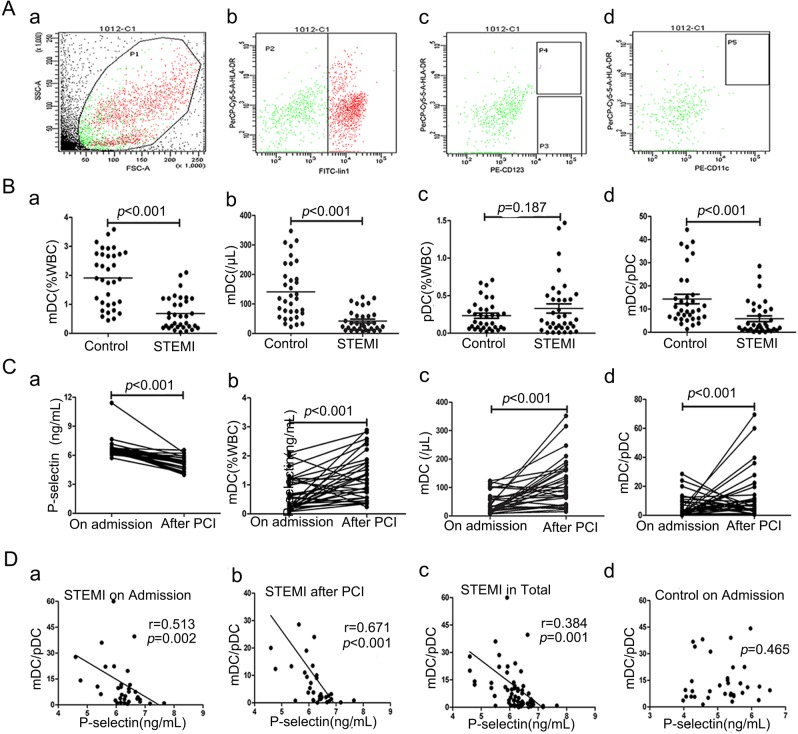
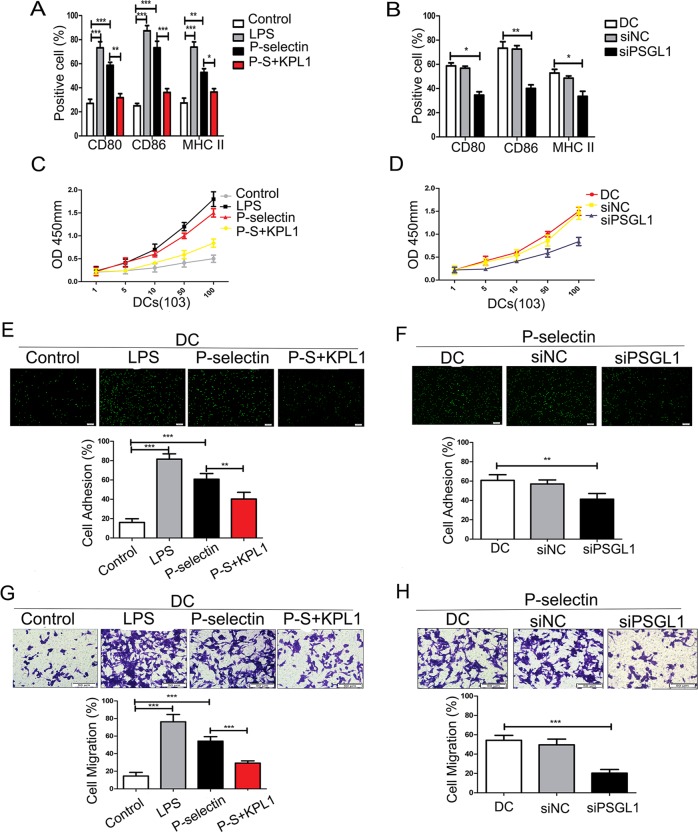
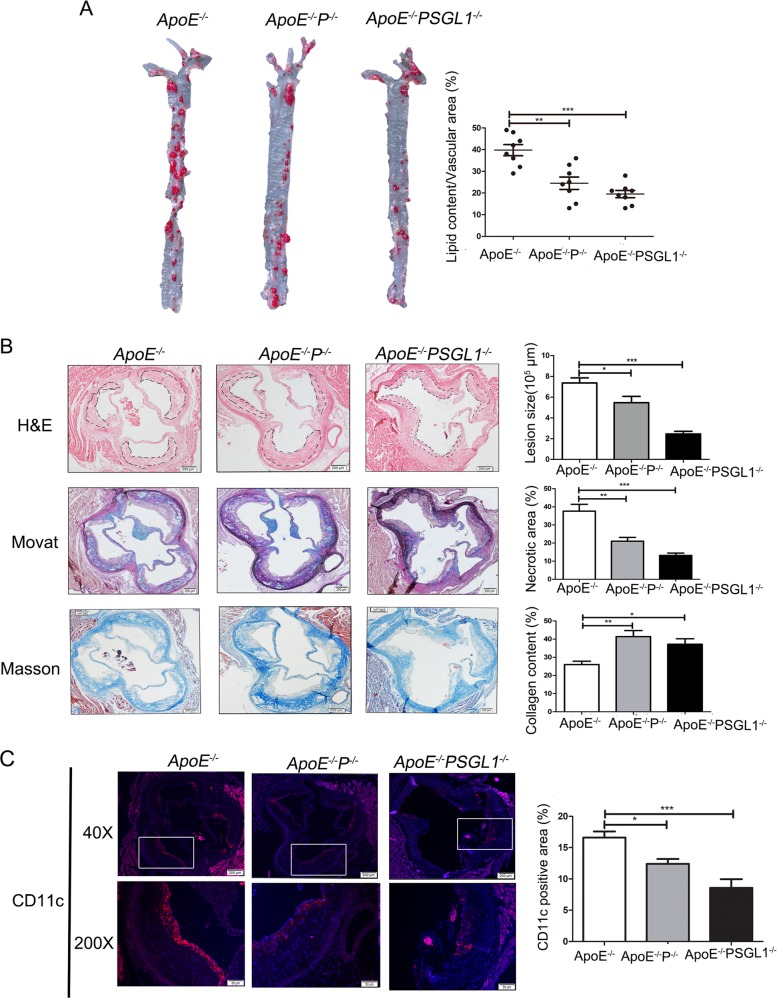
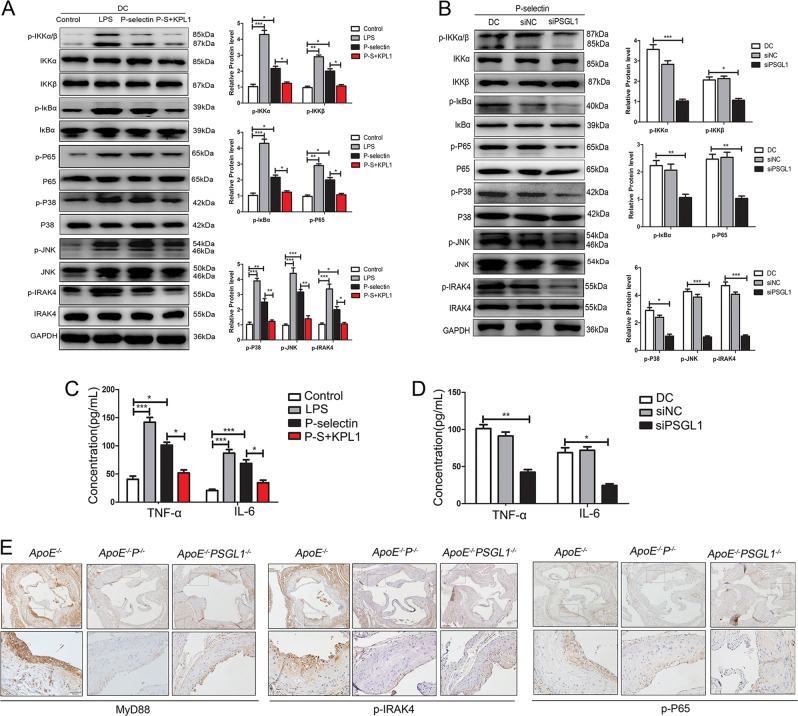
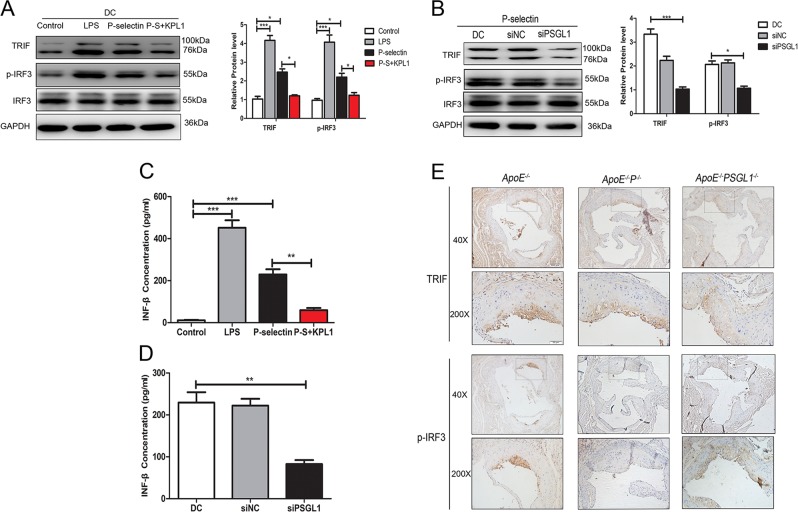
P-selectin and dendritic cells (DCs) are associated with atherosclerosis. However, their interactions in this setting are undefined. Herein, we investigated the role of P-selectin and its receptor P-selectin glycoprotein ligand (PSGL)-1 on atherosclerosis via activation of DCs. In the current study, a total of 34 patients with ST elevation myocardial infarction (STEMI) and 34 healthy control subjects were enrolled. Serum concentration of P-selectin was higher and the myeloid DC/plasmacytoid DC (mDC/pDC) ratio was lower in STEMI patients than in normal individuals. Interestingly, in STEMI patients, P-selectin was decreased and the mDC/pDC ratio was increased at 5-7 days after successful percutaneous coronary intervention, as compared with values on admission. Serum P-selectin was inversely correlated with the mDC/pDC ratio. Moreover, ApoE-/-P-/- and ApoE-/-PSGL-1-/- mice developed small atherosclerotic plaques after feeding of a western diet for 12 weeks and DC infiltration was significantly reduced. P-selectin stimulation markedly induced phenotypic maturation, enhanced secretion of inflammatory cytokines, communication with T cells, and the adhesion and migration of DCs. In vivo, DC maturation was significantly attenuated in P-selectin and PSGL1 knockout mice under hypercholesterolemic and inflammatory conditions. These effects were associated with the activation of myeloid differentiation primary response 88 (MYD88)-dependent and MyD88-independent Toll-like receptor 4 (TLR4) signaling pathways. Taken together, binding of P-selectin to PSGL-1 on DCs contributes to atherosclerosis progression via DC activation via the TLR4 signaling pathway.
Conflict of interest statement
The authors declare that they have no conflict of interest.
Figures

Similar articles
-
P-selectin glycoprotein ligand-1 is highly expressed on Ly-6Chi monocytes and a major determinant for Ly-6Chi monocyte recruitment to sites of atherosclerosis in mice.Circulation. 2008 Jun 24;117(25):3227-37. doi: 10.1161/CIRCULATIONAHA.108.771048. Epub 2008 Jun 2. Circulation. 2008. PMID: 18519846 Free PMC article.
-
TLR/MyD88 and liver X receptor alpha signaling pathways reciprocally control Chlamydia pneumoniae-induced acceleration of atherosclerosis.J Immunol. 2008 Nov 15;181(10):7176-85. doi: 10.4049/jimmunol.181.10.7176. J Immunol. 2008. PMID: 18981139 Free PMC article.
-
P-selectin glycoprotein ligand-1 deficiency leads to cytokine resistance and protection against atherosclerosis in apolipoprotein E deficient mice.Atherosclerosis. 2012 Jan;220(1):110-7. doi: 10.1016/j.atherosclerosis.2011.10.012. Epub 2011 Oct 17. Atherosclerosis. 2012. PMID: 22041028 Free PMC article.
-
Treg-mediated suppression of atherosclerosis requires MYD88 signaling in DCs.J Clin Invest. 2013 Jan;123(1):179-88. doi: 10.1172/JCI64617. Epub 2012 Dec 21. J Clin Invest. 2013. PMID: 23257360 Free PMC article.
-
Toll-like receptors in atherosclerosis.Int J Mol Sci. 2013 Jul 4;14(7):14008-23. doi: 10.3390/ijms140714008. Int J Mol Sci. 2013. PMID: 23880853 Free PMC article. Review.
Cited by
-
Role of GALNT4 in protecting against cardiac hypertrophy through ASK1 signaling pathway.Cell Death Dis. 2021 Oct 22;12(11):980. doi: 10.1038/s41419-021-04222-5. Cell Death Dis. 2021. PMID: 34675184 Free PMC article.
-
P-selectin glycoprotein ligand 1 deficiency prevents development of acute pancreatitis by attenuating leukocyte infiltration.World J Gastroenterol. 2020 Nov 7;26(41):6361-6377. doi: 10.3748/wjg.v26.i41.6361. World J Gastroenterol. 2020. PMID: 33244198 Free PMC article.
-
Predictive biomarkers for the early detection and management of heart failure.Heart Fail Rev. 2024 Mar;29(2):331-353. doi: 10.1007/s10741-023-10347-w. Epub 2023 Sep 13. Heart Fail Rev. 2024. PMID: 37702877 Review.
-
Platelet-monocyte aggregates: molecular mediators of thromboinflammation.Front Cardiovasc Med. 2023 May 15;10:960398. doi: 10.3389/fcvm.2023.960398. eCollection 2023. Front Cardiovasc Med. 2023. PMID: 37255704 Free PMC article. Review.
-
Glycans and Glycan-Binding Proteins as Regulators and Potential Targets in Leukocyte Recruitment.Front Cell Dev Biol. 2021 Feb 4;9:624082. doi: 10.3389/fcell.2021.624082. eCollection 2021. Front Cell Dev Biol. 2021. PMID: 33614653 Free PMC article. Review.
References
Publication types
MeSH terms
Substances
LinkOut - more resources
Full Text Sources
Medical
Molecular Biology Databases
Miscellaneous
