. 2019 Jun 28;10(1):2864.
doi: 10.1038/s41467-019-10891-w.

Tethering of vesicles to the Golgi by GMAP210 controls LAT delivery to the immune synapse

Affiliations

Tethering of vesicles to the Golgi by GMAP210 controls LAT delivery to the immune synapse

Andres Ernesto Zucchetti et al. Nat Commun. .

Abstract

The T cell immune synapse is a site of intense vesicular trafficking. Here we show that the golgin GMAP210, known to capture vesicles and organize membrane traffic at the Golgi, is involved in the vesicular transport of LAT to the immune synapse. Upon activation, more GMAP210 interact with LAT-containing vesicles and go together with LAT to the immune synapse. Regulating LAT recruitment and LAT-dependent signaling, GMAP210 controls T cell activation. Using a rerouting and capture assay, we show that GMAP210 captures VAMP7-decorated vesicles. Overexpressing different domains of GMAP210, we also show that GMAP210 allows their specific delivery to the immune synapse by tethering LAT-vesicles to the Golgi. Finally, in a model of ectopic expression of LAT in ciliated cells, we show that GMAP210 tethering activity controls the delivery of LAT to the cilium. Hence, our results reveal a function for the golgin GMAP210 conveying specific vesicles to the immune synapse.


Conflict of interest statement

The authors declare no competing interests.

Figures
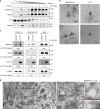
Fig. 1
Fig. 1
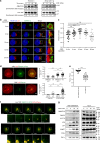
GMAP210 is present in membranes purified from T lymphocytes and containing LAT. a JCAM2.5 LAT-deficient T-cells expressing a chimeric mouse LAT coupled to two Strep-Tag (LAT-TST) were mechanically disrupted. The membrane fraction was then submitted to a floatation gradient on iodixanol. After ultracentrifugation, 10 fractions from top to bottom were collected and submitted to SDS–PAGE and Western blot analysis. b Transmission electron microscopy performed on membranes from fraction 3 showing an immunogold staining for LAT (6 nm gold particles) and GMAP210 (10 nm gold particles). Scale bar: 50 nm. c Fraction 3 prepared from JCAM2.5 (JCAM) or JCAM2.5 expressing LAT-TST (LAT-TST) were prepared as in a. They were mixed with Strep-Tactin Sepharose and submitted to SDS–PAGE and Western blot analysis. The presence of GMAP210, GM130, LAT-TST, and VAMP7 in: the fraction 3 before precipitation; the Strep-Tactin precipitates (StepTactin); and the total lysates obtained in the presence of detergent (Lysate), are shown. Ratios showing the relative expression of the different proteins in JCAM2.5 expressing LAT-TST as compared to the expression in JCAM2.5 are presented under each WB (LAT-TST/JCAM). d Transmission electron microscopy images of fixed Jurkat cells overexpressing LAT showing an immunogold staining for LAT (6 nm gold particles) and GMAP210 (10 nm gold particles); c centriole; g Golgi apparatus. Red arrows show small vesicles presenting both LAT and GMAP210 staining, blue arrows show a bigger vesicle “capping” a centriole. White Scale bar: 1 μm, gray scale bar: 500 nm, black scale bar: 200 nm. Data represent three independent experiments (a) and one experiment (bd)
Fig. 2
Fig. 2
GMAP210 is recruited together with LAT at the immune synapse. a JCAM2.5 LAT-deficient T-cells expressing LAT-TST were activated for different time with anti-CD3ε+antiCD28, mechanically disrupted and membrane fractions were purified. Presence of GMAP210 and LAT-TST in fraction 3 and in precipitates (StepTactin), are shown. LAT-TST and GMAP210 intensities were quantified and expressed as fold increase of time 0. b Confocal images performed on Jurkat T-Raji conjugates (in blue) and pulsed with SEE for 0, 5, 10, 15 and 30 min, showing the relative localization of LAT and GMAP210. Images show the maximum intensity from z-projections of three–four z-stacks covering the GMAP210 staining. White scale bars: 5 μm, gray scale bars: 500 nm. c Quantification of GMAP210/LAT colocalization. Each dot = one cell; horizontal lines = median. *P < 0.05, ****P < 0.0001, ns = non-significant (one-way ANOVA). d TIRFM images of Jurkat cells incubated for 10 min on coverslips coated with anti-CD3ε+anti-CD28, before fixation and staining for LAT, GMAP210-GFP, or GM130, scale bars: 5 μm. Dot plots show the quantification of the number of punctas/µm2 formed by the different molecules in the evanescent field (right). Poly-l-Lysine (Poly-Lys) alone (resting conditions) or anti-CD3/CD28 (α-CD3ε α-CD28) immune synapse formation. e Quantification of the colocalization of LAT with GMAP210 or GM130. Each dot = one cell; horizontal lines = median. ****P < 0.0001, ns: non-significant (one-way ANOVA). f Live TIRF imaging of the recruitment of LAT and GMAP210 at the immune synapse. Jurkat cells co-expressing GMAP210-GFP and LAT-mCherry were seeded on coverslips coated with anti-CD3ε+antiCD28. White squares indicate the magnified regions presented underneath that show the simultaneous appearance and displacement of LAT and GMAP210 in the evanescent field. White scale bars: 5 μm, gray scale bars: 2 μm. f Immunoblot of signalosomes prepared from Jurkat cells activated for 0, 5, 10 or 15 min with magnetic beads coated with mAb to CD3 and to CD28 (above blots). Proteins attached to the beads were purified by magnetic sorting after freezing and thawing of the cells. Presence of the different proteins in the corresponding cell lysates (with detergent) are shown in “input” lanes. Dashed line indicates a separate experiment. Data represent more than three experiments (g), two experiments (f), and one experiment (ae)
Fig. 3
Fig. 3
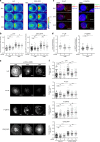
GMAP210 expression controls formation of the immune synapse. a, b Confocal images a and quantification b of the enrichment of LAT (left pannel) and CD3ζ-GFP (rigth pannel) at the immune synapse (depicted by the dotted white line) in Jurkat “mean cells” expressing non-targeting control ShRNA c or GMAP210-targeting ShRNA (3 and 8) and interacting for 30 min with Raji cells left unpulsed (−, unactivated state) or pulsed with SEE (+, immune synapse formation). N = number of cells constituting the mean image. Horizontal lines represent median. c and d Confocal images of conjugates of Jurkat cells expressing control (C) or GMAP210-specific shRNA (3 and 8) and SEE-pulsed Raji B cells (blue) labeled with anti-phospho LAT (P-LAT, showed in green, left pannel) or anti-phospho-ZAP70 (P-ZAP, showed in green, right pannel) and anti-GMAP210 (red) antibodies, assessed at 30 min c, and quantification d of the mean fluorescence intensity of P-LLAT and P-ZAP70, assessed in a fixed region of the immunimmune synapse and divided by the average of the mean intensities measured in three regions of the same size at the plasma membrane outside of the IS. Horizontal lines represent median. e TIRF images of endogenous LAT, P-LAT, P-ZAP70, or CD3ζ-GFP in Jurkat cells expressing non-targeting control ShRNA c or GMAP210-specific ShRNA (3, 8), incubated for 10 min on coverslips coated with poly-l-Lysine alone (resting conditions) or anti-CD3ε+antiCD28 Abs (α-CD3 α-CD28, activating conditions) before fixation and staining. f Quantification, in the evanescent field, of the density of the number of punctas of different proteins and phospho-proteins in Jurkat cells. Each dot = one cell; horizontal lines = median. Scale bars = 5 μm, **P < 0.01, ****P < 0.0001, ns: non-significant (one-way ANOVA). Data are from two independent experiments in a, b, c, and d and three independent experiments in e and f
Fig. 4
Fig. 4
GMAP210 silencing inhibits activation of T lymphocytes. a Immunoblot analysis of signalosomes prepared from Jurkat cells expressing control (C) or GMAP210 specific ShRNA (3, 8) activated for 0, or 10 min with magnetic beads coated with mAb to CD3ε and to CD28 (above blots). Proteins attached to the beads were purified by magnetic sorting after freezing and thawing of the cells without detergent (anti-CD3/CD28). Presence of the different proteins in the corresponding cell lysates are shown in “input” lanes. b Quantification of PLCγ, SLP-76, LAT, and VAMP7 band intensities at 10 min of activation and normalized on CD3ζ intensity band. c and e Enzyme-linked immunosorbent assay of IL-2 in supernatants of Jurkat cells (c) or IFN-γ in human primary CD4+ T cells (e) expressing control (circle) or GMAP210-specific ShRNA (triangle) and activated for 6 h by Raji B cells pulsed with various concentrations (horizontal axis) of SEE (c, Jurkat T cells) or anti-CD3 in the presence of 10 μg/mL of anti-CD28 (e, human primary T cells). d Quantitative PCR analysis of IL-2 in Jurkat cells activated as in c). f Enzyme-linked immunosorbent assay of IFN-γ in supernatants of human primary CD4+ T cells expressing control (ShC) or GMAP210-specific ShRNA (Sh3 and Sh8) and activated for 6 h with a combination of PMA+ionomycin that bypasses LAT-signaling. *P < 0.05, **P < 0.01, ***P < 0.001, ****P < 0.0001, ns: non-significant (paired parametric t-tests, one tail). Mean is represented by horizontal lines in b and each experiment is represented by one color. Data represent between three and five experiments in a, b, c, and e, and three experiments in d and f
Fig. 5
Fig. 5
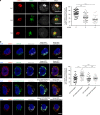
GMAP210 captures vesicles carrying VAMP7. a Confocal images showing the relative localization of VAMP7 (green) and CTR433 (red) in Jurkat cells expressing control (ShC) or GMAP210 specific shRNA (Sh3, Sh8) (GMAP210, nucleus in gray). Dot plot on the right side of the panel show the quantification of the percentage of CTR433 (Golgi marker) overlapping with VAMP7 (Manderson coefficient). Scale bar 5 μm. Each dot = one cell; horizontal lines = median. ****P < 0.0001 (one-way ANOVA). b Confocal images showing the localization of VAMP7 or VAMP3 (red) in Jurkat cells expressing a GFP-GMAP210-ActA chimera (GFP-GMAP210-Mit) or a GFP-ActA chimera (GFP-Mit), treated for 4 h with nocodazol (5 μg/mL) (nucleus in blue and mitochondria in Gray). Dot plot on the right side of the panel shows the quantification of the percentage of VAMPs (VAMP7 or VAMP3) overlapping with the GFP staining (GFP-mit or GFP-GMAP210-mit, Manderson coefficient). Scale bar 5 μm. Each dot = one cell; horizontal lines = median. ****P < 0.0001, ns: non-significant (one-way ANOVA). Data and Images represent two independent experiments in a and b
Fig. 6
Fig. 6
IFT20 localization in the Golgi in Jurkat cells expressing different GMAP210-GFP domains. a Schematic representation of GMAP210 and fusion constructs with different IFT20-binding capacity. b Confocal images showing the relative localization of IFT20 (green) and CTR433 (red) in Jurkat cells expressing GFP, GFP-GMAP210, or different GMAP210 domains coupled to GFP. c Quantification of the ratio of IFT20 fluorescence present in the Golgi versus total fluorescence in the different conditions. Scale bar 5 μm. Each dot = one cell; horizontal lines = median. **P < 0.01, ns: non-significant (one-way ANOVA). Data and images represent two independent experiments in b and c
Fig. 7
Fig. 7
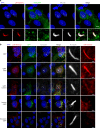
GMAP210 tethering activity controls LAT recruitment at the immune synapse. a, b Confocal images (left panels) and quantification (right panels) of the enrichment of LAT (a, b) at the immune synapse (depicted by the dotted white line) in Jurkat “mean cells” expressing GFP alone, GMAP210-GFP, or different GMAP210 domains coupled to GFP and interacting for 30 min with Raji cells left unpulsed (−, unactivated state) or pulsed with SEE (+, immune synapse formation). N = number of cells constituting the mean image. Horizontal line represents median. **P < 0.01, ***P < 0.001, ****P < 0.0001, ns: non-significant (one-way ANOVA). Data are representative from two independent experiments
Fig. 8
Fig. 8
Specific recruitment of LAT to the primary cilium depends on GMAP210 tethering activity. a Confocal images showing the localization of ARL13b (gray) and LAT-mCherry (red) or CD3ζ-GFP (green) in ciliated mIMCD-3 epithelial cells. Staining of the nucleus by DAPI in blue. White squares indicate the magnified regions presented underneath that shows the primary cilia. White scale bars: 5 μm, gray scale bars: 1.5 μm. b Confocal images showing the relative localization of LAT-mCherry (red) and acetylated-tubulin (gray), in mIMCD-3 cells co-expressing GFP alone, GMAP210-GFP, or different domains coupled to GFP. White squares indicate the magnified regions presented on the right that shows the primary cilia. White scale bars: 5 μm, gray scale bars: 1.5 μm. Images representative of two independent preparations in a and one preparation in b
Fig. 9
Fig. 9
Graphical abstract: GMAP210 facilitates the delivery of vesicles containing LAT to the immune synapse. Upon TCR triggering, LAT is internalized in recycling endosomes. This endocytic pool of LAT is “retrotransported” to the Golgi apparatus, where it meets the vesicular SNARE VAMP7 that is involved in LAT trafficking. GMAP210, which binds the Golgi through Arf1, sorts and captures the LAT/VAMP7 vesicles via its N-terminal domain (inset). The long coiled-coil domain of GMAP210 then brings LAT-containing vesicles close to the immune synapse

Similar articles

Cited by

References

    1. Grakoui A, et al. The immunological synapse: a molecular machine controlling T cell activation [see comments] Science. 1999;285:221–227. doi: 10.1126/science.285.5425.221. - DOI - PubMed
    1. Monks CR, Freiberg BA, Kupfer H, Sciaky N, Kupfer A. Three-dimensional segregation of supramolecular activation clusters in T cells. Nature. 1998;395:82–86. doi: 10.1038/25764. - DOI - PubMed
    1. Huse M, Lillemeier BF, Kuhns MS, Chen DS, Davis MM. T cells use two directionally distinct pathways for cytokine secretion. Nat. Immunol. 2006;7:247–255. doi: 10.1038/ni1304. - DOI - PubMed
    1. Chemin K, et al. Cytokine secretion by CD4+ T cells at the immunological synapse requires Cdc42-dependent local actin remodeling but not microtubule organizing center polarity. J. Immunol. 2012;189:2159–2168. doi: 10.4049/jimmunol.1200156. - DOI - PubMed
    1. Blanchard N, et al. TCR activation of human T cells induces the production of exosomes bearing the TCR/CD3/zeta complex. J. Immunol. 2002;168:3235–3241. doi: 10.4049/jimmunol.168.7.3235. - DOI - PubMed

Publication types

MeSH terms