NOTCH Activation Promotes Valve Formation by Regulating the Endocardial Secretome
- PMID: 31249105
- PMCID: PMC6731085
- DOI: 10.1074/mcp.RA119.001492
NOTCH Activation Promotes Valve Formation by Regulating the Endocardial Secretome
Abstract
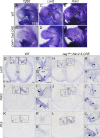
The endocardium is a specialized endothelium that lines the inner surface of the heart. Functional studies in mice and zebrafish have established that the endocardium is a source of instructive signals for the development of cardiac structures, including the heart valves and chambers. Here, we characterized the NOTCH-dependent endocardial secretome by manipulating NOTCH activity in mouse embryonic endocardial cells (MEEC) followed by mass spectrometry-based proteomics. We profiled different sets of soluble factors whose secretion not only responds to NOTCH activation but also shows differential ligand specificity, suggesting that ligand-specific inputs may regulate the expression of secreted proteins involved in different cardiac development processes. NOTCH signaling activation correlates with a transforming growth factor-β2 (TGFβ2)-rich secretome and the delivery of paracrine signals involved in focal adhesion and extracellular matrix (ECM) deposition and remodeling. In contrast, NOTCH inhibition is accompanied by the up-regulation of specific semaphorins that may modulate cell migration. The secretome protein expression data showed a good correlation with gene profiling of RNA expression in embryonic endocardial cells. Additional characterization by in situ hybridization in mouse embryos revealed expression of various NOTCH candidate effector genes (Tgfβ2, Loxl2, Ptx3, Timp3, Fbln2, and Dcn) in heart valve endocardium and/or mesenchyme. Validating these results, mice with conditional Dll4 or Jag1 loss-of-function mutations showed gene expression alterations similar to those observed at the protein level in vitro These results provide the first description of the NOTCH-dependent endocardial secretome and validate MEEC as a tool for assaying the endocardial secretome response to a variety of stimuli and the potential use of this system for drug screening.
Keywords: Cardiac Valve; Cardiovascular Function or Biology; Developmental Biology; EMT; Endocardium; NOTCH; RNA SEQ; Secretome; Signal Transduction.
© 2019 Torregrosa-Carrión et al.
Conflict of interest statement
The authors declare that they have no conflict of interest
Figures


Similar articles
-
Endocardial to myocardial notch-wnt-bmp axis regulates early heart valve development.PLoS One. 2013;8(4):e60244. doi: 10.1371/journal.pone.0060244. Epub 2013 Apr 1. PLoS One. 2013. PMID: 23560082 Free PMC article.
-
Sequential Ligand-Dependent Notch Signaling Activation Regulates Valve Primordium Formation and Morphogenesis.Circ Res. 2016 May 13;118(10):1480-97. doi: 10.1161/CIRCRESAHA.115.308077. Epub 2016 Apr 7. Circ Res. 2016. PMID: 27056911
-
Bmp2 and Notch cooperate to pattern the embryonic endocardium.Development. 2018 Jul 2;145(13):dev163378. doi: 10.1242/dev.163378. Development. 2018. PMID: 29853617
-
The oncogenic role of Jagged1/Notch signaling in cancer.Biomed Pharmacother. 2020 Sep;129:110416. doi: 10.1016/j.biopha.2020.110416. Epub 2020 Jun 25. Biomed Pharmacother. 2020. PMID: 32593969 Review.
-
Notch signaling in cardiac valve development and disease.Birth Defects Res A Clin Mol Teratol. 2011 Jun;91(6):449-59. doi: 10.1002/bdra.20815. Epub 2011 May 11. Birth Defects Res A Clin Mol Teratol. 2011. PMID: 21563298 Review.
Cited by
-
Reactivation of Notch signaling is required for cardiac valve regeneration.Sci Rep. 2019 Nov 5;9(1):16059. doi: 10.1038/s41598-019-52558-y. Sci Rep. 2019. PMID: 31690782 Free PMC article.
-
Endocardial Regulation of Cardiac Development.J Cardiovasc Dev Dis. 2022 Apr 19;9(5):122. doi: 10.3390/jcdd9050122. J Cardiovasc Dev Dis. 2022. PMID: 35621833 Free PMC article. Review.
-
Notch in mechanotransduction - from molecular mechanosensitivity to tissue mechanostasis.J Cell Sci. 2020 Dec 21;133(24):jcs250738. doi: 10.1242/jcs.250738. J Cell Sci. 2020. PMID: 33443070 Free PMC article. Review.
-
From phenotype to mechanism: Prenatal spectrum of NKAP mutation-related disorder and its pathogenesis inducing congenital heart disease.J Cell Mol Med. 2024 Apr;28(8):e18305. doi: 10.1111/jcmm.18305. J Cell Mol Med. 2024. PMID: 38647244 Free PMC article.
-
Post-Transcriptional Regulation of Molecular Determinants during Cardiogenesis.Int J Mol Sci. 2022 Mar 4;23(5):2839. doi: 10.3390/ijms23052839. Int J Mol Sci. 2022. PMID: 35269981 Free PMC article. Review.
References
-
- Ma L., Lu M. F., Schwartz R. J., and Martin J. F. (2005) Bmp2 is essential for cardiac cushion epithelial-mesenchymal transition and myocardial patterning. Development 132, 5601–5611 - PubMed
-
- Del Monte G., Grego-Bessa J., Gonzalez-Rajal A., Bolos V., and De La Pompa J. L. (2007) Monitoring Notch1 activity in development: Evidence for a feedback regulatory loop. Dev. Dyn. 236, 2594–2614 - PubMed
-
- Luna-Zurita L., Prados B., Grego-Bessa J., Luxán G., del Monte G., Benguría A., Adams R. H., Pérez-Pomares J. M., and de la Pompa J. L. (2010) Integration of a Notch-dependent mesenchymal gene program and Bmp2-driven cell invasiveness regulates murine cardiac valve formation. J. Clin. Invest. 120, 3493–3507 - PMC - PubMed
-
- Papoutsi T., Luna-Zurita L., Prados B., Zaffran S., and de la Pompa J. L. (2018) Bmp2 and Notch cooperate to pattern the embryonic endocardium. Development 145, pii - PubMed
Publication types
MeSH terms
Substances
LinkOut - more resources
Full Text Sources
Miscellaneous

