. 2019 Aug 16;294(33):12472-12482.
doi: 10.1074/jbc.RA119.007763. Epub 2019 Jun 27.

Absinthin, an agonist of the bitter taste receptor hTAS2R46, uncovers an ER-to-mitochondria Ca2+-shuttling event

Affiliations

Absinthin, an agonist of the bitter taste receptor hTAS2R46, uncovers an ER-to-mitochondria Ca2+-shuttling event

Maria Talmon et al. J Biol Chem. .

Abstract

Type 2 taste receptors (TAS2R) are G protein-coupled receptors first described in the gustatory system, but have also been shown to have extraoral localizations, including airway smooth muscle (ASM) cells, in which TAS2R have been reported to induce relaxation. TAS2R46 is an unexplored subtype that responds to its highly specific agonist absinthin. Here, we first demonstrate that, unlike other bitter-taste receptor agonists, absinthin alone (1 μm) in ASM cells does not induce Ca2+ signals but reduces histamine-induced cytosolic Ca2+ increases. To investigate this mechanism, we introduced into ASM cells aequorin-based Ca2+ probes targeted to the cytosol, subplasma membrane domain, or the mitochondrial matrix. We show that absinthin reduces cytosolic histamine-induced Ca2+ rises and simultaneously increases Ca2+ influx into mitochondria. We found that this effect is inhibited by the potent human TAS2R46 (hTAS2R46) antagonist 3β-hydroxydihydrocostunolide and is no longer evident in hTAS2R46-silenced ASM cells, indicating that it is hTAS2R46-dependent. Furthermore, these changes were sensitive to the mitochondrial uncoupler carbonyl cyanide p-(trifluoromethoxy)phenyl-hydrazone (FCCP); the mitochondrial calcium uniporter inhibitor KB-R7943 (carbamimidothioic acid); the cytoskeletal disrupter latrunculin; and an inhibitor of the exchange protein directly activated by cAMP (EPAC), ESI-09. Similarly, the β2 agonist salbutamol also could induce Ca2+ shuttling from cytoplasm to mitochondria, suggesting that this new mechanism might be generalizable. Moreover, forskolin and an EPAC activator mimicked this effect in HeLa cells. Our findings support the hypothesis that plasma membrane receptors can positively regulate mitochondrial Ca2+ uptake, adding a further facet to the ability of cells to encode complex Ca2+ signals.

Keywords: airway smooth muscle; asthma; bitter taste receptors; bronchodilator; calcium; cell signaling; intracellular calcium release; mitochondria; mitochondrial calcium; signal transduction; smooth muscle; type 2 taste receptor (TAS2R).


Conflict of interest statement

The authors declare that they have no conflicts of interest with the contents of this article

Figures
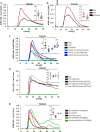
Figure 1.
Figure 1.
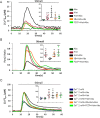
Absinthin reduces histamine-induced Ca2+ transients. Data are illustrated in representative traces as well as in scatter plots expressing the mean ± S.D. of maximum peak of cytosolic Ca2+ release. A and B, fura-2–loaded ASM cells were stimulated with histamine (Hist) 10 μm and absinthin (Abs) 10 μm alone or combined, in the presence of calcium (A, Student's t test, t(12) = 2.57, tcr = 2.17; °, p = 0.024) or in Ca2+-free conditions (EGTA 100 μm) (B, Welch's t test, t(9.13) = 2.39, tcr = 2.26; *, p = 0.040). C, ASM cells stimulated with histamine (Hist, 10 μm), absinthin (Abs, 10 μm) and increasing concentrations of receptor antagonist 3HDC (0.1, 1, 10 μm). A linear regression confirmed a statistically significant increasing trend in cytosolic free calcium response determined by 3HDC (F(1,20) = 16.45, Fcr = 4.35; °°°, p = 6.17·10−4), whereas no significant difference was found between Hist and 3HDC (10 μm)+Hist+Abs (Student's t test, t(10) = 0.13, tcr = 2.23, p = 0.90). D, cytosolic calcium release measurement in nonexpressing hTAS2R46 HeLa cells stimulated with histamine (Hist, 100 μm) and absinthin at the indicated concentrations. No significant relation emerged by linearly regressing cytosolic free calcium against increasing doses of Abs (F(1,16) = 0.009, Fcr = 4.49, p = 0.93). E, ASM cells infected with LVs carrying shRNA-hTAS2R46 and treated as in A. Absinthin modulation of histamine-induced calcium release was analyzed in the two cellular models through a two-way ANOVA. The presence of a statistically significant interaction between the two factors (F(1,14) = 11.40, Fcr = 4.6, p = 0.0045) reflects the simple main effects for which the significant decrease in cytosolic calcium following absinthin addition observed in ASM (°°°, p = 7.01·10−4) completely vanished when moving to ASM shRNA-hTAS2R46 model (p = 0.62).
Figure 2.
Figure 2.
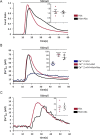
Absinthin does not affect subplasma membrane histamine-induced calcium transients. A, cytosolic Ca2+ variations in ASM cells infected with LV expressing cytAEQ after treatment with histamine (Hist, 10 μm) and/or absinthin (Abs, 10 μm) alone, or in combination. One-way ANOVA (F(2,17) = 22.04, Fcr = 3.59, p = 1.9·10−5) with Dunnett's multiple comparison test versus Hist, °°°, p = 1.6·10−5; **, p = 0.0016. B, subplasma membrane Ca2+ variations in ASM cells infected with LV expressing pmAEQ. Kruskal-Wallis H test (H(3) = 12.94, Hcr = 7.81, p = 0.0048) with Dunn's multiple comparison test: Hist versus Ca2+ 2 mm °, p < 0.012; Hist+Abs versus Ca2+ 2 mm *, p = 0.015; Hist+Abs versus Hist p = 0.94. Data are illustrated in representative traces as well as in scatter plots expressing the mean ± S.D. of maximum peak of Ca2+ release.
Figure 3.
Figure 3.
Absinthin potentiates mitochondrial histamine-induced calcium transients. A, mitochondrial calcium concentrations in ASM cells infected with LV expressing mitAEQ after treatment with histamine (Hist, 10 μm), absinthin (Abs, 10 μm), KB-R7943 (10 μm), FCCP (10 μm). One-way ANOVA (F(3,24) = 5.02, Fcr = 3.00, p = 0.0076) with Dunnett's multiple comparison test versus Hist+Abs, ⋀⋀, p = 0.0022; *, p = 0.038; °, p = 0.033. B, cytosolic Ca2+ changes using identical conditions to (A) but determined by Fura-2. One-way ANOVA (F(3,20) = 6.23, Fcr = 3.10, p = 0.0037) with Tukey's multiple comparison test: Hist versus Hist+Abs , p = 0.027; KB+Hist+Abs versus Hist+Abs *, p = 0.039; FCCP+Hist+Abs versus Hist+Abs °°, p = 0.0023; KB+Hist+Abs versus Hist p = 0.99; FCCP+Hist+Abs versus Hist p = 0.65. C, subplasma membrane Ca2+ variations using identical conditions to (A). Kruskal-Wallis H test (H(5) = 16.42, Hcr = 11.07, p = 0.0057) with Dunn's multiple comparison test: all versus Ca2+ 2 mm, ⋀⋀, p = 0.0059; *, p = 0.016; °°, p = 0.008; +, p = 0.027. All the comparisons involving KB+Hist+Abs or FCCP+Hist+Abs versus both Hist and Hist+Abs did not show statistically significant differences (p ≥ 0.82). Data are illustrated in representative traces as well as in scatter plots expressing the mean ± S.D. of maximum peak of Ca2+ release.
Figure 4.
Figure 4.
Effect of actin filament disruption on absinthin modulation of histamine-induced Ca2+ transients. A, fura-2–loaded ASM cells were stimulated with histamine (Hist) 10 μm with or without absinthin (Abs) 10 μm in the presence of latrunculin A (10 μm for 1 h). Student's t test, t(6) = 0.44, tcr = 2.45, p = 0.68. B, subplasma membrane Ca2+ variations using identical conditions to (A). One-way ANOVA (F(2,10) = 34.06, Fcr = 4.10, p = 3.44·10−5) with Tukey's multiple comparison test: Hist versus Ca2+ 2 mm ****, p = 5.66·10−5; Hist+Abs versus Ca2+ 2 mm ***, p = 0.0004; Hist versus Hist+Abs p = 0.19. C, mitochondrial calcium concentrations using identical conditions to (A). Student's t test, t(9) = 0.067, tcr = 2.26, p = 0.95. Data are illustrated in representative traces as well as in scatter plots expressing the mean ± S.D. of maximum peak of Ca2+ release.
Figure 5.
Figure 5.
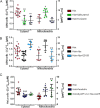
cAMP and EPAC modulation on cytosolic and mitochondrial calcium transients. Values of cytosolic calcium peaks are plotted on left Y axes, and the mitochondrial ones are plotted on right Y axes. Because the two continuous (dependent) variables [Ca2+]cyt and [Ca2+]mit are not directly comparable, cytosolic and mitochondrial data sets were analyzed independently. In any case, data are illustrated in scatter plots expressing the mean ± S.D. of maximum peak of Ca2+ release. A, cytosolic and mitochondrial calcium concentrations in ASM cells infected with LV expressing cytAEQ or mitAEQ after treatment with histamine (Hist, 10 μm) alone or with salbutamol (10 μm), or forskolin (10 μm). One-way ANOVA (cytosol F(2,18) = 10.62, Fcr = 3.55, p = 8.99·10−4; mitochondria F(2,13) = 9.85, Fcr = 3.81, p = 0.0025) with Dunnett's multiple comparison test versus respective Hist, °°, p = 0.0017; **, p = 0.0080; , p = 0.025. B, cytosolic and mitochondrial calcium concentrations in ASM cells infected with LV expressing cytAEQ or mitAEQ after treatment with histamine (Hist, 10 μm) with or without absinthin (Abs, 10 μm) and a pan-EPAC inhibitor (ESI-09, 10 μm). One-way ANOVA (cytosol F(2,33) = 15.61, Fcr = 3.28, p = 1.69·10−5; mitochondria F(2,13) = 6.48, Fcr = 3.81, p = 0.011) with Dunnett's multiple comparison test versus respective Hist+Abs, °, p = 0.019; ****, p = 1.13·10−5; , p = 0.016; ++, p = 0.0098. C, cytosolic and mitochondrial calcium concentration in HeLa cells infected with LV expressing cytAEQ or mitAEQ after treatment with histamine (Hist, 100 μm), alone or with forskolin (20 μm), or 8-pCPT-2′-O-Me-cAMP (10 μm). Cytosol: One-way ANOVA, F(2,23) = 10.65, Fcr = 3.42, p = 5.3·10−4; with Dunnett's multiple comparison test versus Hist, °°°, p = 0.0003; *, p = 0.040. Mitochondria: Kruskal-Wallis H test (H(2) = 9.87, Hcr = 5.99, p = 0.0072) with Dunn's multiple comparison test, , p = 0.012; ++, p = 0.0079; both versus Hist.

Similar articles

Cited by

References

    1. Lush I. E., Hornigold N., King P., and Stoye J. P. (1995) The genetics of tasting in mice. VII. Glycine revisited, and the chromosomal location of Sac and Soa. Genet. Res. 66, 167–174 10.1017/S0016672300034510 - DOI - PubMed
    1. Bachmanov A. A., Inoue M., Ji H., Murata Y., Tordoff M. G., and Beauchamp G. K. (2009) Glutamate taste and appetite in laboratory mice: Physiologic and genetic analyses. Am. J. Clin. Nutr. 90, 756S–763S 10.3945/ajcn.2009.27462L - DOI - PMC - PubMed
    1. Adler E., Hoon M. A., Mueller K. L., Chandrashekar J., Ryba N. J., and Zuker C. S. (2000) A novel family of mammalian taste receptors. Cell 100, 693–702 10.1016/S0092-8674(00)80705-9 - DOI - PubMed
    1. Chandrashekar J., Mueller K. L., Hoon M. A., Adler E., Feng L., Guo W., Zuker C. S., and Ryba N. J. (2000) T2Rs function as bitter taste receptors. Cell 100, 703–711 10.1016/S0092-8674(00)80706-0 - DOI - PubMed
    1. Meyerhof W. (2005) Elucidation of mammalian bitter taste. Rev. Physiol. Biochem. Pharmacol. 154, 37–72 10.1007/s10254-005-0041-0 - DOI - PubMed

Publication types

MeSH terms

Substances