. 2019 Oct 1;454(1):15-20.
doi: 10.1016/j.ydbio.2019.06.016. Epub 2019 Jun 21.

Fndc-1 contributes to paternal mitochondria elimination in C. elegans

Affiliations

Fndc-1 contributes to paternal mitochondria elimination in C. elegans

Yunki Lim et al. Dev Biol. .

Abstract

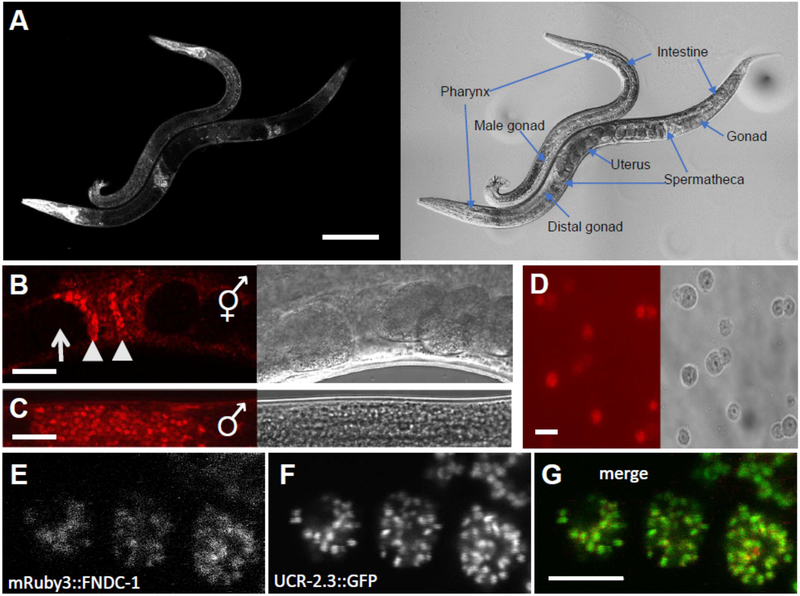
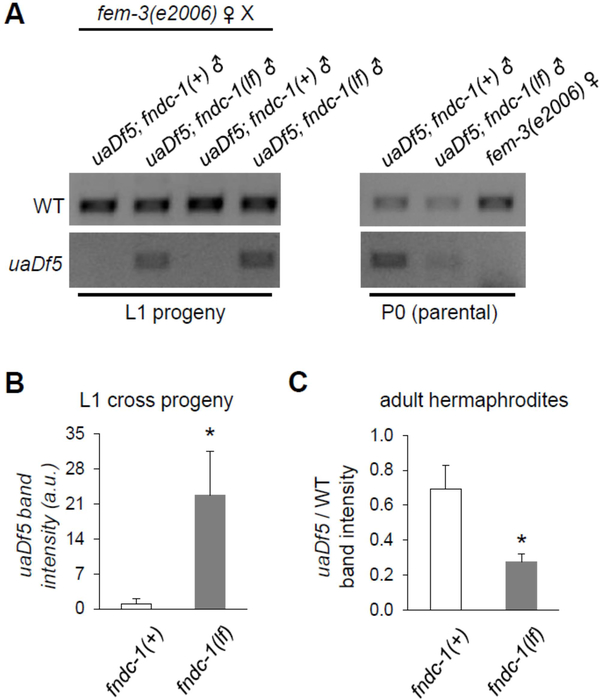
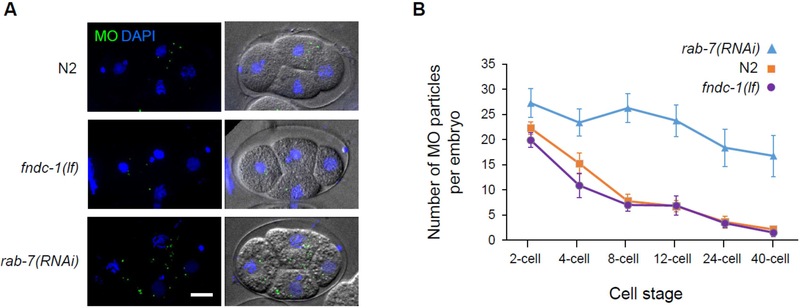
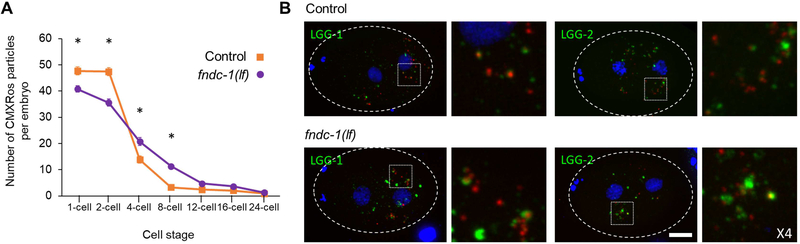
Paternal mitochondria are eliminated following fertilization by selective autophagy, but the mechanisms that restrict this process to sperm-derived organelles are not well understood. FUNDC1 (FUN14 domain containing 1) is a mammalian mitophagy receptor expressed on the mitochondrial outer membrane that contributes to mitochondrial quality control following hypoxic stress. Like FUNDC1, the C. elegans ortholog FNDC-1 is widely expressed in somatic tissues and mediates hypoxic mitophagy. Here, we report that FNDC-1 is strongly expressed in sperm but not oocytes and contributes to paternal mitochondria elimination. Paternal mitochondrial DNA is normally undetectable in wildtype larva, but can be detected in the cross-progeny of fndc-1 mutant males. Moreover, loss of fndc-1 retards the rate of paternal mitochondria degradation, but not that of membranous organelles, a nematode specific membrane compartment whose fusion is required for sperm motility. This is the first example of a ubiquitin-independent mitophagy receptor playing a role in the selective degradation of sperm mitochondria.

Keywords: Autophagy; C. elegans; Maternal inheritance; Mitochondria; Mitophagy.


Figures

Figure 1 –
Figure 1 –. FNDC-1 is expressed in spermatids and targeted to mitochondria.
mRuby3 red fluorescent protein sequence was inserted into the N-terminal genomic coding region of fndc-1 using CRISPR-Cas9 editing and HDR. Images in panels A - D contain both fluorescence (left) and differential contrast interference (right). A Intestine, body wall muscles, and pharynx of males and hermaphrodites, as labeled. Scale bar: 100 μm. B Hermaphrodite spermatheca. Note the lack of expression in oocytes (arrows) compared to spermatids (arrowheads). Scale bar: 20 μm. C Male gonad. Scale bar: 20 μm. D Isolated spermatids from males expressing mRuby3::FNDC-1. Scale bar: 5 μm. E Higher magnification image of mRuby3::FNDC-1 in spermatids. F Genomic single copy CRISPR-Cas9 modified ucr-2.3::GFP in the same spermatids as panel E. G Overlay of mRuby3::FNDC-1 (red) and ucr-2.3::GFP (green). Scale bar: 5 μm.
Figure 2 -
Figure 2 -. The paternal mitochondrial genome is detectable in cross progeny of fndc-1(lf) males.
uaDf5 is a mitochondrial haplotype with a large deletion in the mitochondrial genome that can be detected by PCR. A The first four lanes contain ethidium bromide stained gel-separated PCR products from ~100 L1 cross-progeny of fem-3(e2006) females that had been mated to either fndc-1(+) or fndc-1(lf) males containing uaDf5 mtDNA. These data are two replicates of six indepenent experiments that were performed. The second set of three lanes are similar PCR reactions from the paternal and maternal worms that were used to create the cross-progeny. Note that amplification cycles (generally 25–35) have been optimized for each of the primer combinations, whether used as pairs or in triplicate, for L1 versus P0 generations, and for multiple versus single worms (see Methods). As such, band intensities are only directly comparable within the boundaries of each image. B uaDf5 in L1 cross-progeny from fndc-1(+) or fndc-1(lf) males and fem-3(e2006) hermaphrodites. The band intensity for the uaDf5 PCR product was determined and normalized to the wildtype PCR product to control for total mtDNA content. The data represents the average values from six independent experiments (mean ± SEM; *p < 0.05; t-test). C Relative uaDf5 abundance in fndc-1(+) and fndc-1(lf) adult hermaphrodites. The data (for which the PCR reactions are not shown) represents the average values from three independent experiments (mean ± SEM; *p < 0.05; t-test).
Figure 3 –
Figure 3 –. Membranous organelles are effectively cleared in the absence of paternal FNDC-1.
A No defect in MOs elimination is observed in the absence of FNDC-1 compared to wildtype (N2) embryos. A delay in MOs elimination can be observed in the rab-7(RNAi) embryos. Maximum-intensity Z-stacks projections of fixed embryos. Wildtype (N2), fndc-1(lf) and rab-7(RNAi) 4-cell stage embryos labeled for MOs (green) and stained for DNA (blue) (left panels) and DIC images (right panels) are shown. Scale bar: 10μm. B Quantification of MO particles per cell stage in wildtype (N2) (purple), fndc-1(lf) (orange) and rab-7(RNAi) (blue) embryos (n=8 embryos per condition). Data shown in the graph corresponds to the mean ± SEM of MOs per embryo.
Figure 4 –
Figure 4 –. Paternal FNDC-1 facilitates mitophagy at fertilization.
A Quantification of CMXRos stained sperm mitochondria per cell stage in embryos from control (purple) and fndc-1(lf) (purple) male matings (n = 5 separate experiments with n≥15 embryos analyzed for each stage). Data shown in the graph corresponds to the mean ± SEM of CMXRos particles per embryo. *p < 0.05; t-test (p-values: 1-cell, 8.8E-04; 2-cell, 1.6E-06; 4-cell, 1.9E-03; 8-cell, 1.2E-09). B Recruitment of autophagosome markers, LGG-1 and LGG-2, around sperm-labeled mitochondria can be observed in the absence of FNDC-1. Maximum-intensity Z-stacks projections of cross-fertilized 2-cell stage embryos from wildtype unlabeled hermaphrodites and either fndc-1(lf) or control CMXRos labeled males. Embryos are labeled for LGG-1 (green; top panels) and LGG-2 (green; bottom panels); CMXRos was used to label sperm mitochondria (red) and DAPI to visualize DNA (blue). For clarity, 4-fold magnifications of the highlighted areas are shown in the right panels. However, the entire embryo was analyzed to generate the quantitative data presented in panel A. Scale bar: 10μm.

Similar articles

Cited by

  • Effects of reactive oxygen species and mitochondrial dysfunction on reproductive aging.
    Song J, Xiao L, Zhang Z, Wang Y, Kouis P, Rasmussen LJ, Dai F. Song J, et al. Front Cell Dev Biol. 2024 Feb 23;12:1347286. doi: 10.3389/fcell.2024.1347286. eCollection 2024. Front Cell Dev Biol. 2024. PMID: 38465288 Free PMC article. Review.
  • Deletion of FUNDC2 and CMC4 on Chromosome Xq28 Is Sufficient to Cause Hypergonadotropic Hypogonadism in Men.
    Deng X, Fang H, Pathak A, Zou AM, Neufeld-Kaiser W, Malouf EA, Failor RA, Hisama FM, Liu YJ. Deng X, et al. Front Genet. 2020 Sep 22;11:557341. doi: 10.3389/fgene.2020.557341. eCollection 2020. Front Genet. 2020. PMID: 33193636 Free PMC article.
  • Molecular Mechanisms and Regulation of Mammalian Mitophagy.
    Choubey V, Zeb A, Kaasik A. Choubey V, et al. Cells. 2021 Dec 23;11(1):38. doi: 10.3390/cells11010038. Cells. 2021. PMID: 35011599 Free PMC article. Review.
  • Mitophagy of polarized sperm-derived mitochondria after fertilization.
    Rubio-Peña K, Al Rawi S, Husson F, Lam F, Merlet J, Galy V. Rubio-Peña K, et al. iScience. 2020 Dec 31;24(1):102029. doi: 10.1016/j.isci.2020.102029. eCollection 2021 Jan 22. iScience. 2020. PMID: 33506190 Free PMC article.
  • Guidelines for the use and interpretation of assays for monitoring autophagy (4th edition)1.
    Klionsky DJ, Abdel-Aziz AK, Abdelfatah S, Abdellatif M, Abdoli A, Abel S, Abeliovich H, Abildgaard MH, Abudu YP, Acevedo-Arozena A, Adamopoulos IE, Adeli K, Adolph TE, Adornetto A, Aflaki E, Agam G, Agarwal A, Aggarwal BB, Agnello M, Agostinis P, Agrewala JN, Agrotis A, Aguilar PV, Ahmad ST, Ahmed ZM, Ahumada-Castro U, Aits S, Aizawa S, Akkoc Y, Akoumianaki T, Akpinar HA, Al-Abd AM, Al-Akra L, Al-Gharaibeh A, Alaoui-Jamali MA, Alberti S, Alcocer-Gómez E, Alessandri C, Ali M, Alim Al-Bari MA, Aliwaini S, Alizadeh J, Almacellas E, Almasan A, Alonso A, Alonso GD, Altan-Bonnet N, Altieri DC, Álvarez ÉMC, Alves S, Alves da Costa C, Alzaharna MM, Amadio M, Amantini C, Amaral C, Ambrosio S, Amer AO, Ammanathan V, An Z, Andersen SU, Andrabi SA, Andrade-Silva M, Andres AM, Angelini S, Ann D, Anozie UC, Ansari MY, Antas P, Antebi A, Antón Z, Anwar T, Apetoh L, Apostolova N, Araki T, Araki Y, Arasaki K, Araújo WL, Araya J, Arden C, Arévalo MA, Arguelles S, Arias E, Arikkath J, Arimoto H, Ariosa AR, Armstrong-James D, Arnauné-Pelloquin L, Aroca A, Arroyo DS, Arsov I, Artero R, Asaro DML, Aschner M, Ashrafizadeh M, Ashur-Fabian O, Atanasov AG, Au AK, Auberger P, Auner HW, Aurelian L, Autelli R… See abstract for full author list ➔ Klionsky DJ, et al. Autophagy. 2021 Jan;17(1):1-382. doi: 10.1080/15548627.2020.1797280. Epub 2021 Feb 8. Autophagy. 2021. PMID: 33634751 Free PMC article.

References

    1. Sato M, Sato K (2011) Degradation of paternal mitochondria by fertilization-triggered autophagy in C. elegans embryos. Science 334: 1141–1144. - PubMed
    1. Zhou Q, Li H, Xue D (2011) Elimination of paternal mitochondria through the lysosomal degradation pathway in C. elegans. Cell Res 21: 1662–1669. - PMC - PubMed
    1. Al Rawi S, Louvet-Vallée S, Djeddi A, Sachse M, Culetto E, Hajjar C, Boyd L, Legouis R, Galy V (2011) Postfertilization autophagy of sperm organelles prevents paternal mitochondrial DNA transmission. Science 334: 1144–1147. - PubMed
    1. Rojansky R, Cha M-Y, Chan DC (2016) Elimination of paternal mitochondria in mouse embryos occurs through autophagic degradation dependent on PARKIN and MUL1. Elife 5:. - PMC - PubMed
    1. Whitworth AJ, Pallanck LJ (2017) PINK1/Parkin mitophagy and neurodegeneration-what do we really know in vivo? Curr Opin Genet Dev 44: 47–53. - PubMed

Publication types

MeSH terms

LinkOut - more resources