. 2020 Jan 1;36(1):186-196.
doi: 10.1093/bioinformatics/btz514.

Genetic cooperativity in multi-layer networks implicates cell survival and senescence in the striatum of Huntington's disease mice synchronous to symptoms

Affiliations

Genetic cooperativity in multi-layer networks implicates cell survival and senescence in the striatum of Huntington's disease mice synchronous to symptoms

Erwan Bigan et al. Bioinformatics. .

Abstract

Motivation: Huntington's disease (HD) may evolve through gene deregulation. However, the impact of gene deregulation on the dynamics of genetic cooperativity in HD remains poorly understood. Here, we built a multi-layer network model of temporal dynamics of genetic cooperativity in the brain of HD knock-in mice (allelic series of Hdh mice). To enhance biological precision and gene prioritization, we integrated three complementary families of source networks, all inferred from the same RNA-seq time series data in Hdh mice, into weighted-edge networks where an edge recapitulates path-length variation across source-networks and age-points.

Results: Weighted edge networks identify two consecutive waves of tight genetic cooperativity enriched in deregulated genes (critical phases), pre-symptomatically in the cortex, implicating neurotransmission, and symptomatically in the striatum, implicating cell survival (e.g. Hipk4) intertwined with cell proliferation (e.g. Scn4b) and cellular senescence (e.g. Cdkn2a products) responses. Top striatal weighted edges are enriched in modulators of defective behavior in invertebrate models of HD pathogenesis, validating their relevance to neuronal dysfunction in vivo. Collectively, these findings reveal highly dynamic temporal features of genetic cooperativity in the brain of Hdh mice where a 2-step logic highlights the importance of cellular maintenance and senescence in the striatum of symptomatic mice, providing highly prioritized targets.

Availability and implementation: Weighted edge network analysis (WENA) data and source codes for performing spectral decomposition of the signal (SDS) and WENA analysis, both written using Python, are available at http://www.broca.inserm.fr/HD-WENA/.

Supplementary information: Supplementary data are available at Bioinformatics online.


Figures

Fig. 1.
Fig. 1.
Quantification of age-dependent strength of gene cooperativity in dense weighted networks. (A) Cumulative distribution of the number of Class-I or Class-II weighted edges as a function of product-P where product-P = ΔwGNS x ΔwWGCNA x ΔwBGM, for the cortex. (B) Cumulative distribution of the number of Class-I or Class-II weighted edges (left panel) and of the number of most dynamic weighted edges (right panel) as a function of product-P, for the striatum. Most dynamic edges are edges for which Δw = 1 in at least 2 dense weighted networks where Δw = 1 means a direct edge at 2 months and no edge at 10 months, and vice versa (see Supplementary Methods). The choice of threshold for product-P is based on the inflection point e of the log logistic cumulative distribution curve for most dynamic edges, here 0.26 and above (e.g. 0.3)
Fig. 2.
Fig. 2.
Distribution of log fold change values in Q175 Hdh mice at 10 months for gene nodes retained in WENA meta-networks. Shown is the distribution of log-fold-change (LFC) at 10 months in Q175 mice versus 2 months in Q20 mice (Q175/10 mo-LFC) for Class-I and Class-II genes in cortex and for Class-I, Class-II and Class-III genes in striatum. In all cases, the reference is the distribution of LFC (Q175, 10 months/Q20, 2 months) values for all genes with a statistically significant deregulation as inferred using DESeq2. (A) In the cortex (unfiltered dense weighted networks), the distribution of Q175/10 mo-LFCs for Class-I genes is statistically different (upper panel: P =5.67 × 10⁻¹³) from that for reference genes whereas the LFC distribution for Class-II genes is similar to the reference (lower panel). Bin size is 0.05. There are 34 Class-I genes, 86 Class-II genes and 18948 reference genes in the LFC distributions. (B) In the striatum (unfiltered dense weighted networks), the Q175/10 mo-LFC distribution for Class-I genes is similar to the reference (upper panel) whereas the LFC distribution is statistically different for Class-II genes (middle panel: P =1.01 × 10⁻⁴) compared to the reference. The distribution of Q175/10 mo-LFCs for Class-III genes (as instructed by unfiltered dense weighted networks) is statistically different (P =6.35 × 10⁻³) compared to the reference (lower panel). Bin size is 0.1 for the Class-I, Class-II and Class-III meta-networks. There are 306 Class-I genes, 1103 Class-II genes, 26 Class-III and 19051 reference genes in the LFC distributions
Fig. 3.
Fig. 3.
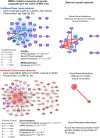
Temporal dynamics of genetic cooperativity in the cortex of Hdh mice. Shown are the unfiltered Class-I meta-network (blue nodes) containing 162 weighted edges and Class-II meta-network (red nodes) containing 271 weighted edges such that |product-P| > 0. Node size is scaled with node degree (number of neighbors). Edge thickness is scaled with product-P value. Dark (red or blue) colors indicate up-regulated genes. Light (red or blue) colors indicate down-regulated genes. Purple borders indicate genes with |LFC| > 0.5, i.e. the LFC value that distinguishes critical from non-critical phases of genetic cooperativity (see Fig. 2). Squared nodes are druggable genes. Black edges indicate that the edge is direct in at least one the source network families. Corresponding information in causal networks shows edge orientation as predicted by Bayesian causal inference with indication of the effect (blue: decrease; red: increase) of mRNA abundance of the upstream gene on that of the downstream gene. Gene-phenotype interactions are also indicated for Class-II genes, i.e. the genes associated with the most symptomatic phase of the disease process. Biological annotations (n > 10 genes, P <1 × 10⁻⁴) are inferred from STRING analysis, using high-confidence neighbors (see Supplementary Methods for settings). In the Class-I meta-network, the direct weighted edge with the highest combined values for product-P and betweenness involves Cpa6 (also the hub gene with the highest degree: see Supplementary Table S10), a carboxypeptidase that processes several neuropeptides, and Doc2g, a double-C2 protein involved in synaptic vesicle exocytosis (Yao et al., 2011). Gene–gene interaction data in causal networks (Supplementary Table S11) indicates that Doc2g may act upstream of most of the other nodes in this meta-network, including Cpa6. Consistently with the outcome of WENA, this prediction is true for Hdh mice at 6 months of age and was not detected for mice at 10 months of age. WENA further indicates that the tightness of genetic cooperativity between Doc2g and Cpa6 is maximal at 2 months of age, then is relaxed. The same applies to the other causal gene-to-gene relationships relevant to cortex at 6 months of age. Although the Cpa6-Doc2g edge is direct as predicted by WGCNA and Bayesian network analysis, BGM network data indicate that the path linking these two genes could involve Cyp39a1 and Doc2b. In the Class-II meta-network, the direct weighted edge with the highest combined values for product-P and betweenness recruits Tjp3 (also known as Zonula occludens-3; hub gene with the third highest degree value), a tight junction protein that interacts with connexins, and claudin Cldn1, a component of tight junctions, suggesting this meta-network might also regulate the plasticity of electrical synapses (Flores et al., 2008). Gene–gene interaction data in causal networks (Supplementary Table S11) indicates that Cldn1 may act upstream of Tjp3. Consistently with the WENA model, this prediction was only detected for Hdh mice at 10 months of age. WENA further indicates that cooperativity between these two genes is loose at 2 months of age, becoming tight at 10 months of age. WENA also indicates that the path linking these two genes may involve cytochrome B reductase Cybrd1 and phospholipid phosphatase Lppr1 as provided in BGM networks (see Supplementary Table S11). Gene-phenotype interactions in causal networks (see Supplementary Table S10) indicate that acyl-CoA oxidase 2 (Acox2) may negatively influence two disease phenotypes at 10 months, including locomotion bouts and the duration of locomotion
Fig. 4.
Fig. 4.
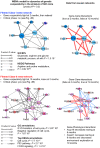
Temporal dynamics of genetic cooperativity in the striatum of Hdh mice. Shown are the Class-I meta-network (blue nodes) containing 15 weighted edges and Class-II meta-network (red nodes) containing 44 weighted edges such that |product-P| > 0.3, which selects for highly dynamic weighted edges in which there is a direct gene-to-gene interaction (SPL value of 1) in at least one of the source networks. The legend of nodes and edges and method for inference of biological annotations are the same as in Figure 3. Meta-networks are also shown for |product-P| > 0.25, providing a larger though less-selective model of the temporal dynamics of genetic cooperativity (see Supplementary Fig. S4). In the Class-I meta-network, the direct weighted edges with the highest product-P values involve two hub genes including (i) phosphodiesterase Cnp in direct interaction with four genes [mitochondrial glycine amidinotransferase Gatm, Na(+)/K(+)-transporting ATPase subunit Beta-1-interacting protein Nkain1, fatty acid elongase elov1 and transmembrane BAX inhibitor motif-containing protein Tmbim1] and (ii) myelin basic protein MBP in direct interaction with glial fibrillary acidic protein Gfap, the latter a marker of astrocytes. Cnp is an important regulator of myelination (Aguirre et al., 2007) and Mbp is a well-known and major constituent of the myelin sheath of oligodendrocytes. Gene–gene interaction data in causal networks indicate that Cnp and Mbp may act upstream of most of the other nodes in this meta-network. Consistently with the outcome of WENA, this prediction is only detected for Hdh mice at 6 months of age. WENA further indicates that the tightness of genetic cooperativity between Cnp, Mbp and their neighbors is maximal at 2 months of age then relaxed, and that causal relationships such as the one between Mbp and Cnp or between Mbp and Tmbim1 are poorly dynamic over time (product-P value less than 0.25). Finally, BGM networks indicate that this response may involve genes associated to RNA degradation and cell projection morphogenesis (see Supplementary Table S13). In the Class-II meta-network, the direct weighted edges with the highest product-P values and gene nodes with the highest degree suggest this may be primarily achieved through genetic cooperativity centered onto cAMP-regulated phosphoproteins Arpp21 and Arpp19, the sodium voltage-gated channel beta subunit Scn4b, a protein that may act as a metastasis suppressor (Bon et al., 2016) and Hipk4, a member of the homeodomain interacting kinase family, the latter a class of kinases that are associated with DNA damage response (Kuwano et al., 2016) and that is involved in cellular proliferation, differentiation and apoptosis (Kovacs et al., 2015), including in neurons (Chalazonitis et al., 2011). These four hub genes may tightly cooperate with proximal interactors such as cyclin D2 (Ccnd2), cell cycle regulators encoded by Cdkn2a (i.e. p16INK4a, p19ARF), phosphatase Ptp4a2 (also known as Prl2) which regulates the proliferation of hematopoietic stem cells (Kobayashi et al., 2014), fatty acid desaturase Fads1 which expression is modulated during neuronal differentiation (Park et al., 2012), Mgarp which is a regulator of mitochondrial distribution and motility in neurons and may contribute to dendritic atrophy when in excess (Jia et al., 2014), Frat2 which is a member of canonical Wnt signaling, ectonucleotide pyrophosphatase/phosphodiesterase Enpp3 which achieves an enzymatic activity (Gomez-Villafuertes et al., 2014) associated with neuronal differentiation and two genes associated with inflammation including Tnip3 and Rag-1, the latter an immunoglobulin recombination activation gene with a role in neuronal death (Hirano et al., 2015). Causal networks (gene–gene interactions: see Supplementary Table S13) indicate that hub genes Arpp 19, Arpp21, Hipk4 and Snc4b could act upstream to the other members in this Class-II meta-network at 10 months of age. WENA analysis further indicates that the tightness of cooperativity between these hub genes and neighbors such as Cdkn2a and Prl2 becomes maximal at 10 months of age. BGM networks indicate this may also involve regulators of splicing and (mitochondrial) translation and other genes, such as for example cyclin D2 and ion channel Trpa1 in the Hipk4-Cdkn2a path, PGC1ß and Host Cell Factor C1 Regulator 1 in the Hipk4-Mgarp path and scaffold protein Pdlim1 (CLP36) and Acyl-CoA thioesterase 1 (Acot1) in the Scn4b-Perl2 path (see Supplementary Table S13). Gene-phenotype interactions data in causal networks (see Supplementary Table S12) indicate that Arpp19 and Arpp21, two central nodes, modulate disease phenotypes at 6–10 months. Noticeably, Class-II nodes are not associated with mouse phenotypes at 2–6 months and Class-I nodes are not associated with mouse phenotypes at 10 months (see Supplementary Table S12), showing that WENA can distinguish waves of gene cooperativity associated with specific phases of disease, phenotypically. As indicated by randomization tests, the Frat2-Scn4b weighted edge may have limited robustness (see Supplementary Fig. S4B)
Fig. 5.
Fig. 5.
Class-III genes and their Class-I and Class-II neighbors in the striatum of Hdh mice

Similar articles

Cited by

References

    1. Achour M. et al. (2015) Neuronal identity genes regulated by super-enhancers are preferentially down-regulated in the striatum of Huntington’s disease mice. Hum. Mol. Genet., 24, 3481–3496. - PubMed
    1. Aguirre A. et al. (2007) A functional role for EGFR signaling in myelination and remyelination. Nat. Neurosci., 10, 990–1002. - PubMed
    1. Al-Ramahi I. et al. (2018) High-throughput functional analysis distinguishes pathogenic, nonpathogenic, and compensatory transcriptional changes in neurodegeneration. Cell Syst., 7, 28–40.e24. - PMC - PubMed
    1. Alexandrov V. et al. (2016) Large-scale phenome analysis defines a behavioral signature for Huntington’s disease genotype in mice. Nat. Biotechnol., 34, 838–844. - PubMed
    1. Bon E. et al. (2016) SCN4B acts as a metastasis-suppressor gene preventing hyperactivation of cell migration in breast cancer. Nat. Commun., 7, 13648. - PMC - PubMed

Publication types