. 2019 Sep;18(9):1615-1627.
doi: 10.1158/1535-7163.MCT-18-0706. Epub 2019 Jun 21.

Antileukemia Effects of Notch-Mediated Inhibition of Oncogenic PLK1 in B-Cell Acute Lymphoblastic Leukemia

Affiliations

Antileukemia Effects of Notch-Mediated Inhibition of Oncogenic PLK1 in B-Cell Acute Lymphoblastic Leukemia

Sankaranarayanan Kannan et al. Mol Cancer Ther. 2019 Sep.

Abstract

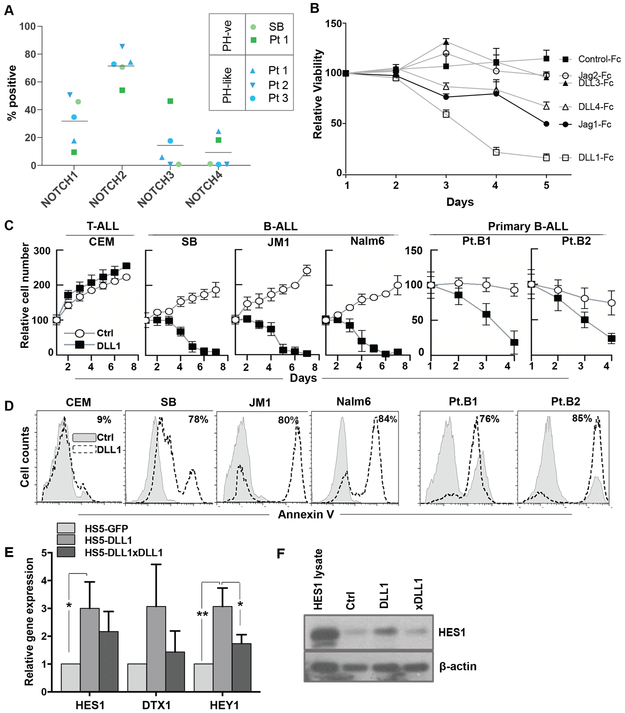
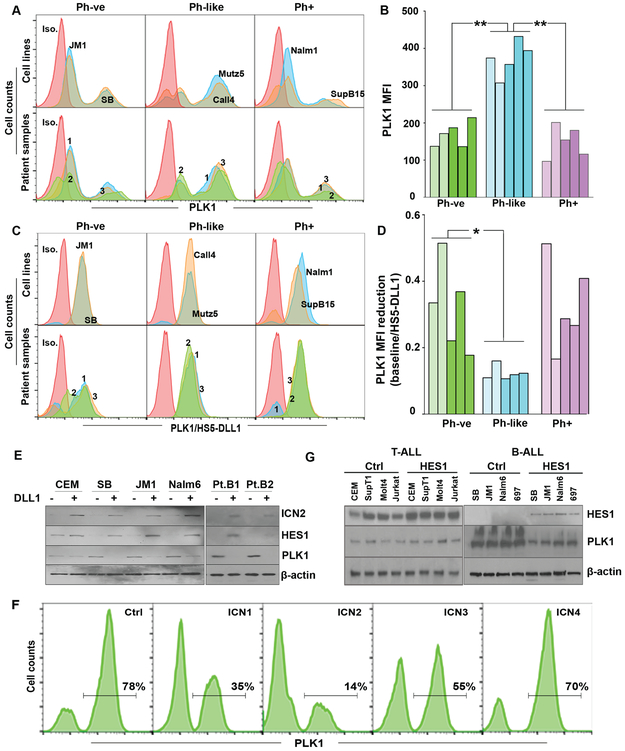
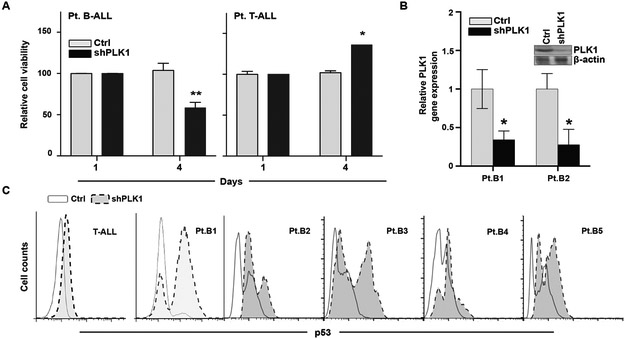
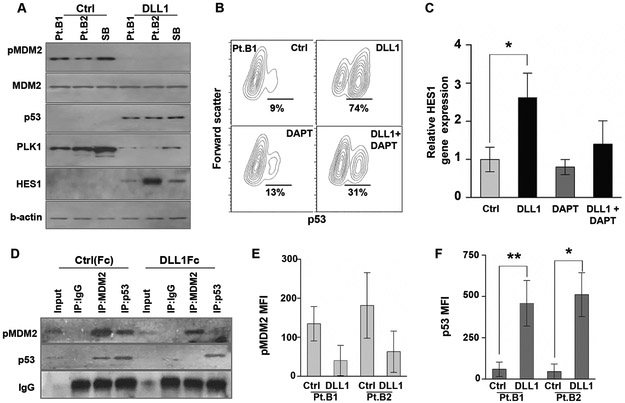
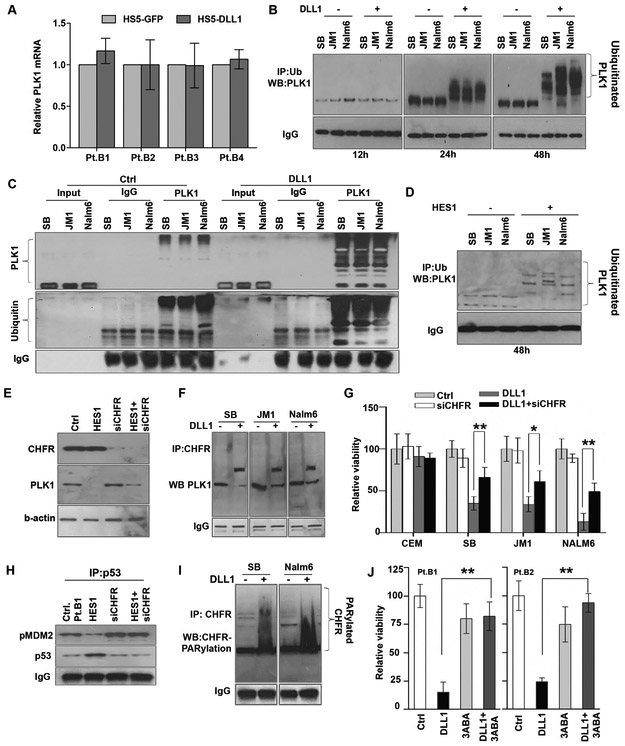
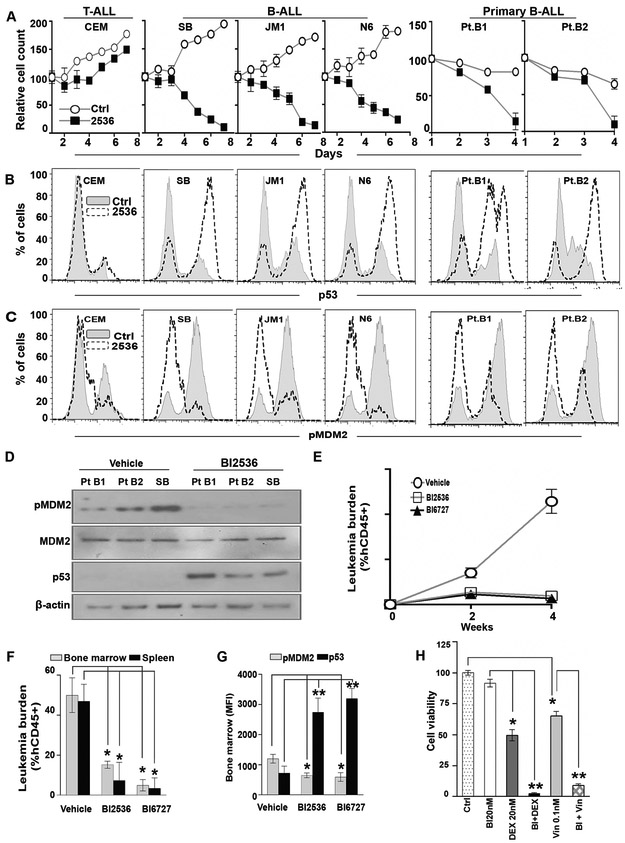
In B-cell acute lymphoblastic leukemia (B-ALL), activation of Notch signaling leads to cell-cycle arrest and apoptosis. We aimed to harness knowledge acquired by understanding a mechanism of Notch-induced cell death to elucidate a therapeutically viable target in B-ALL. To this end, we identified that Notch activation suppresses Polo-like kinase 1 (PLK1) in a B-ALL-specific manner. We identified that PLK1 is expressed in all subsets of B-ALL and is highest in Philadelphia-like (Ph-like) ALL, a high-risk subtype of disease. We biochemically delineated a mechanism of Notch-induced PLK1 downregulation that elucidated stark regulation of p53 in this setting. Our findings identified a novel posttranslational cascade initiated by Notch in which CHFR was activated via PARP1-mediated PARylation, resulting in ubiquitination and degradation of PLK1. This led to hypophosphorylation of MDM2Ser260, culminating in p53 stabilization and upregulation of BAX. shRNA knockdown or pharmacologic inhibition of PLK1 using BI2536 or BI6727 (volasertib) in B-ALL cell lines and patient samples led to p53 stabilization and cell death. These effects were seen in primary human B-ALL samples in vitro and in patient-derived xenograft models in vivo These results highlight PLK1 as a viable therapeutic target in B-ALL. Efficacy of clinically relevant PLK1 inhibitors in B-ALL patient-derived xenograft mouse models suggests that use of these agents may be tailored as an additional therapeutic strategy in future clinical studies.


Conflict of interest statement

Disclosure of Conflicts of Interest:

The authors declare no conflict of interest.

Figures

Figure 1.
Figure 1.. Notch receptors are expressed in B-ALL and Notch activation results in apoptosis.
(A) Percentage of Notch 1-4 receptor-positive cells on B-ALL patient samples and a representative cell line was determined by flow cytometry as the fraction of cells exceeding the intensity of the corresponding isotype control. Patients are represented by the same symbol for each receptor with PH-ve and PH-like subtypes discriminated by green and blue, respectively. Mean percentage for each receptor is represented by the horizontal bar. (B) B-ALL patient samples (n=3) were cultured on plate-bound human DLL1-Fc, DLL3-Fc, DLL4-Fc, Jagged1-Fc, Jagged2-Fc, and an IgG-Fc control. Viability was determined every 24 hours as the percentage of cells PI positive by flow cytometry. (C) Cell lines representing T-ALL (CEM) and B-ALL (SB, JM1, Nalm6) and samples from Ph-like B-ALL patients (Pt.B1, Pt.B2) were co-cultured on human bone marrow stromal HS5 cells expressing GFP (control) or DLL1. Viability was determined every 24 hours by trypan blue (n=3). (D) Representative histograms of Annexin V positivity in the same cells co-cultured with HS5 cells expressing DLL1 or control at 96 hours. (E) RNA expression of Notch downstream genes HES1, DTX1, and HEY1 in B-ALL patient samples (n=3) co-cultured for 24 hours on HS5 cells expressing GFP or DLL1; with and without a DLL1 blocking antibody, was assessed by qRT-PCR. (F) A representative western blot from the same experiment depicting HES1(abcam ab) at the protein level.
Figure 2.
Figure 2.. PLK1 is expressed in B-ALL and is suppressed by Notch activation
(A) Intracellular PLK1 expression in cell lines (top panels) and patient samples (bottom panels) representing the 3 B-ALL subsets; PH-ve, PH-like, and PH+, was assessed by flow cytometry and (B) median fluorescence intensity (MFI) was summarized. Pale and dark shades represent cell lines and patient samples, respectively, within each subset. PH-like cells had significantly higher PLK1 MFI when compared to both PH-ve and PH+ cells (p<0.01) using a one-way ANOVA with post-hoc Tukey’s test. (C) Intracellular PLK1 expression in the same cells was measured after 48 hours of co-culture with HS5 cells expressing DLL1. (D) Summary of the relative reduction of PLK1 MFI after co-culture with HS5-DLL1 compared to baseline. PLK1 MFI reduction was significantly greater in PH-like when compared to PH-ve cells (p<0.05) using a one-way ANOVA with post-hoc Tukey’s test. (E) T-ALL (CEM; a HES1-positive control) and B-ALL cell lines along with two representative Ph-like B-ALL patient samples (Pt.B1, Pt.B2) were assessed by Western blot for cleaved intra-cellular Notch 2 (ICN2), HES1(abcam ab), PLK1, and β-actin after co-culture on HS5 cells expressing either GFP or DLL1 for 48 hours. (F) Representative flow plots of PLK1 expression from the B-ALL cell line, SB, expressing intra-cellular Notch domains 1-4 (ICN1-4) or a GFP control 48 hours post induction. (G) T-ALL (CEM, SupT1, Molt4, Jurkat) and B-ALL (SB, JM1, Nalm6, 697) cells were transduced with GFP control or HES1. HES1(Origene ab) and PLK1 protein expression in transduced cells was determined by Western blot.
Figure 3.
Figure 3.. PLK1 inhibition promotes B-ALL specific cell death and is associated p53 accumulation.
(A) Primary cells from B-ALL (left) and T-ALL (right) patients (each n=3) were transduced with doxycycline- inducible PLK1 or scrambled shRNAs and cultured in low-dose doxycycline (2 μg/mL). Cell viability was determined on days 1 and 4 by trypan blue staining. (B) The PLK1-shRNA knockdown was confirmed both at the RNA and protein level by qRT-PCR and Western blot, respectively. PLK1 RNA was significantly reduced in both B-ALL patient samples (p<0.05, n=3) by two sample t-tests. (C) Representative flow cytometry data summarizing the differences in intracellular p53 expression from a T-ALL and 5 B-ALL patient samples transduced with the PLK1 or scrambled shRNA after 48 hours.
Figure 4.
Figure 4.. PLK1 inhibition prevents MDM2 phosphorylation and increases p53 accumulation in B-ALL.
(A) Ph-like B-ALL patient samples (Pt.B1, Pt.B2) and B-ALL cell line, SB, were co-cultured on HS5 cells expressing either the GFP-control or DLL1. MDM2 (phospho and total), p53, PLK1, HES1, and β-actin protein expression were quantified by Western blot. (B) Intracellular p53 was measured in primary B-ALL patient cells (Pt.B1) treated with soluble DLL1, γ-secretase (Notch) inhibitor DAPT (200 nM), or both for 48 h by flow cytometry. (C) Similarly, HES1 was quantified by qRT-PCR in the same primary B-ALL cells treated with DLL1, DAPT, or both, relative to untreated controls. Only the DLL1 treated cells had a significant increase in HES1 RNA expression (p<0.05) by one-way ANOVA with Dunnett’s post-hoc test. (D) A representative Ph-like B-ALL patient sample was cultured on either control (Fc) or DLL1 (DLL1Fc) plate-bound ligand for 48 hours. Cell lysates were immunoprecipitated with IgG control, MDM2, or p53 and the membrane was probed with pMDM2 and p53. (E,F) Similarly, intracellular pMDM2 and p53 was measured by flow cytometry for 2 B-ALL patient samples after 48 hours of culture on control (Fc) or DLL1 (DLL1Fc) plate-bound ligand. Intracellular p53 expression was significantly increased in both patient samples (p<0.05 and p<0.01) cultured on DLL1Fc when compared to their corresponding control cultures.
Figure 5.
Figure 5.. Notch-mediated PLK1 ubiquitination involves PARylation of CHFR1 (checkpoint ubiquitin E3 ligase) in B-ALL.
(A) PLK1 mRNA expression was determined by qRT-PCR after co-culture with HS5-DLL1 or HS5-GFP for 48 hours (n=3). (B) B-ALL cell lines were treated with MG132 4 hours prior to various time points (12, 24, or 48 h) of co-culture with HS5-GFP or HS5-DLL1. Cell lysates were subjected to immunoprecipitation with ubiquitin and probed for PLK1. (C) Similary, after 48 hours of co-culture cells were treated with MG132 for 4 hours and harvested. Cell lysates were subjected to immunoprecipitation with PLK1 and blots were probed with PLK1 and ubiquitin. (D) The same panel of B-ALL cells was transduced with retrovirus-mediated HES1 for 48 hours to induce ectopic expression of the gene. The cells were treated with MG132 and the cell lysates subjected to immunoprecipitation with ubiquitin and probed for PLK1. (E) Primary B-ALL cells (Pt. B1) were either transduced with HES1 retrovirus, transfected with CHFR siRNA (siCHFR), or both for 24 hours; these cells and untreated controls were probed for CHFR and PLK1 expression. (F) Cell lysates from B-ALL cell lines co-culture with HS5-GFP or HS5-DLL1 were immunoprecipitated with CHFR and probed for PLK1. (G) T-ALL cells (CEM) and B-ALL cells (SB, JM1, Nalm6) were either co-cultured on control or DLL1-expressing HS5 cells and subjected to CHFR depletion via siRNA for 4 days. Viability was determined by trypan blue. (H) Cell lysates from (E) were immunoprecipitated with p53, and blots were probed with pMDM2(ser260) and p53. (I) B-ALL cells were co-cultured on control or DLL1-expressing HS5 cells for 48 hours, and cell lysates were immunoprecipitated with CHFR and resolved on 4-15% non-denaturing gradient gels; the membrane was probed for polyADP ribosylation (PAR). (J) Cells from patients with Ph-like B-ALL (Pt.B1, Pt.B2) were co-cultured on control or DLL1-expressing HS5 cells and treated for 48 hours with the PARP inhibitor, 3ABA. Viability was determined by trypan blue. *p<0.05; **p<0.01.
Figure 6.
Figure 6.. Pharmacologic inhibition of PLK1 shows anti-leukemia activity in Ph-like B-ALL.
(A) Cells representing T-ALL (CEM) or B-ALL (SB, JM1, Nalm6 [N6]) and primary samples from patients with Ph-like B-ALL were treated with a vehicle control or PLK1 inhibitor, BI2536 (100 nM), for 1 week. Cells were counted by trypan blue daily and the counts normalized the seed number. (B, C) Intracellular p53 (B) and pMDM2 (ser260) (C) for all cells in (A) were determined by flow cytometry at 48 hours. (D) Similarly, cell lysates were collected at the same time point and probed for pMDM2(ser260), MDM2, p53, and β-actin. (E) NSG-SGM3 mice engrafted with cells from a patient with Ph-like B-ALL (Pt.B1) were treated, beginning 3 weeks after initial tail vein injection, with vehicle (control), PLK1 inhibitor BI2536 (15 mg/kg), or BI6727 (volasertib; 15 mg/kg) by gavage twice per week for 2 weeks (n=10 mice per group) and continuously monitored for 2 additional weeks. The leukemia burden was measured weekly in the peripheral blood by hCD45 staining. (F) Mice were euthanized 4 weeks after beginning treatment and the leukemia burden was measured in the bone marrow and spleen by hCD45 staining. (G) Intracellular pMDM2 and p53 levels in the bone marrow of the treated mice were quantified by flow-based analysis. (H) SB B-ALL were treated with various combinations of dexamethasome (DEX) or vincristine (Vi) and PLK1 inhibitor BI2536 (BI) for 3 days (n=3 per treatment group). Cell viability was determined by alamar blue. *p<0.05; **p<0.01.

Similar articles

Cited by

References

    1. Kato M, Manabe A. Treatment and biology of pediatric acute lymphoblastic leukemia. Pediatr Int. 2018;60(1):4–12. - PubMed
    1. Jabbour E, O’Brien S, Konopleva M, Kantarjian H. New insights into the pathophysiology and therapy of adult acute lymphoblastic leukemia. Cancer. 2015;121(15):2517–28. - PubMed
    1. Mody R, Li S, Dover DC, Sallan S, Leisenring W, Oeffinger KC, et al. Twenty-five-year follow-up among survivors of childhood acute lymphoblastic leukemia: a report from the Childhood Cancer Survivor Study. Blood. 2008;111(12):5515–23. - PMC - PubMed
    1. Vrooman LM, Silverman LB. Treatment of Childhood Acute Lymphoblastic Leukemia: Prognostic Factors and Clinical Advances. Current hematologic malignancy reports. 2016;11(5):385–94. - PubMed
    1. Mullighan CG, Collins-Underwood JR, Phillips LA, Loudin MG, Liu W, Zhang J, et al. Rearrangement of CRLF2 in B-progenitor- and Down syndrome-associated acute lymphoblastic leukemia. Nat Genet. 2009;41(11):1243–6. - PMC - PubMed

Publication types

MeSH terms