. 2019 Aug 13;93(17):e00954-19.
doi: 10.1128/JVI.00954-19. Print 2019 Sep 1.

Human Cytomegalovirus Disruption of Calcium Signaling in Neural Progenitor Cells and Organoids

Affiliations

Human Cytomegalovirus Disruption of Calcium Signaling in Neural Progenitor Cells and Organoids

Samantha L Sison et al. J Virol. .

Abstract

The herpesvirus human cytomegalovirus (HCMV) is a leading cause of congenital birth defects. Infection can result in infants born with a variety of symptoms, including hepatosplenomegaly, microcephaly, and developmental disabilities. Microcephaly is associated with disruptions in the neural progenitor cell (NPC) population. Here, we defined the impact of HCMV infection on neural tissue development and calcium regulation, a critical activity in neural development. Regulation of intracellular calcium involves purinergic receptors and voltage-gated calcium channels (VGCC). HCMV infection compromised the ability of both pathways in NPCs as well as fibroblasts to respond to stimulation. We observed significant drops in basal calcium levels in infected NPCs which were accompanied by loss in VGCC activity and purinergic receptor responses. However, uninfected cells in the population retained responsiveness. Addition of the HCMV inhibitor maribavir reduced viral spread but failed to restore activity in infected cells. To study neural development, we infected three-dimensional cortical organoids with HCMV. Infection spread to a subset of cells over time and disrupted organoid structure, with alterations in developmental and neural layering markers. Organoid-derived infected neurons and astrocytes were unable to respond to stimulation whereas uninfected cells retained nearly normal responses. Maribavir partially restored structural features, including neural rosette formation, and dampened the impact of infection on neural cellular function. Using a tissue model system, we have demonstrated that HCMV alters cortical neural layering and disrupts calcium regulation in infected cells.IMPORTANCE Human cytomegalovirus (HCMV) replicates in several cell types throughout the body, causing disease in the absence of an effective immune response. Studies on HCMV require cultured human cells and tissues due to species specificity. In these studies, we investigated the impact of infection on developing three-dimensional cortical organoid tissues, with specific emphasis on cell-type-dependent calcium signaling. Calcium signaling is an essential function during neural differentiation and cortical development. We observed that HCMV infects and spreads within these tissues, ultimately disrupting cortical structure. Infected cells exhibited depleted calcium stores and loss of ATP- and KCl-stimulated calcium signaling while uninfected cells in the population maintained nearly normal responses. Some protection was provided by the viral inhibitor maribavir. Overall, our studies provide new insights into the impact of HCMV on cortical tissue development and function.

Keywords: astrocytes; calcium signaling; cytomegalovirus; maribavir; microcephaly; neural stem cells; neurons; organoids.


Figures

FIG 1
FIG 1
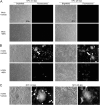
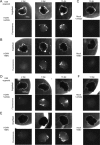
HCMV induces syncytium-like formation during infection of human neural progenitor cells. NPC-derived neurons and astrocytes were mock infected (A) or infected using HCMV TB40/E-eGFP at 0.5 IU/cell (B) and treated with DMSO vehicle control (+vehicle) or 10 μM maribavir (+MBV). Bright-field and fluorescent images were taken at 14 dpi and 26 dpi from separate experiments. Arrows identify potential syncytium-like formation. (C) Enlarged images from panel B (arrows) identify examples of GFP-positive multinucleated syncytium-like formation. Scale bar, 100 μm.
FIG 2
FIG 2
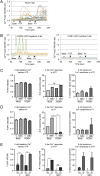
Live-cell Ca2+ imaging is disrupted in HCMV-infected fibroblasts. (A) MRC-5 fibroblasts were mock treated and analyzed using live-cell Ca2+ imaging. Each line represents an individual cell. Cell traces from a representative experiment are shown. (B) MRC-5 cells were infected using HCMV TB40/E-eGFP at a multiplicity of 0.5 IU/cell, and recorded traces of a representative experiment were separated into GFP-positive and -negative populations. (C) At 2 dpi, intracellular Ca2+ levels were measured prior to ATP stimulation (left panel). The total number of cells responding to 10 μM ATP stimulation (middle panel) and the percent Ca2+ response over baseline (right panel) are shown. V, vehicle. (D) Impact of 50 μM KCl stimulation on Ca2+ levels as described in panel C. (E) Intracellular Ca2+ levels were measured at 5 dpi prior to ATP stimulation (left panel), and the total number of cells responding to ATP (middle panel) and the percent Ca2+ response over baseline are shown (right panel). Data collected at 5 dpi were separated into GFP-positive (G+) and -negative (G−) populations. The data were collected from two biological replicate experiments with 50 cells analyzed in each replicate and include standard deviations from the mean. (*, P < 0.05; **, P < 0.01; ***, P < 0.001; ns, not significant, as determined by ANOVA or chi-Square test).
FIG 3
FIG 3
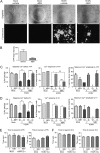
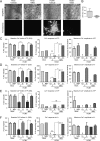
Viral kinase inhibition reduces spread but does not improve Ca2+ function in infected cells. (A) NPC-derived neurons and astrocytes were mock infected or infected using HCMV TB40/E-eGFP at 0.5 IU/cell and treated with DMSO vehicle control (+vehicle) or 10 μM maribavir (+MBV). Representative bright-field and fluorescent images were taken at 14 dpi. (B) The mean GFP fluorescence signal for infected samples treated with vehicle or MBV. (C) Intracellular Ca2+ levels were measured at 14 dpi with HCMV-infected cells separated into GFP-positive (G+) and -negative (G−) populations. Intracellular Ca2+ levels were measured prior to ATP stimulation (left panel), and the total number of cells responding to 10 μM ATP stimulation (middle panel) and the percent Ca2+ response over baseline are shown (right panel). V, vehicle. (D) Stimulation using 50 μM KCl as described in panel C. (E) The time to respond to ATP stimulation (left panel) or recover from ATP (right panel) across the treatment groups. (F) The time to respond to KCl (left panel) or recover from KCl (right panel). These data were collected from four biological replicate experiments with 100 cells analyzed in each replicate. (*, P < 0.05; **, P < 0.01; ***, P < 0.001; ns, not significant, as determined by ANOVA or chi-square test).
FIG 4
FIG 4
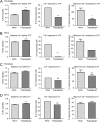
Depletion of intracellular Ca2+ stores disrupts purinergic receptor activity in fibroblasts and NPCs. (A) Fibroblasts were treated with 1 μM thapsigargin and analyzed for baseline intracellular Ca2+ levels prior to stimulation (left panel), for the number of responding cells following 10 μM ATP stimulation (middle panel), and for percent Ca2+ response above baseline (right panel). (B) NPC-derived neurons and astrocytes were analyzed as described for panel A. (C) Thapsigargin-treated fibroblasts were analyzed for baseline intracellular Ca2+ levels prior to stimulation (left panel), for the number of responding cells following 50 μM KCl stimulation (middle panel), and for percent Ca2+ response above baseline (right panel). (D) NPC-derived neurons and astrocytes were analyzed as described for panel C. Data are from three biological replicate experiments with 50 (fibroblasts) or 100 (neural) cells analyzed in each replicate. (**, P < 0.01; ***, P < 0.001; ****, P = 0.0001; ns, not significant, as determined by ANOVA or chi-square test).
FIG 5
FIG 5
Three-dimensional cortical organoid generation and infection by HCMV. (A) Multicellular organoids were generated over a time course of 30 to 60 days, with the developmental steps and culture conditions indicated during each phase of the differentiation process. Representative bright-field images of early stage organoids are shown. (B) Image of day 40 organoids prepared in a 10-cm culture dish and later moved to individual wells of a multiwell plate showing uniformity of size. Scale bar, 0.2 mm. (C) Day 15, 29, and 60 organoids were infected using HCMV TB40/E-eGFP based on an approximated area at 1 IU/μm2 in individual culture wells, and bright-field and fluorescent images obtained at 120 hpi. (D) Organoids prepared separately from those used in the experiment shown in panel B were infected and evaluated for GFP fluorescence at 120 hpi. D, day; ROCK, rho-associated coiled-coil protein kinase; hiPSC, human iPSC.
FIG 6
FIG 6
HCMV infection spread in cortical organoids regardless of MBV cotreatment. (A to C) Representative bright-field and fluorescent images of day 30 (D30) organoids infected with HCMV TB40/E-eGFP at a multiplicity of 1 IU/μm2 between 2 and 13 dpi and treated with vehicle or 10 μM MBV or mock infected and treated as indicated. (D to F) Representative bright-field and fluorescent images of day 60 organoids infected with HCMV TB40/E-eGFP at a multiplicity of 1 IU/μm2 between 2 and 13 dpi and treated with vehicle or 10 μM MBV or mock infected and treated as indicated. Images were obtained using a 1× objective at the indicated times.
FIG 7
FIG 7
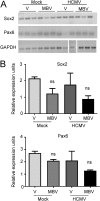
Whole-organoid expression of early NPC markers is not significantly changed with HCMV infection. (A) Whole-organoid RNA was isolated at 14 dpi from mock- and HCMV TB40/E-eGFP-infected day 30 organoids treated with vehicle (V) or 10 μM MBV. Three separate organoids were analyzed for each condition. Expression of Sox2 and Pax6 was assessed using RT-PCR relative to results with the GAPDH control. (B) Average signal intensity of Sox2 and Pax6 relative to that of GAPDH from three separate organoids is shown. ns, not significant.
FIG 8
FIG 8
HCMV-infected organoids show disrupted rosette formation and Sox2 expression patterns. Representative immunofluorescent images of cryosectioned day 30 organoids stained at 14 dpi for Sox2 expression (red) and with 4′,6′-diamidino-2-phenylindole (blue) following mock infection with vehicle (A), mock infection with 10 μM MBV (B), HCMV TB40/E-eGFP infection (green) with vehicle (C), and HCMV TB40/E-eGFP infection with MBV (D). No GFP fluorescence was observed under mock conditions. Scale bar, 100 μm.
FIG 9
FIG 9
HCMV-infected organoids show disrupted Pax6 expression patterns. Representative immunofluorescence images of cryosectioned day 30 organoids stained at 14 dpi for Pax6 expression (red) and with 4′,6′-diamidino-2-phenylindole (blue) following mock infection with vehicle (A), mock infection with 10 μM MBV (B), HCMV TB40/E-eGFP infection (green) with vehicle (C), and HCMV TB40/E-eGFP infection with MBV (D). No GFP fluorescence was observed under mock conditions. Scale bar, 100 μm.
FIG 10
FIG 10
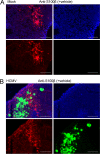
HCMV infection does not impact astrocyte labeling in cortical organoids. Representative immunofluorescence images of cryosectioned day 30 organoids stained at 14 dpi for S100β expression (red) and with 4′,6′-diamidino-2-phenylindole (blue) following mock infection with vehicle (A) and HCMV TB40/E-eGFP infection (green) with vehicle (B). No GFP fluorescence was observed under mock conditions. Scale bar, 100 μm.
FIG 11
FIG 11
HCMV-infected organoids show disrupted neuron differentiation. Representative immunofluorescence images of cryosectioned day 30 organoids stained at 14 dpi for Tuj1 (βIII tubulin) expression (white) and with 4′,6′-diamidino-2-phenylindole (blue) following mock infection with vehicle (A), mock infection with 10 μM MBV (B), HCMV TB40/E-eGFP infection (green) with vehicle (C), and HCMV TB40/E-eGFP infection with MBV (D). No GFP fluorescence was observed under mock conditions. Scale bar, 100 μm.
FIG 12
FIG 12
HCMV-infected organoids lack terminal differentiation of layer-specific cortical neurons. Representative immunofluorescence images of cryosectioned day 30 organoids stained at 14 dpi for Ctip2 expression (red) and with 4′,6′-diamidino-2-phenylindole (blue) following mock infection with vehicle (A), mock infection with 10 μM MBV (B), HCMV TB40/E-eGFP infection (green) with vehicle (C), and HCMV TB40/E-eGFP infection with MBV (D). No GFP fluorescence was observed under mock conditions. Scale bar, 100 μm.
FIG 13
FIG 13
HCMV infection reduces stimulus-evoked Ca2+ responses in organoid-derived neural cells. (A) Day 30 organoids were mock infected or infected using HCMV TB40/E-eGFP at 0.5 IU/cell and treated with DMSO vehicle control (+vehicle) or 10 μM maribavir (+MBV). Representative bright-field and fluorescent images of dissociated neurons and astrocytes were taken at 14 days postplating. (B) The mean GFP fluorescence decreased in HCMV-infected cells with MBV cotreatment. (C) Intracellular Ca2+ levels were measured at 14 days postplating with HCMV-infected cells separated into GFP-positive (G+) and -negative (G−) populations. Intracellular Ca2+ levels were measured prior to stimulation (left panel), and the total number of cells responding to 10 μM ATP stimulation (middle panel) and the percent Ca2+ response over baseline are shown (right panel). (D) Stimulation using 50 μM KCl as described for panel C. (E) Day 60 organoids were mock treated or infected as described for panel A. Intracellular Ca2+ levels were measured at 14 days postplating prior to stimulation (left panel), and the total number of cells responding to 10 μM ATP stimulation (middle panel) and the percent Ca2+ response over baseline are shown (right panel). (F) Stimulation using 50 μM KCl as described for panel E. Data were collected from four biological replicate experiments with 100 cells analyzed in each replicate. (*, P < 0.05; **, P < 0.01; ***, P < 0.001; ns, not significant, as determined by ANOVA or chi-square test).
FIG 14
FIG 14
HCMV infection altered organoid-derived neuronal response to KCl stimulation. (A) The time to respond to ATP stimulation (left panel) or recover from ATP (right panel) across the treatment groups. (B) The time to respond to KCl (left panel) or recover from KCl (right panel). Data were collected from four biological replicate experiments with 100 cells analyzed in each replicate. (***, P < 0.001, determined by ANOVA).

Similar articles

Cited by

References

    1. Mocarski ES, Shenk T, Griffiths PD, Pass RF. 2013. Cytomegaloviruses, p 1960–2014. In Knipe DM, Howley PM, Cohen JI, Griffin DE, Lamb RA, Martin MA, Rancaniello VR, Roizman B (ed), Fields virology, 6 ed, vol 2 Lippincott Williams & Wilkins, Philadelphia, PA.
    1. Murphy E, Yu D, Grimwood J, Schmutz J, Dickson M, Jarvis MA, Hahn G, Nelson JA, Myers RM, Shenk TE. 2003. Coding potential of laboratory and clinical strains of human cytomegalovirus. Proc Natl Acad Sci U S A 100:14976–14981. doi:10.1073/pnas.2136652100. - DOI - PMC - PubMed
    1. Weekes MP, Tomasec P, Huttlin EL, Fielding CA, Nusinow D, Stanton RJ, Wang EC, Aicheler R, Murrell I, Wilkinson GW, Lehner PJ, Gygi SP. 2014. Quantitative temporal viromics: an approach to investigate host-pathogen interaction. Cell 157:1460–1472. doi:10.1016/j.cell.2014.04.028. - DOI - PMC - PubMed
    1. Stern-Ginossar N, Weisburd B, Michalski A, Le VT, Hein MY, Huang SX, Ma M, Shen B, Qian SB, Hengel H, Mann M, Ingolia NT, Weissman JS. 2012. Decoding human cytomegalovirus. Science 338:1088–1093. doi:10.1126/science.1227919. - DOI - PMC - PubMed
    1. Britt WJ, Prichard MN. 2018. New therapies for human cytomegalovirus infections. Antiviral Res 159:153–174. doi:10.1016/j.antiviral.2018.09.003. - DOI - PubMed

Publication types

MeSH terms