

Psychiatric-disorder-related behavioral phenotypes and cortical hyperactivity in a mouse model of 3q29 deletion syndrome
- PMID: 31216562
- PMCID: PMC6887869
- DOI: 10.1038/s41386-019-0441-5
Psychiatric-disorder-related behavioral phenotypes and cortical hyperactivity in a mouse model of 3q29 deletion syndrome
Abstract
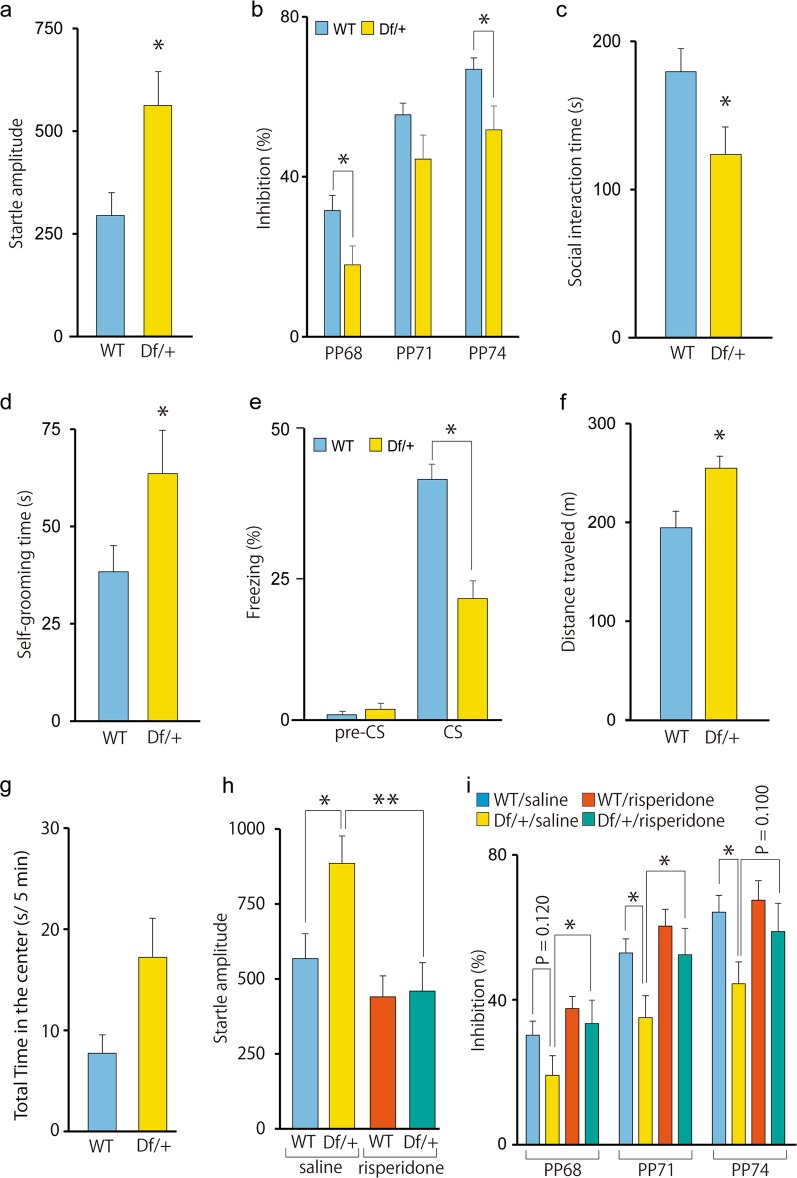
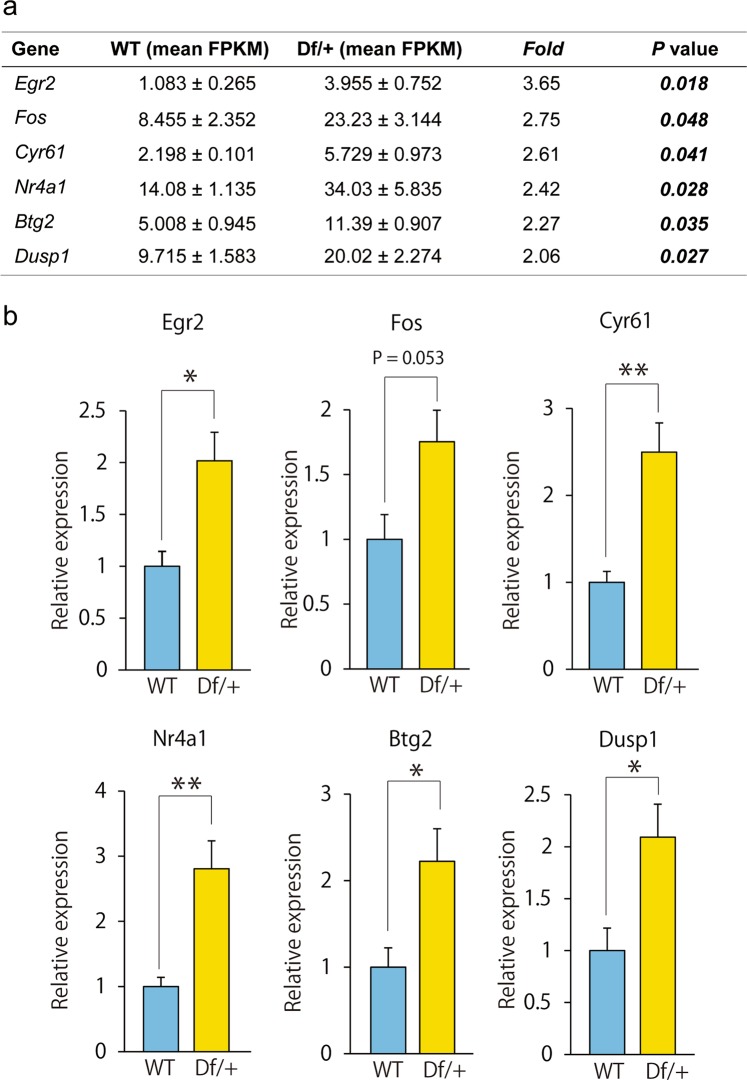
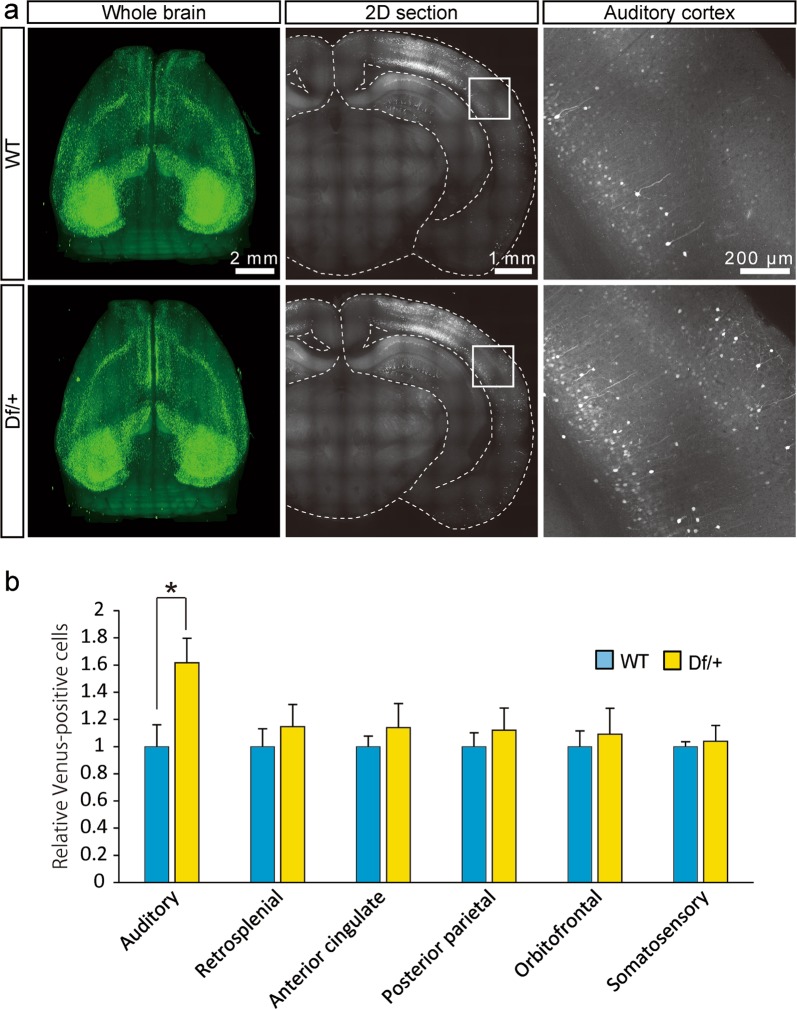
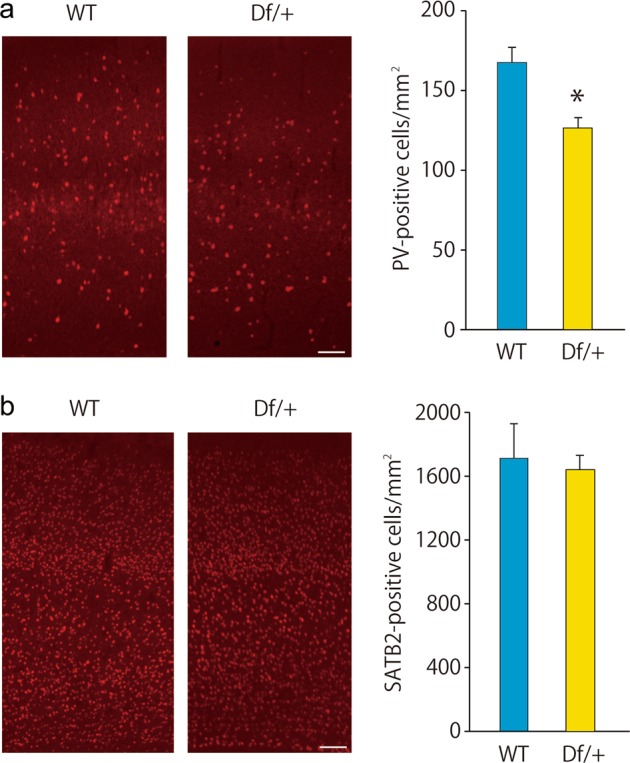
3q29 microdeletion, a rare recurrent copy number variant (CNV), greatly confers an increased risk of psychiatric disorders, such as schizophrenia and autism spectrum disorder (ASD), as well as intellectual disability. However, disease-relevant cellular phenotypes of 3q29 deletion syndrome remain to be identified. To reveal the molecular and cellular etiology of 3q29 deletion syndrome, we generated a mouse model of human 3q29 deletion syndrome by chromosome engineering, which achieved construct validity. 3q29 deletion (Df/+) mice showed reduced body weight and brain volume and, more importantly, impaired social interaction and prepulse inhibition. Importantly, the schizophrenia-related impaired prepulse inhibition was reversed by administration of antipsychotics. These findings are reminiscent of the growth defects and neuropsychiatric behavioral phenotypes in patients with 3q29 deletion syndrome and exemplify that the mouse model achieves some part of face validity and predictive validity. Unbiased whole-brain imaging revealed that neuronal hyperactivation after a behavioral task was strikingly exaggerated in a restricted region of the cortex of Df/+ mice. We further elucidated the cellular phenotypes of neuronal hyperactivation and the reduction of parvalbumin expression in the cortex of Df/+ mice. Thus, the 3q29 mouse model provides invaluable insight into the disease-causative molecular and cellular pathology of psychiatric disorders.
Conflict of interest statement
The authors declare no competing interests.
Figures

Similar articles
-
Molecular brain (micro report) oxytocin ameliorates impaired social behavior in a mouse model of 3q29 deletion syndrome.Mol Brain. 2022 Mar 28;15(1):26. doi: 10.1186/s13041-022-00915-w. Mol Brain. 2022. PMID: 35346312 Free PMC article.
-
Familial inheritance of the 3q29 microdeletion syndrome: case report and review.BMC Med Genomics. 2019 Mar 18;12(1):51. doi: 10.1186/s12920-019-0497-4. BMC Med Genomics. 2019. PMID: 30885185 Free PMC article.
-
Neuropsychiatric phenotypes and a distinct constellation of ASD features in 3q29 deletion syndrome: results from the 3q29 registry.Mol Autism. 2019 Jul 16;10:30. doi: 10.1186/s13229-019-0281-5. eCollection 2019. Mol Autism. 2019. PMID: 31346402 Free PMC article.
-
A clinical case report and literature review of the 3q29 microdeletion syndrome.Clin Dysmorphol. 2015 Jul;24(3):89-94. doi: 10.1097/MCD.0000000000000077. Clin Dysmorphol. 2015. PMID: 25714563 Free PMC article. Review.
-
Autistic and psychiatric findings associated with the 3q29 microdeletion syndrome: case report and review.Am J Med Genet A. 2010 Oct;152A(10):2459-67. doi: 10.1002/ajmg.a.33573. Am J Med Genet A. 2010. PMID: 20830797 Review.
Cited by
-
Trends in big data analyses by multicenter collaborative translational research in psychiatry.Psychiatry Clin Neurosci. 2022 Jan;76(1):1-14. doi: 10.1111/pcn.13311. Psychiatry Clin Neurosci. 2022. PMID: 34716732 Free PMC article. Review.
-
Linking Autism Risk Genes to Disruption of Cortical Development.Cells. 2020 Nov 18;9(11):2500. doi: 10.3390/cells9112500. Cells. 2020. PMID: 33218123 Free PMC article. Review.
-
Perceptual pathways to hallucinogenesis.Schizophr Res. 2022 Jul;245:77-89. doi: 10.1016/j.schres.2022.02.002. Epub 2022 Feb 23. Schizophr Res. 2022. PMID: 35216865 Free PMC article.
-
Drosophila models of pathogenic copy-number variant genes show global and non-neuronal defects during development.PLoS Genet. 2020 Jun 24;16(6):e1008792. doi: 10.1371/journal.pgen.1008792. eCollection 2020 Jun. PLoS Genet. 2020. PMID: 32579612 Free PMC article.
-
Molecular brain (micro report) oxytocin ameliorates impaired social behavior in a mouse model of 3q29 deletion syndrome.Mol Brain. 2022 Mar 28;15(1):26. doi: 10.1186/s13041-022-00915-w. Mol Brain. 2022. PMID: 35346312 Free PMC article.
References
Publication types
MeSH terms
Supplementary concepts
LinkOut - more resources
Full Text Sources
Molecular Biology Databases
Miscellaneous
