

A panel of collagen genes are associated with prognosis of patients with gastric cancer and regulated by microRNA-29c-3p: an integrated bioinformatics analysis and experimental validation
- PMID: 31213898
- PMCID: PMC6538884
- DOI: 10.2147/CMAR.S198331
A panel of collagen genes are associated with prognosis of patients with gastric cancer and regulated by microRNA-29c-3p: an integrated bioinformatics analysis and experimental validation
Abstract
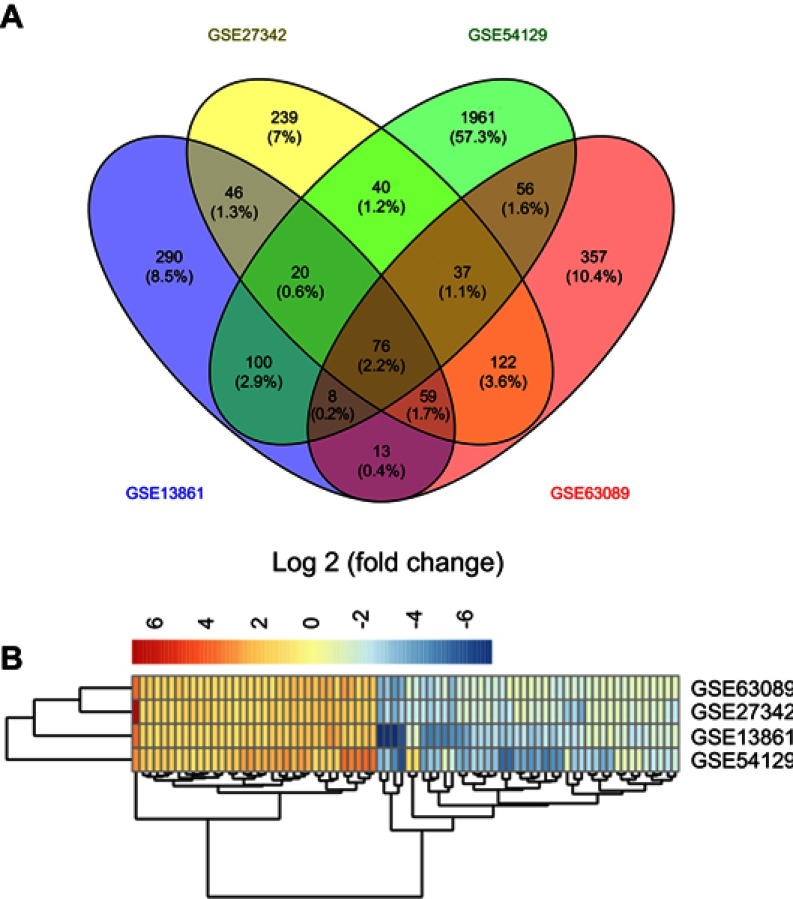
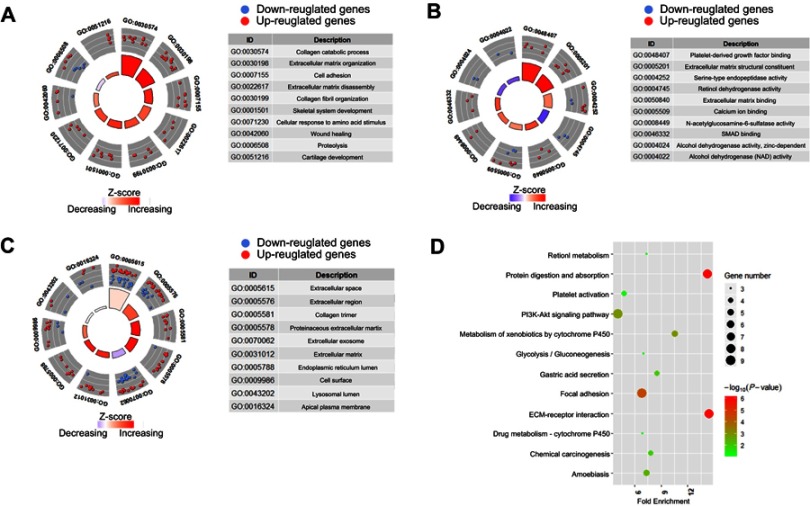
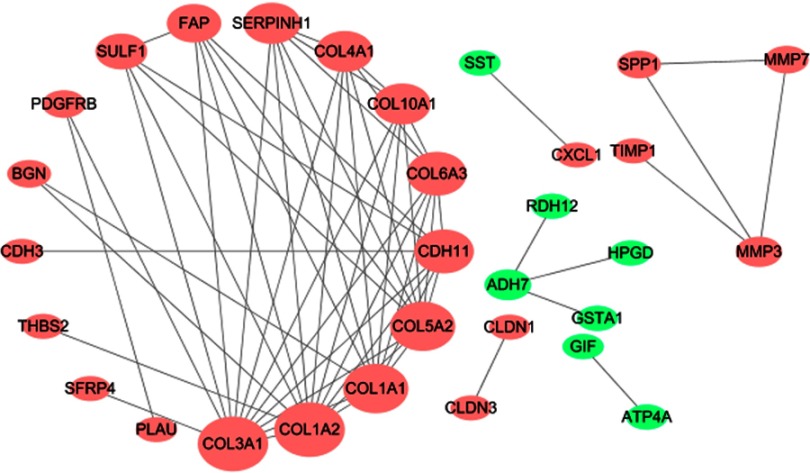
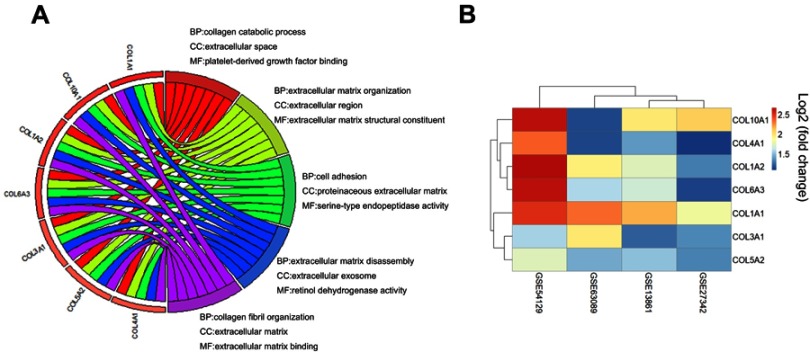
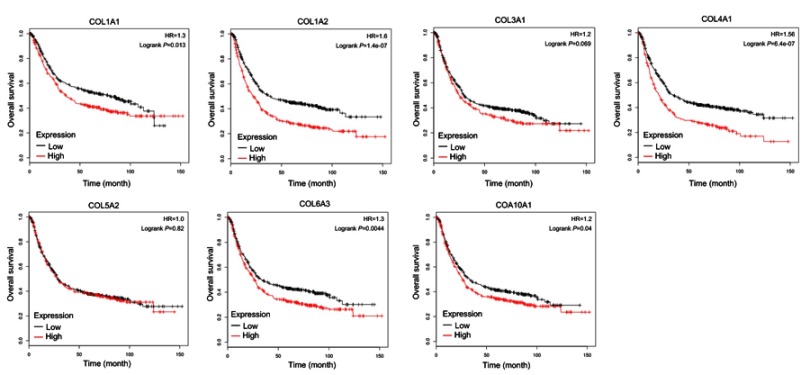
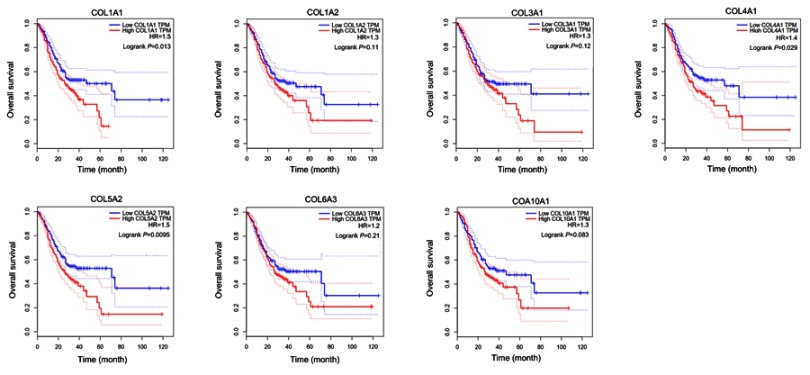
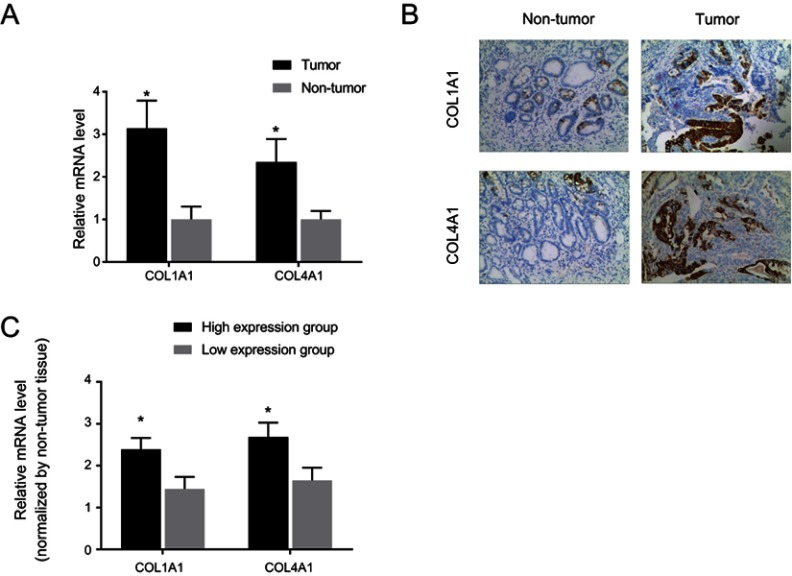
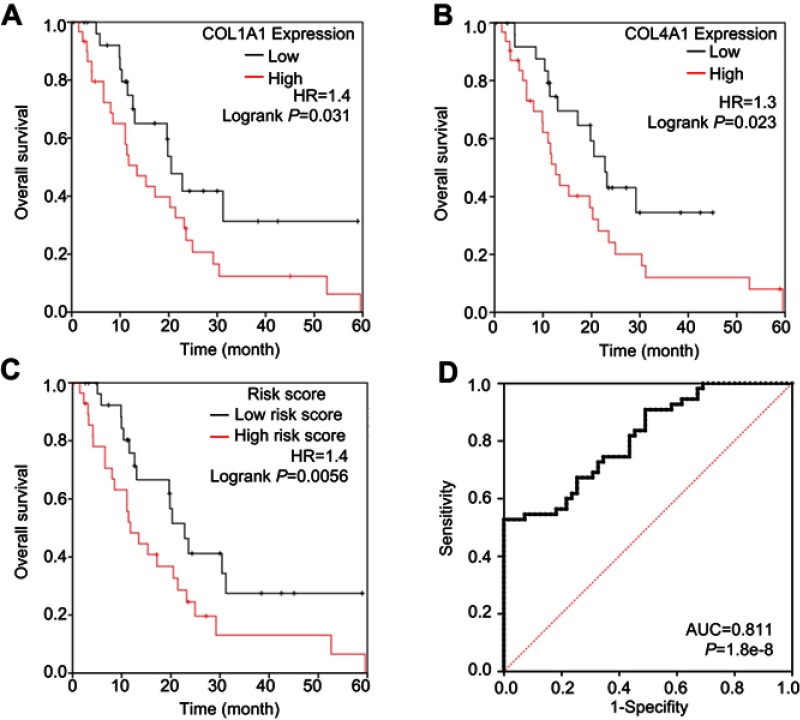
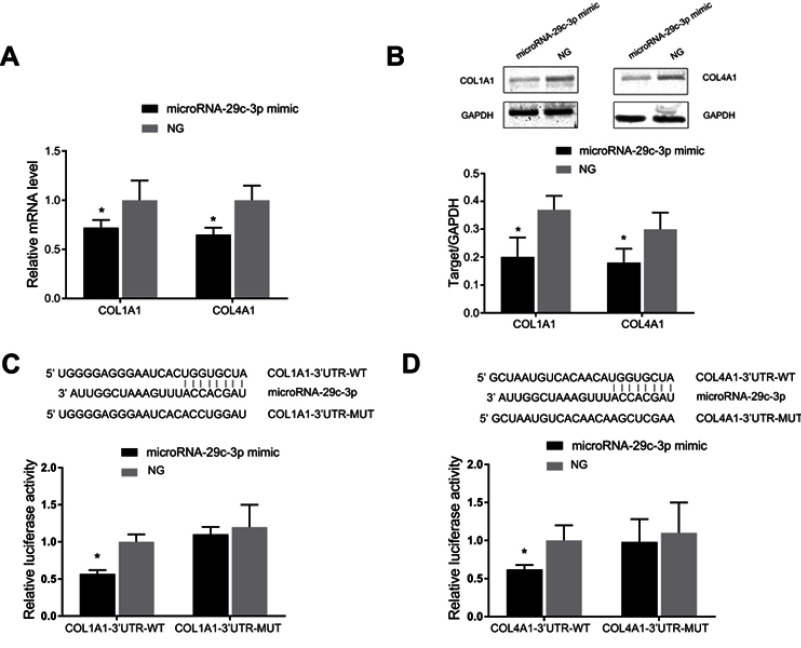
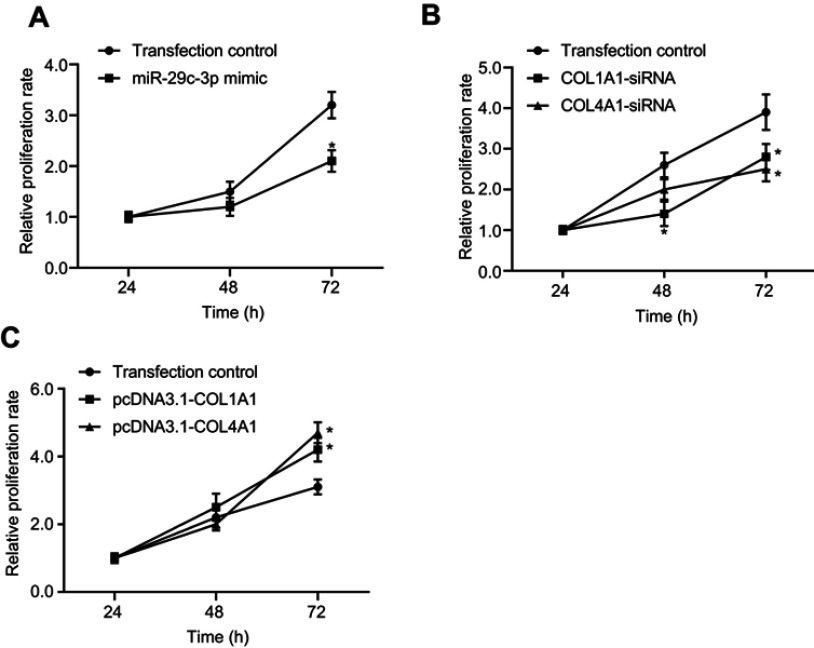
Background: The systematic expression characteristics and functions of collagen genes in gastric cancer (GC) have not been reported. Through public data integration, combined with bioinformatics analysis, we identified a panel of collagen genes overexpressed in GC. The functions of these genes were analyzed and validated in a GC-related cohort. microRNAs that may potentially target such genes were investigated in vitro. Methods: Four GC-related datasets retrieved from the Gene Expression Omnibus (GEO) were used to extract differentially expressed genes (DEGs) in GC. Functional annotation was performed to identify the potential roles of the identified DEGs. The association of candidate genes involved in the prognosis of GC patients (n=876) was determined using data provided by the Kaplan-Meier-plotter database, The Cancer Genome Atlas Stomach Adenocarcinoma (TCGA-STAD) repository, and a GC-related dataset (GSE15459). The expression characteristics of candidate genes and their associations with clinical parameters were validated in our in-house cohort (n=58). MicroRNAs able to target the identified candidate genes were predicted and confirmed using qRT-PCR, Western blotting, and dual-luciferase reporter assays in vitro. Results: After the integration of four GEO datasets, 76 DEGs were identified. Gene Ontology and Kyoto Encyclopedia of Genes and Genomes pathway analysis indicated that these DEGs were significantly enriched in ECM-related functions and pathways. A group of collagen genes was significantly upregulated in the GC tissues and constituted a protein-protein interaction network as important nodes. Some of these collagen genes were closely associated with poor prognosis in GC patients. Overexpression of COL1A1 and COL4A1 was confirmed in our in-house cohort, and this was related to prognosis and certain clinicopathological parameters. We found that microRNA-29c-3p could directly target COL1A1 and COL4A1 in BGC-823 cells. Conclusions: Collagen genes identified in this study were associated with patient prognosis in GC and may represent diagnostic markers or potential therapeutic targets. Aberrant expression of such candidate genes may be induced by microRNA-29c-3p.
Keywords: COL1A1; COL4A1; collagen; gastric cancer; microRNA-29c-3p; prognosis.
Conflict of interest statement
The authors report no conflicts of interest in this work.
Figures
Similar articles
-
Collagen family genes and related genes might be associated with prognosis of patients with gastric cancer: an integrated bioinformatics analysis and experimental validation.Transl Cancer Res. 2020 Oct;9(10):6246-6262. doi: 10.21037/tcr-20-1726. Transl Cancer Res. 2020. PMID: 35117235 Free PMC article.
-
Identification of potential core genes in gastric cancer using bioinformatics analysis.J Gastrointest Oncol. 2021 Oct;12(5):2109-2122. doi: 10.21037/jgo-21-628. J Gastrointest Oncol. 2021. PMID: 34790378 Free PMC article.
-
Integrated bioinformatics analysis reveals novel key biomarkers and potential candidate small molecule drugs in gastric cancer.Pathol Res Pract. 2019 May;215(5):1038-1048. doi: 10.1016/j.prp.2019.02.012. Epub 2019 Feb 28. Pathol Res Pract. 2019. PMID: 30975489
-
Identification of survival-associated biomarkers based on three datasets by bioinformatics analysis in gastric cancer.World J Clin Cases. 2023 Jul 16;11(20):4763-4787. doi: 10.12998/wjcc.v11.i20.4763. World J Clin Cases. 2023. PMID: 37584004 Free PMC article.
-
Identification of hub genes with prognostic values in gastric cancer by bioinformatics analysis.World J Surg Oncol. 2018 Jun 19;16(1):114. doi: 10.1186/s12957-018-1409-3. World J Surg Oncol. 2018. PMID: 29921304 Free PMC article.
Cited by
-
Cancer Stem Cells in Tumor Microenvironment of Adenocarcinoma of the Stomach, Colon, and Rectum.Cancers (Basel). 2022 Aug 16;14(16):3948. doi: 10.3390/cancers14163948. Cancers (Basel). 2022. PMID: 36010940 Free PMC article. Review.
-
Identification of candidate biomarkers associated with gastric cancer prognosis based on an integrated bioinformatics analysis.J Gastrointest Oncol. 2022 Aug;13(4):1690-1700. doi: 10.21037/jgo-22-651. J Gastrointest Oncol. 2022. PMID: 36092336 Free PMC article.
-
MicroRNA expression profiling and target gene analysis in gastric cancer.Medicine (Baltimore). 2020 Sep 11;99(37):e21963. doi: 10.1097/MD.0000000000021963. Medicine (Baltimore). 2020. PMID: 32925730 Free PMC article.
-
Collagen Family as Promising Biomarkers and Therapeutic Targets in Cancer.Int J Mol Sci. 2022 Oct 17;23(20):12415. doi: 10.3390/ijms232012415. Int J Mol Sci. 2022. PMID: 36293285 Free PMC article. Review.
-
A tumour-resident Lgr5+ stem-cell-like pool drives the establishment and progression of advanced gastric cancers.Nat Cell Biol. 2021 Dec;23(12):1299-1313. doi: 10.1038/s41556-021-00793-9. Epub 2021 Dec 2. Nat Cell Biol. 2021. PMID: 34857912
References
LinkOut - more resources
Full Text Sources
Miscellaneous
