

Effect of Chlorella Pyrenoidosa Protein Hydrolysate-Calcium Chelate on Calcium Absorption Metabolism and Gut Microbiota Composition in Low-Calcium Diet-Fed Rats
- PMID: 31212630
- PMCID: PMC6628084
- DOI: 10.3390/md17060348
Effect of Chlorella Pyrenoidosa Protein Hydrolysate-Calcium Chelate on Calcium Absorption Metabolism and Gut Microbiota Composition in Low-Calcium Diet-Fed Rats
Abstract
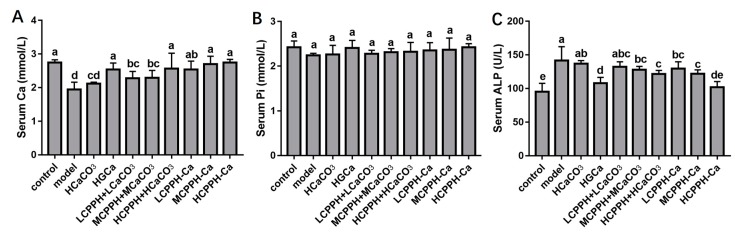
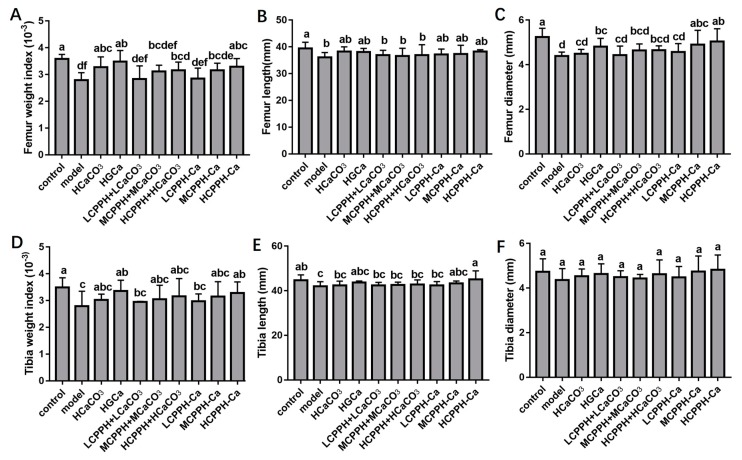
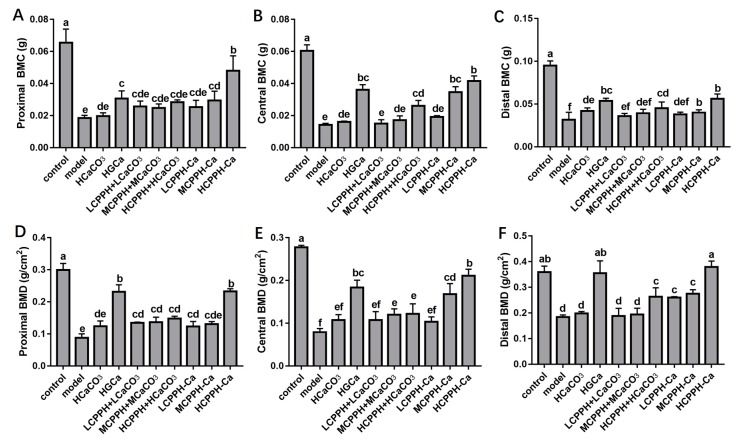
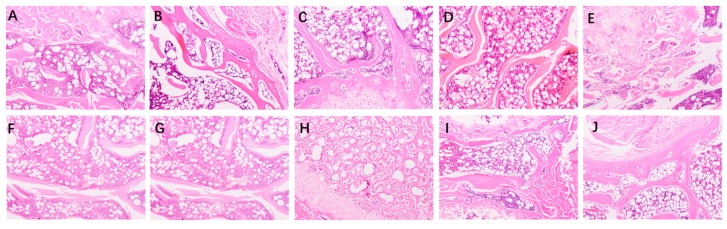
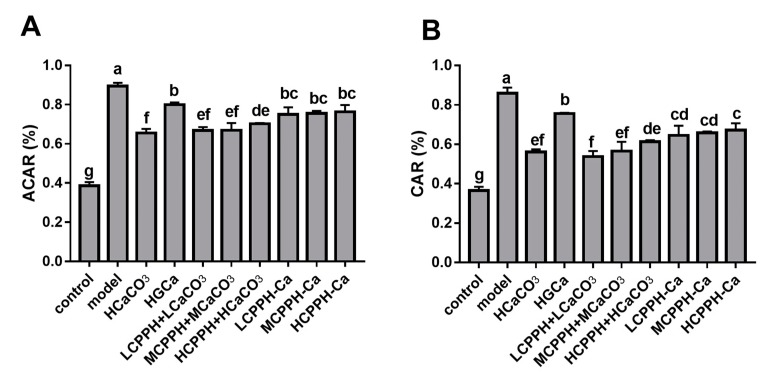
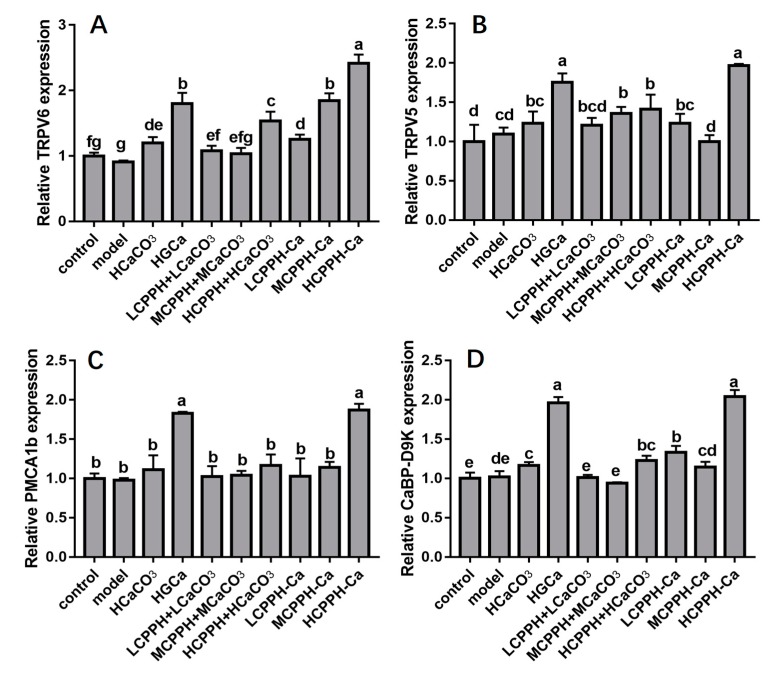
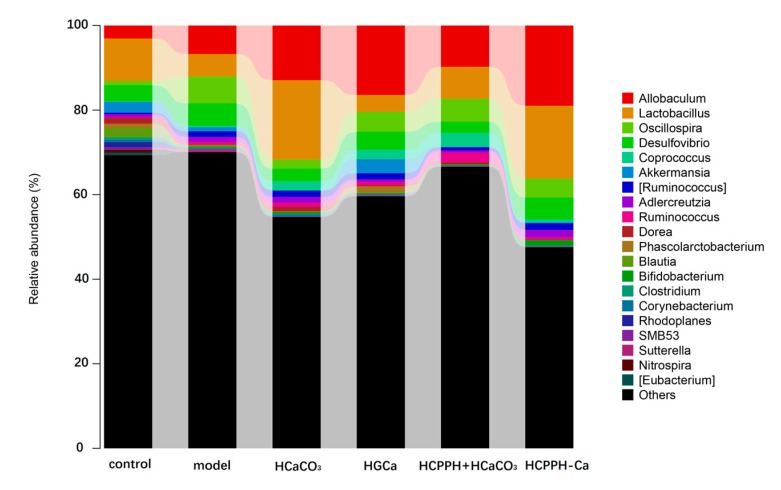
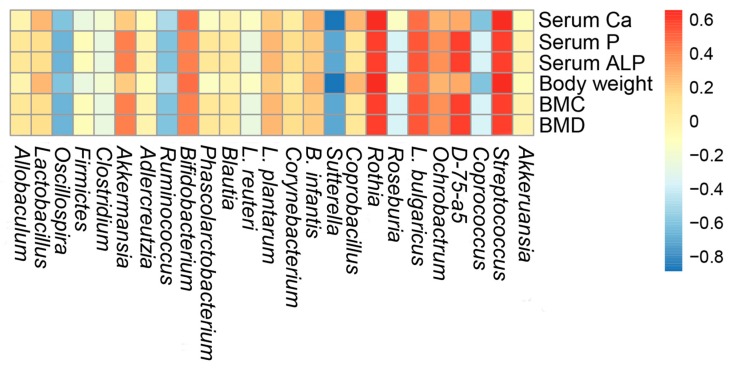
In our current investigation, we evaluated the effect of Chlorella pyrenoidosa protein hydrolysate (CPPH) and Chlorella pyrenoidosa protein hydrolysate-calcium chelate (CPPH-Ca) on calcium absorption and gut microbiota composition, as well as their in vivo regulatory mechanism in SD rats fed low-calcium diets. Potent major compounds in CPPH were characterized by HPLC-MS/MS, and the calcium-binding mechanism was investigated through ultraviolet and infrared spectroscopy. Using high-throughput next-generation 16S rRNA gene sequencing, we analyzed the composition of gut microbiota in rats. Our study showed that HCPPH-Ca increased the levels of body weight gain, serum Ca, bone activity, bone mineral density (BMD) and bone mineral content (BMC), while decreased serum alkaline phosphatase (ALP) and inhibited the morphological changes of bone. HCPPH-Ca up-regulated the gene expressions of transient receptor potential cation V5 (TRPV5), TRPV6, calcium-binding protein-D9k (CaBP-D9k) and a calcium pump (plasma membrane Ca-ATPase, PMCA1b). It also improved the abundances of Firmicutes and Lactobacillus. Bifidobacterium and Sutterella were both positively correlated with calcium absorption. Collectively, these findings illustrate the potential of HCPPH-Ca as an effective calcium supplement.
Keywords: Chlorella pyrenoidosa protein hydrolysate (CPPH); Chlorella pyrenoidosa protein hydrolysate-calcium chelate (CPPH-Ca); calcium absorption; gene expression; gut microbiota.
Conflict of interest statement
The authors declare no conflict of interest.
Figures
Similar articles
-
Lactobacillus helveticus-Derived Whey-Calcium Chelate Promotes Calcium Absorption and Bone Health of Rats Fed a Low-Calcium Diet.Nutrients. 2024 Apr 11;16(8):1127. doi: 10.3390/nu16081127. Nutrients. 2024. PMID: 38674818 Free PMC article.
-
Effect of Marine Microalga Chlorella pyrenoidosa Ethanol Extract on Lipid Metabolism and Gut Microbiota Composition in High-Fat Diet-Fed Rats.Mar Drugs. 2018 Dec 9;16(12):498. doi: 10.3390/md16120498. Mar Drugs. 2018. PMID: 30544856 Free PMC article.
-
Anti-diabetic activity of PUFAs-rich extracts of Chlorella pyrenoidosa and Spirulina platensis in rats.Food Chem Toxicol. 2019 Jun;128:233-239. doi: 10.1016/j.fct.2019.04.017. Epub 2019 Apr 14. Food Chem Toxicol. 2019. PMID: 30995513
-
Extraction, functionality, and applications of Chlorella pyrenoidosa protein/peptide.Curr Res Food Sci. 2023 Oct 26;7:100621. doi: 10.1016/j.crfs.2023.100621. eCollection 2023. Curr Res Food Sci. 2023. PMID: 38021256 Free PMC article. Review.
-
The Formation, Structural Characteristics, Absorption Pathways and Bioavailability of Calcium-Peptide Chelates.Foods. 2022 Sep 8;11(18):2762. doi: 10.3390/foods11182762. Foods. 2022. PMID: 36140890 Free PMC article. Review.
Cited by
-
Menopause modified the association of blood pressure with osteoporosis among gender: a large-scale cross-sectional study.Front Public Health. 2024 May 2;12:1383349. doi: 10.3389/fpubh.2024.1383349. eCollection 2024. Front Public Health. 2024. PMID: 38756892 Free PMC article.
-
Lactobacillus helveticus-Derived Whey-Calcium Chelate Promotes Calcium Absorption and Bone Health of Rats Fed a Low-Calcium Diet.Nutrients. 2024 Apr 11;16(8):1127. doi: 10.3390/nu16081127. Nutrients. 2024. PMID: 38674818 Free PMC article.
-
Structure, Function, and Therapeutic Potential of Marine Bioactive Peptides.Mar Drugs. 2019 Aug 28;17(9):505. doi: 10.3390/md17090505. Mar Drugs. 2019. PMID: 31466341 Free PMC article.
-
The Nutritional Efficacy of Chlorella Supplementation Depends on the Individual Gut Environment: A Randomised Control Study.Front Nutr. 2021 May 31;8:648073. doi: 10.3389/fnut.2021.648073. eCollection 2021. Front Nutr. 2021. PMID: 34136514 Free PMC article.
-
Effects of Menaquinone-7 on the Bone Health of Growing Rats under Calcium Restriction: New Insights from Microbiome-Metabolomics.Nutrients. 2023 Jul 31;15(15):3398. doi: 10.3390/nu15153398. Nutrients. 2023. PMID: 37571336 Free PMC article.
References
-
- Chen D., Mu X.M., Huang H., Nie R.Y., Liu Z.Y., Zeng M.Y. Isolation of a calcium-binding peptide from tilapia scale protein hydrolysate and its calcium bioavailability in rats. J. Func. Foods. 2014;6:575–584. doi: 10.1016/j.jff.2013.12.001. - DOI
MeSH terms
Substances
Grants and funding
- No. 2017N5003/he Fujian Science and Technology Plan project
- XJQ201608/the Science Foundations of Fujian Agriculture and Forestry University
- 31501432/the National Natural Science Foundation of China
- No. KXG15001A/Fujian Agriculture and Forestry University International Cooperation Project
- 2017M612117/the Postdoctoral Science Foundation Project of china
LinkOut - more resources
Full Text Sources
Research Materials
