The immune cell landscape in kidneys of patients with lupus nephritis
- PMID: 31209404
- PMCID: PMC6726437
- DOI: 10.1038/s41590-019-0398-x
The immune cell landscape in kidneys of patients with lupus nephritis
Erratum in
-
Publisher Correction: The immune cell landscape in kidneys of patients with lupus nephritis.Nat Immunol. 2019 Oct;20(10):1404. doi: 10.1038/s41590-019-0473-3. Nat Immunol. 2019. PMID: 31409923
Abstract
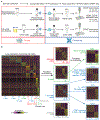
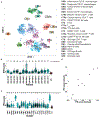
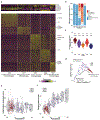
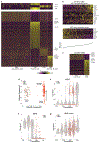
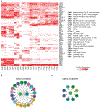
Lupus nephritis is a potentially fatal autoimmune disease for which the current treatment is ineffective and often toxic. To develop mechanistic hypotheses of disease, we analyzed kidney samples from patients with lupus nephritis and from healthy control subjects using single-cell RNA sequencing. Our analysis revealed 21 subsets of leukocytes active in disease, including multiple populations of myeloid cells, T cells, natural killer cells and B cells that demonstrated both pro-inflammatory responses and inflammation-resolving responses. We found evidence of local activation of B cells correlated with an age-associated B-cell signature and evidence of progressive stages of monocyte differentiation within the kidney. A clear interferon response was observed in most cells. Two chemokine receptors, CXCR4 and CX3CR1, were broadly expressed, implying a potentially central role in cell trafficking. Gene expression of immune cells in urine and kidney was highly correlated, which would suggest that urine might serve as a surrogate for kidney biopsies.
Figures



Comment in
-
Gene signatures reveal kidney immune cells.Nat Rev Nephrol. 2019 Sep;15(9):528. doi: 10.1038/s41581-019-0179-7. Nat Rev Nephrol. 2019. PMID: 31285592 No abstract available.
Similar articles
-
The power of one: advances in single-cell genomics in the kidney.Nat Rev Nephrol. 2020 Feb;16(2):73-74. doi: 10.1038/s41581-019-0237-1. Nat Rev Nephrol. 2020. PMID: 31819231 Review. No abstract available.
-
CXCR3+CD4+ T cells are enriched in inflamed kidneys and urine and provide a new biomarker for acute nephritis flares in systemic lupus erythematosus patients.Arthritis Rheum. 2009 Jan;60(1):199-206. doi: 10.1002/art.24136. Arthritis Rheum. 2009. PMID: 19116922
-
Local synthesis of interferon-alpha in lupus nephritis is associated with type I interferons signature and LMP7 induction in renal tubular epithelial cells.Arthritis Res Ther. 2015 Mar 22;17(1):72. doi: 10.1186/s13075-015-0588-3. Arthritis Res Ther. 2015. PMID: 25889472 Free PMC article.
-
Interleukin-22 From Type 3 Innate Lymphoid Cells Aggravates Lupus Nephritis by Promoting Macrophage Infiltration in Lupus-Prone Mice.Front Immunol. 2021 Feb 26;12:584414. doi: 10.3389/fimmu.2021.584414. eCollection 2021. Front Immunol. 2021. PMID: 33717066 Free PMC article.
-
Using single-cell technologies to map the human immune system - implications for nephrology.Nat Rev Nephrol. 2020 Feb;16(2):112-128. doi: 10.1038/s41581-019-0227-3. Epub 2019 Dec 12. Nat Rev Nephrol. 2020. PMID: 31831877 Review.
Cited by
-
Translating Lupus: Comparative Transcriptional Profiles of Preclinical Lupus Models and Their Relevance to Human Disease.Biology (Basel). 2024 Sep 28;13(10):778. doi: 10.3390/biology13100778. Biology (Basel). 2024. PMID: 39452087 Free PMC article.
-
Integrating genomics and AI to uncover molecular targets for mRNA vaccine development in lupus nephritis.Front Immunol. 2024 Oct 4;15:1381445. doi: 10.3389/fimmu.2024.1381445. eCollection 2024. Front Immunol. 2024. PMID: 39430760 Free PMC article.
-
Cluster of differentiation-44 as a novel biomarker of lupus nephritis and its role in kidney inflammation and fibrosis.Front Immunol. 2024 Oct 1;15:1443153. doi: 10.3389/fimmu.2024.1443153. eCollection 2024. Front Immunol. 2024. PMID: 39411720 Free PMC article.
-
Occurrence and role of Tph cells in various renal diseases.Mol Med. 2024 Oct 11;30(1):174. doi: 10.1186/s10020-024-00919-3. Mol Med. 2024. PMID: 39390361 Free PMC article. Review.
-
Lupus nephritis-related chronic kidney disease.Nat Rev Rheumatol. 2024 Nov;20(11):699-711. doi: 10.1038/s41584-024-01158-w. Epub 2024 Sep 24. Nat Rev Rheumatol. 2024. PMID: 39317803 Review.
References
-
- Narain S & Furie R Update on clinical trials in systemic lupus erythematosus. Curr Opin Rheumatol 28, 477–487 (2016). - PubMed
-
- Thanou A & Merrill JT Treatment of systemic lupus erythematosus: new therapeutic avenues and blind alleys. Nat Rev Rheumatol 10, 23–34 (2014). - PubMed
-
- Banchereau R et al. Personalized Immunomonitoring Uncovers Molecular Networks that Stratify Lupus Patients. Cell 165, 1548–1550 (2016). - PubMed
METHODS-ONLY REFERENCES
-
- Picelli S et al. Full-length RNA-seq from single cells using Smart-seq2. Nat Protoc 9, 171–181 (2014). - PubMed
-
- Nemesh J Drop-seq core computational protocol. McCarroll Laboratory http://mccarrolllab.com/wp-content/uploads/2016/03/DropseqAlignmentCookb... (2016).
-
- Benjamini YH, Y. Controlling the False Discovery Rate: a Practical and Powerful Approach to Multiple Testing. J R Statist Soc B 57, 289–300 (1995).
Publication types
MeSH terms
Substances
Grants and funding
- UH2 AR067685/AR/NIAMS NIH HHS/United States
- UM2 AR067678/AR/NIAMS NIH HHS/United States
- T32 HG002295/HG/NHGRI NIH HHS/United States
- UH2 AR067681/AR/NIAMS NIH HHS/United States
- UH2 AR067688/AR/NIAMS NIH HHS/United States
- UH2 AR067689/AR/NIAMS NIH HHS/United States
- UH2 AR067690/AR/NIAMS NIH HHS/United States
- UH2 AR067694/AR/NIAMS NIH HHS/United States
- P30 DK081943/DK/NIDDK NIH HHS/United States
- UH2 AR067679/AR/NIAMS NIH HHS/United States
- U01 HG009379/HG/NHGRI NIH HHS/United States
- UH2 AR067677/AR/NIAMS NIH HHS/United States
- UH2 AR067676/AR/NIAMS NIH HHS/United States
- UH2 AR067691/AR/NIAMS NIH HHS/United States
LinkOut - more resources
Full Text Sources
Other Literature Sources

