

Convection Enhanced Delivery of Optogenetic Adeno-associated Viral Vector to the Cortex of Rhesus Macaque Under Guidance of Online MRI Images
- PMID: 31180352
- PMCID: PMC8720291
- DOI: 10.3791/59232
Convection Enhanced Delivery of Optogenetic Adeno-associated Viral Vector to the Cortex of Rhesus Macaque Under Guidance of Online MRI Images
Abstract
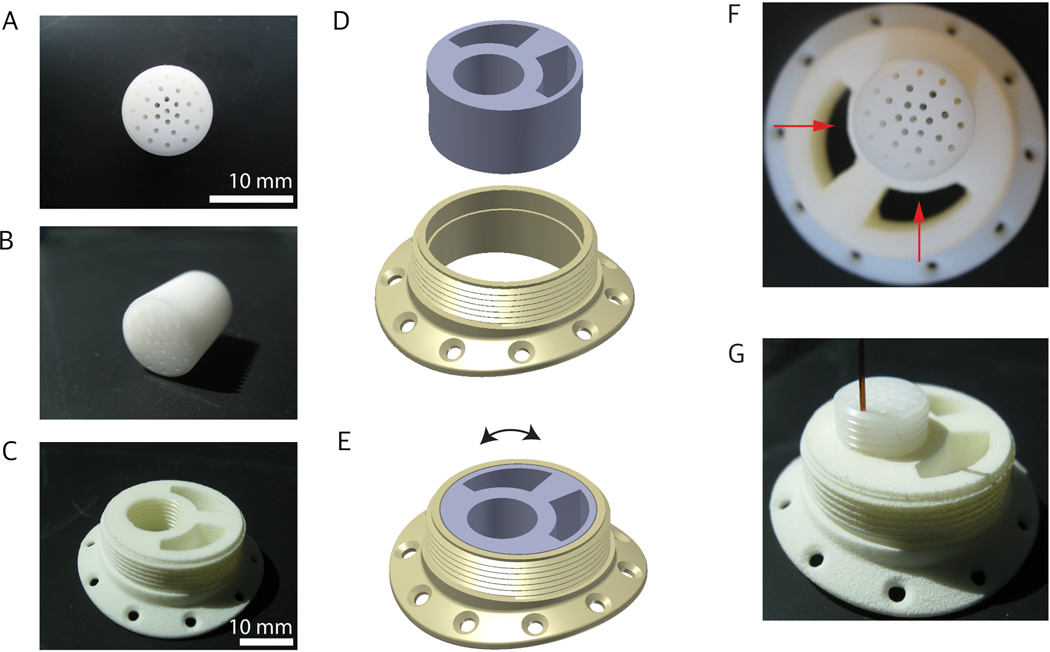
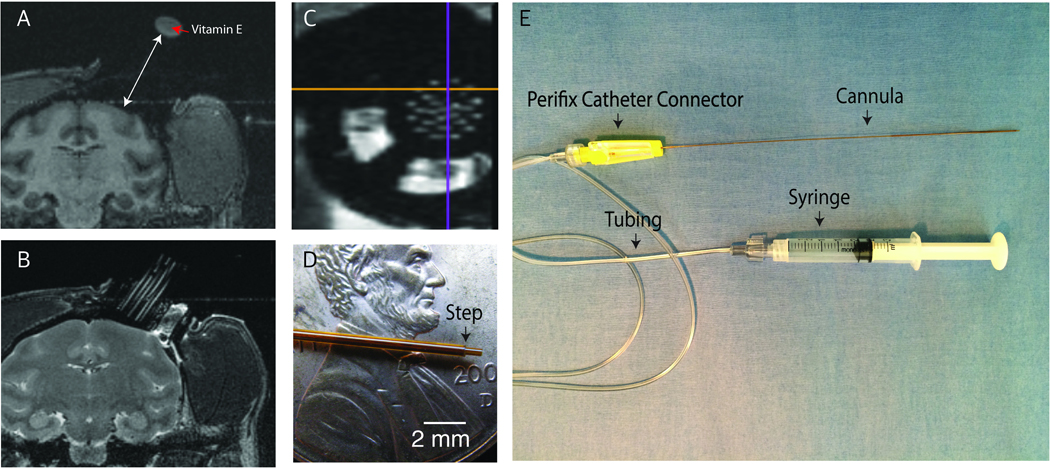
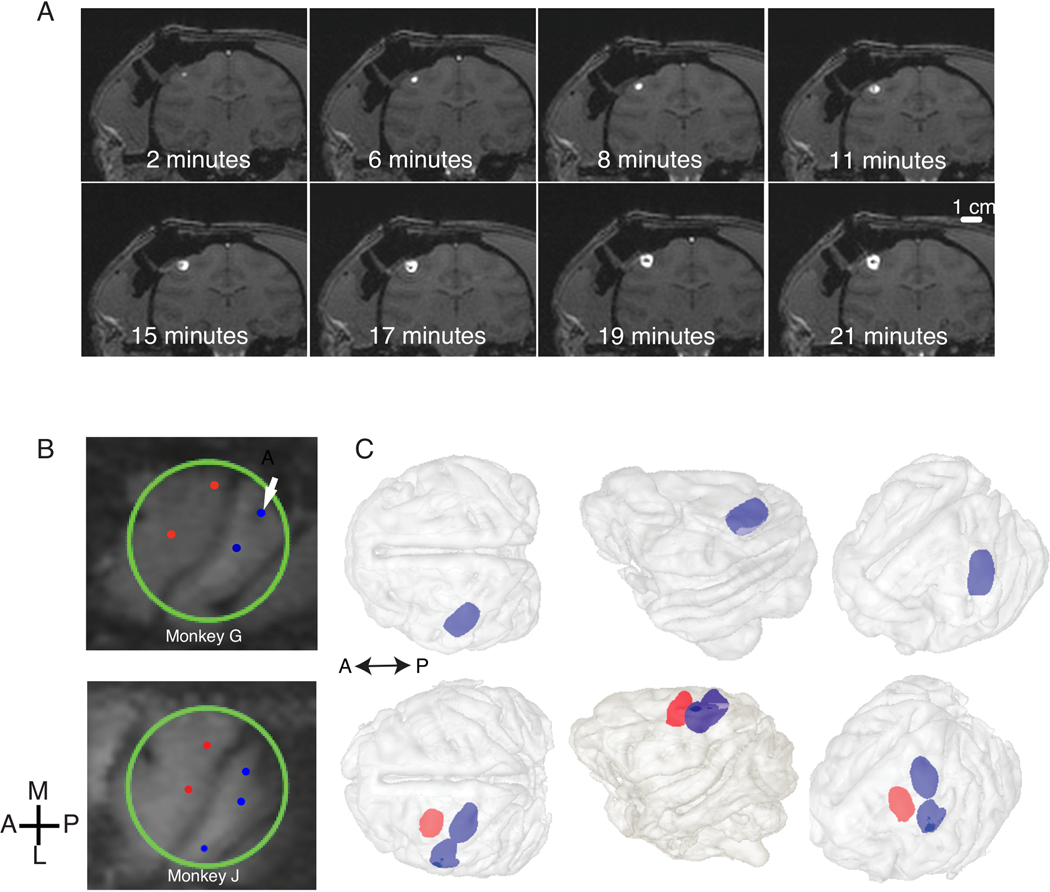
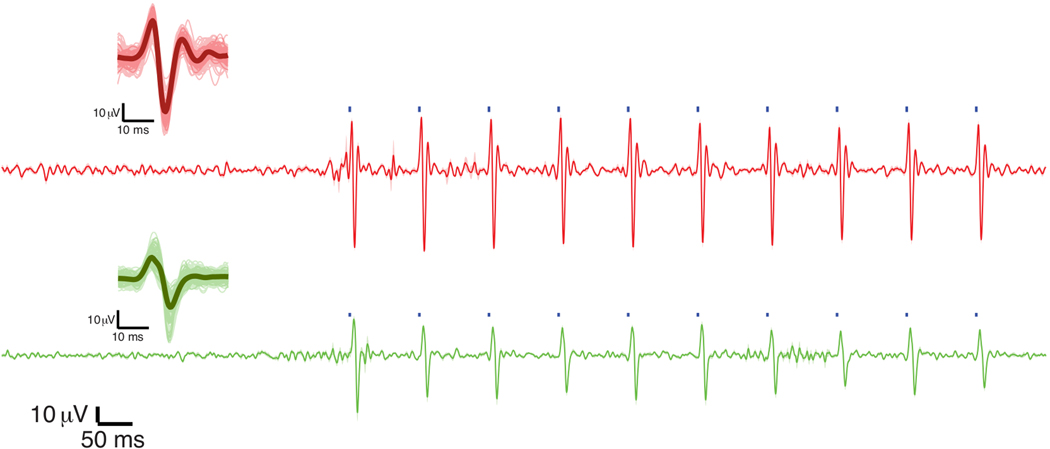
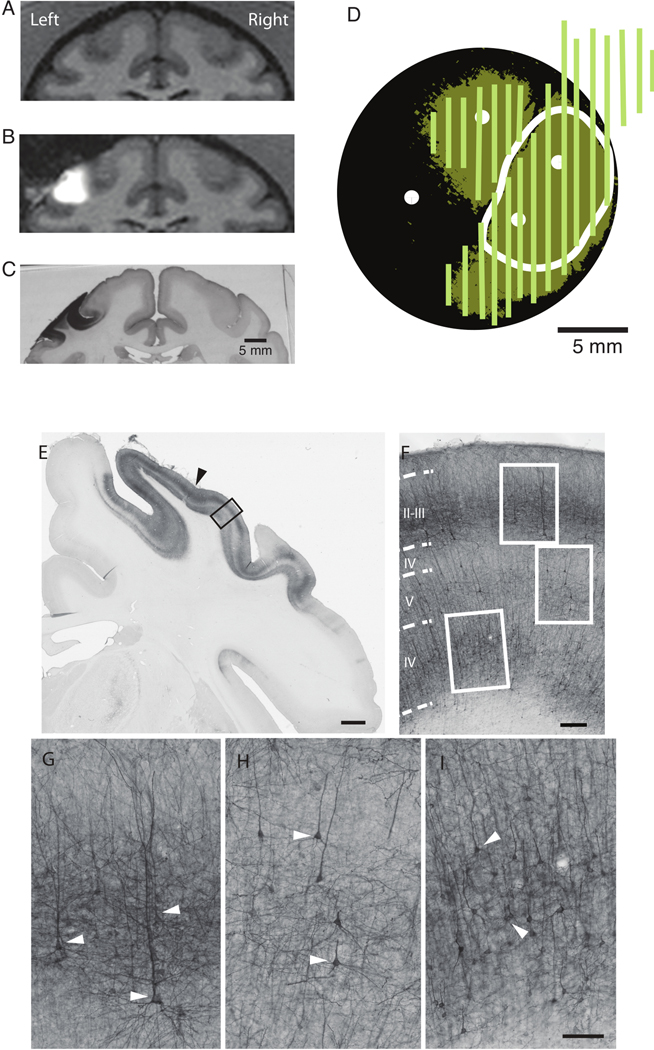
In non-human primate (NHP) optogenetics, infecting large cortical areas with viral vectors is often a difficult and time-consuming task. Here, we demonstrate the use of magnetic resonance (MR)-guided convection enhanced delivery (CED) of optogenetic viral vectors into primary somatosensory (S1) and motor (M1) cortices of macaques to obtain efficient, widespread cortical expression of light-sensitive ion channels. Adeno-associated viral (AAV) vectors encoding the red-shifted opsin C1V1 fused to yellow fluorescent protein (EYFP) were injected into the cortex of rhesus macaques under MR-guided CED. Three months post-infusion, epifluorescent imaging confirmed large regions of optogenetic expression (>130 mm2) in M1 and S1 in two macaques. Furthermore, we were able to record reliable light-evoked electrophysiology responses from the expressing areas using micro-electrocorticographic arrays. Later histological analysis and immunostaining against the reporter revealed widespread and dense optogenetic expression in M1 and S1 corresponding to the distribution indicated by epifluorescent imaging. This technique enables us to obtain expression across large areas of the cortex within a shorter period of time with minimal damage compared to the traditional techniques and can be an optimal approach for optogenetic viral delivery in large animals such as NHPs. This approach demonstrates great potential for network-level manipulation of neural circuits with cell-type specificity in animal models evolutionarily close to humans.
Figures
Similar articles
-
Widespread optogenetic expression in macaque cortex obtained with MR-guided, convection enhanced delivery (CED) of AAV vector to the thalamus.J Neurosci Methods. 2018 Jan 1;293:347-358. doi: 10.1016/j.jneumeth.2017.10.009. Epub 2017 Oct 16. J Neurosci Methods. 2018. PMID: 29042259
-
A Large-Scale Interface for Optogenetic Stimulation and Recording in Nonhuman Primates.Neuron. 2016 Mar 2;89(5):927-39. doi: 10.1016/j.neuron.2016.01.013. Epub 2016 Feb 11. Neuron. 2016. PMID: 26875625
-
Widespread functional opsin transduction in the rat cortex via convection-enhanced delivery optimized for horizontal spread.J Neurosci Methods. 2017 Nov 1;291:69-82. doi: 10.1016/j.jneumeth.2017.08.008. Epub 2017 Aug 12. J Neurosci Methods. 2017. PMID: 28807859
-
Direct convective delivery of adeno-associated virus gene therapy for treatment of neurological disorders.J Neurosurg. 2020 Jul 10;134(6):1751-1763. doi: 10.3171/2020.4.JNS20701. Print 2021 Jun 1. J Neurosurg. 2020. PMID: 32915526 Review.
-
Nonhuman Primate Optogenetics: Recent Advances and Future Directions.J Neurosci. 2017 Nov 8;37(45):10894-10903. doi: 10.1523/JNEUROSCI.1839-17.2017. J Neurosci. 2017. PMID: 29118219 Free PMC article. Review.
Cited by
-
A large-scale optogenetic neurophysiology platform for improving accessibility in NHP behavioral experiments.bioRxiv [Preprint]. 2024 Jun 29:2024.06.25.600719. doi: 10.1101/2024.06.25.600719. bioRxiv. 2024. PMID: 38979206 Free PMC article. Preprint.
-
Targeted Delivery of Chemogenetic Adeno-Associated Viral Vectors to Cortical Sulcus Regions in Macaque Monkeys by Handheld Injections.Bio Protoc. 2023 Dec 5;13(23):e4897. doi: 10.21769/BioProtoc.4897. eCollection 2023 Dec 5. Bio Protoc. 2023. PMID: 38094257 Free PMC article.
-
Multi-modal artificial dura for simultaneous large-scale optical access and large-scale electrophysiology in non-human primate cortex.J Neural Eng. 2021 Apr 14;18(5):10.1088/1741-2552/abf28d. doi: 10.1088/1741-2552/abf28d. J Neural Eng. 2021. PMID: 33770770 Free PMC article.
-
Demonstration of an Optimized Large-scale Optogenetic Cortical Interface for Non-human Primates.Annu Int Conf IEEE Eng Med Biol Soc. 2022 Jul;2022:3081-3084. doi: 10.1109/EMBC48229.2022.9871332. Annu Int Conf IEEE Eng Med Biol Soc. 2022. PMID: 36086548 Free PMC article.
-
Combining brain perturbation and neuroimaging in non-human primates.Neuroimage. 2021 Jul 15;235:118017. doi: 10.1016/j.neuroimage.2021.118017. Epub 2021 Mar 29. Neuroimage. 2021. PMID: 33794355 Free PMC article. Review.
