. 2019 Jun 5;14(6):e0216485.
doi: 10.1371/journal.pone.0216485. eCollection 2019.

Understanding heterogeneous tumor microenvironment in metastatic melanoma

Affiliations

Understanding heterogeneous tumor microenvironment in metastatic melanoma

Yiyi Yan et al. PLoS One. .

Abstract

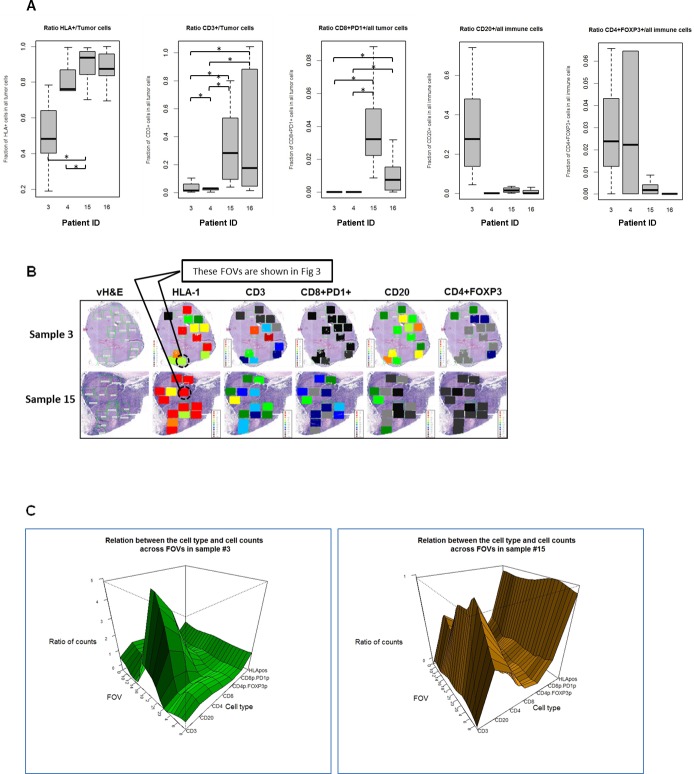
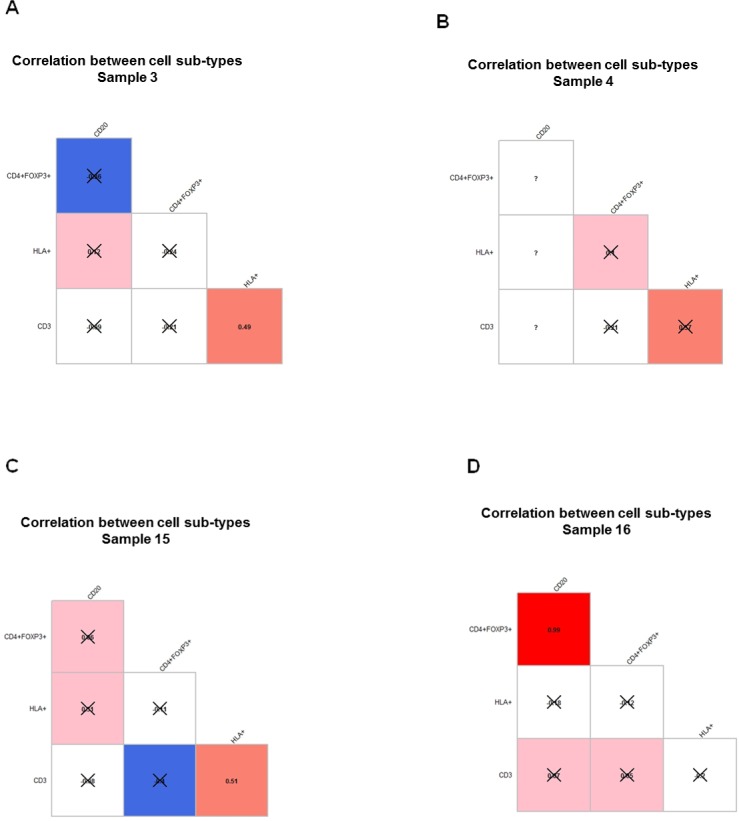
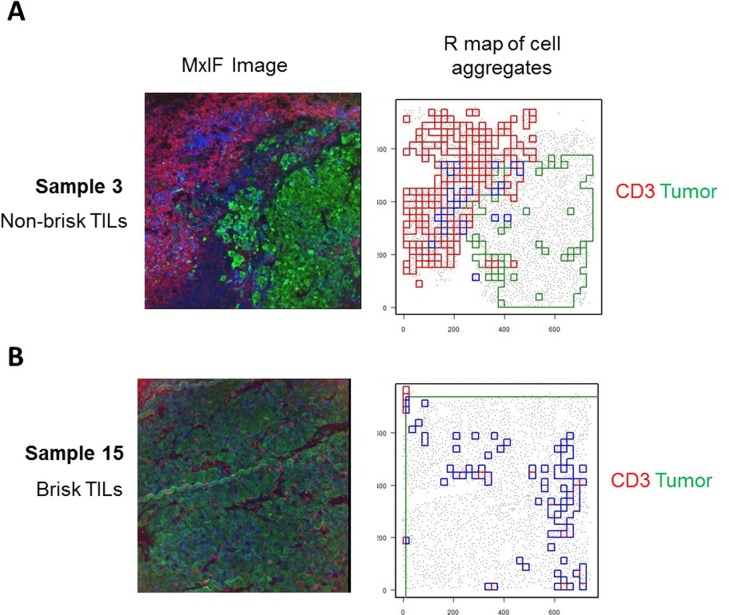
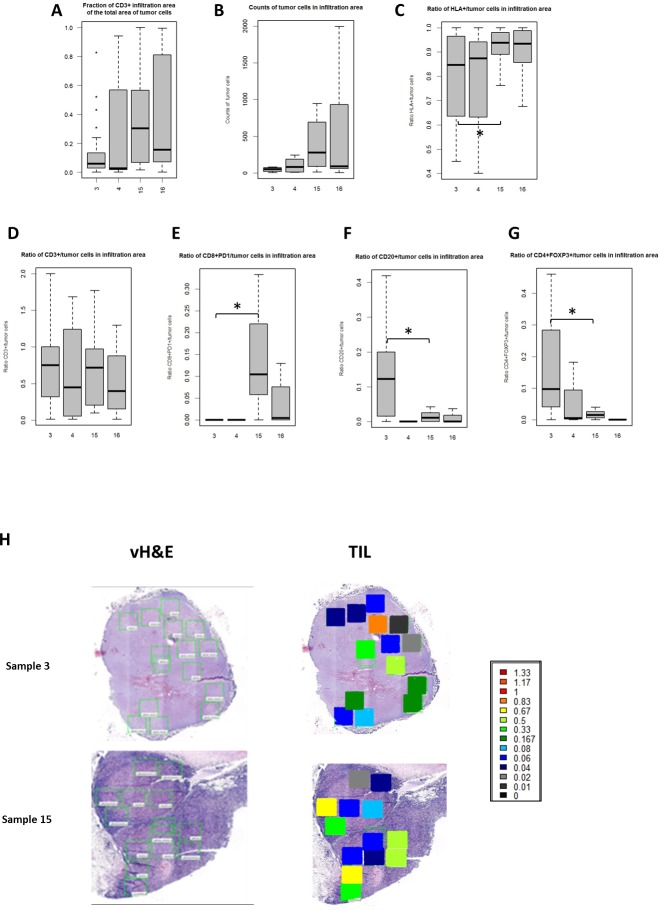
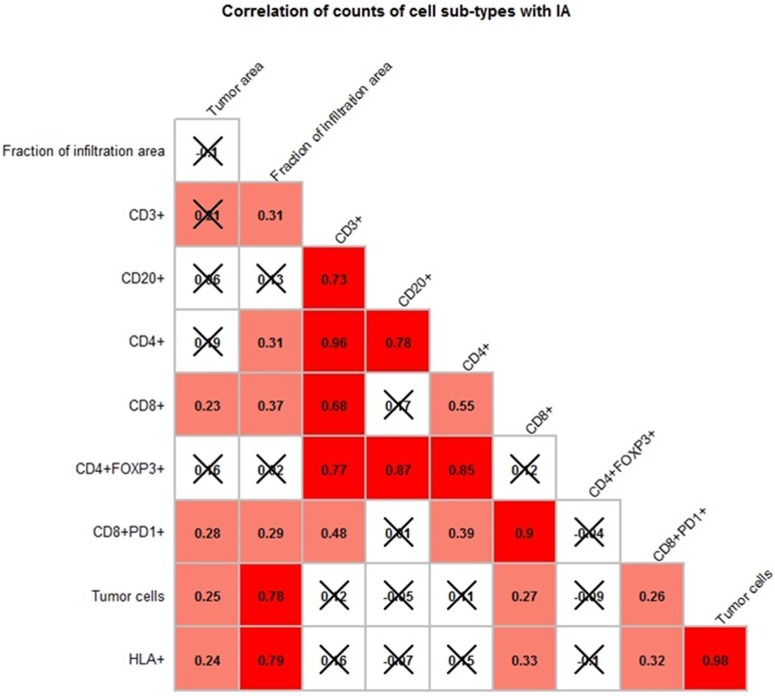
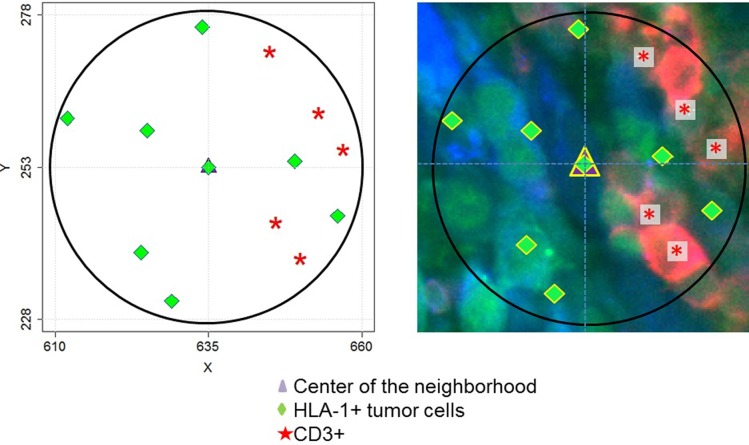
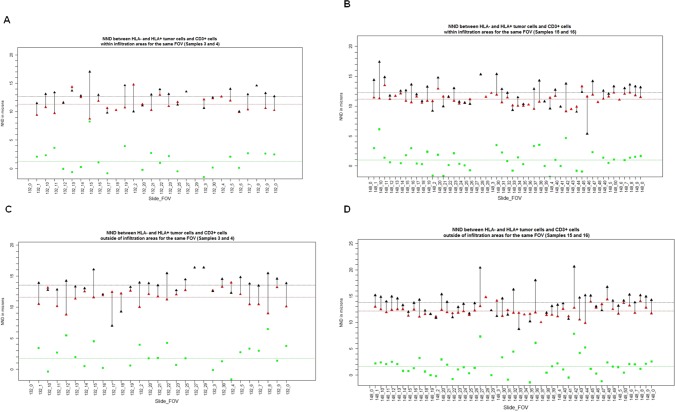
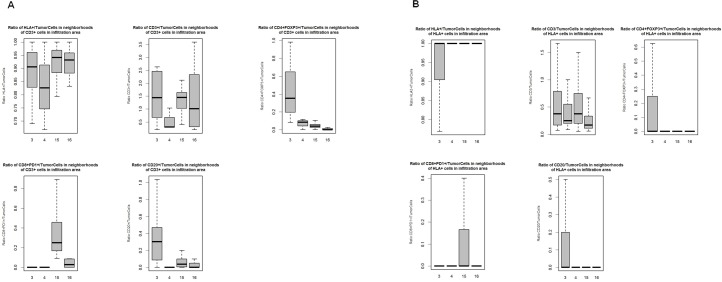
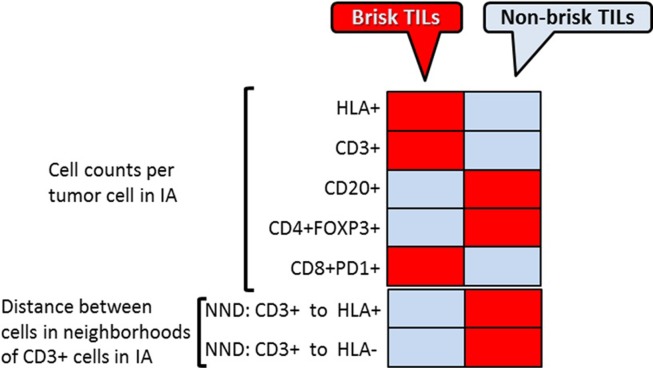
A systemic analysis of the tumor-immune interactions within the heterogeneous tumor microenvironment is of particular importance for understanding the antitumor immune response. We used multiplexed immunofluorescence to elucidate cellular spatial interactions and T-cell infiltrations in metastatic melanoma tumor microenvironment. We developed two novel computational approaches that enable infiltration clustering and single cell analysis-cell aggregate algorithm and cell neighborhood analysis algorithm-to reveal and to compare the spatial distribution of various immune cells relative to tumor cell in sub-anatomic tumor microenvironment areas. We showed that the heterogeneous tumor human leukocyte antigen-1 expressions differently affect the magnitude of cytotoxic T-cell infiltration and the distributions of CD20+ B cells and CD4+FOXP3+ regulatory T cells within and outside of T-cell infiltrated tumor areas. In a cohort of 166 stage III melanoma samples, high tumor human leukocyte antigen-1 expression is required but not sufficient for high T-cell infiltration, with significantly improved overall survival. Our results demonstrate that tumor cells with heterogeneous properties are associated with differential but predictable distributions of immune cells within heterogeneous tumor microenvironment with various biological features and impacts on clinical outcomes. It establishes tools necessary for systematic analysis of the tumor microenvironment, allowing the elucidation of the "homogeneous patterns" within the heterogeneous tumor microenvironment.


Conflict of interest statement

Authors AS, AS-P, CC, RZ, FG are currently employed at GE Global Research. This does not alter our adherence to PLOS ONE policies on sharing data and materials. Considering actual contribution to algorithm development which is the main novelty of this study, we added a line stating that two first authors contributed equally to this work.

Figures

Fig 1
Fig 1. Quantitative assessment of melanoma TME cellular heterogeneity.
A. Ratios (y-axis) of counts of different cell sub-types to the counts of tumor cells or all immune cells per tumor sample. Box plots represent the range (lower edge– 25 percentile, middle– 50th percentile and top edge– 75th percentile) of ratios across all FOVs for each tumor sample. Shown here are ratios for HLA1+ tumor cells/all tumor cells, tumor infiltrating CD3+ cells/all tumor cells, tumor infiltrating CD8+PD1+ cells/all tumor cells, CD20+ cells /all immune cells, CD4+FOXP3+ cells/all immune cells. X-axis indicates different sample IDs. Horizontal bars with asterisks represent comparison where the difference was significant with p-value<0.05. B. Heterogeneous Melanoma HLA-1 Expression Associates With Distinct Heterogeneous Distribution of Different Immune Cell Subsets in Tumor Microenvironment. Multiple regions of interest from metastatic lymph node excisional biopsies of 2 patients were selected (green boxes shown in vH&E images) and applied to MxIF for multiple cell markers. Heat maps represent the ratios of HLA-1–expressing melanoma cells to total melanoma cells; tumor-infiltrating CD3+ cells to all tumor cells; tumor-infiltrating CD8+PD1+ cells to all tumor cells; tumor-surrounding CD20+ cells to all tumor-surrounding immune cells; and CD4+FOXP3+ cells to all tumor-surrounding immune cells. HLA-1 indicates HLA antigen 1; PD1, programmed death protein 1; vH&E, virtual hematoxylin-eosin. C. 3D plots for the ratios of cell counts to the number of tumor cells (HLA-1, CD3, CD4, CD8, CD8+PD1+) or immune cells (CD20, CD4+FOXP3+). 3D plots show ratio of counts (Z- axis) of 7 types of cells (Y-axis) to the number of tumor cells or total number of immune cells for each FOV (X-axis) in sample 3 (left panel) and 15 (right panel) (calculated as in Fig 1B).
Fig 2
Fig 2. Correlograms demonstrating correlations between ratios of cell counts shown within each FOV from all four patients samples.
A-D. Same samples as in Fig 1 were used. Pearson r coefficient between ratios of cell counts was computed across all FOVs within each tumor sample in each sample. The value of correlation coefficient is shown in each box and represented by the color in increasing order: blue, white, pink, red. Blue represents negative correlation coefficient and inverse correlation. P-value was calculated for each correlation coefficient and crossed boxes show correlation which did not pass the 0.05 cutoff of p-value. Question marks correspond to cases with insufficient data. Correlations that are not statistically significant are X-ed out.
Fig 3
Fig 3. Cell aggregation algorithm (CAA) delineates areas of cell aggregates as polygons of complex shape.
The MxIF images of two exemplar FOVs (seen in Fig 1B) are shown here. A corresponds to the tumor with non-brisk T cell infiltration, while B corresponds to the tumor with brisk tumor T cell infiltration. MxIF images shown on the left (tumor cells (green), CD3+ cells (red)). R maps (shown on the right) demonstrate aggregates of tumor cells (green), CD3+ cells (red) and intersection of these regions (blue).
Fig 4
Fig 4. Boxplots showing the range of the ratios of counts of different cell sub-types to the counts of tumor cells or all immune cells per tumor sample in the Infiltration Areas (IAs).
A-G. Box plots represent the range (lower edge– 25 percentile, middle– 50th percentile and top edge– 75th percentile) of ratios across all FOVs for each tumor sample. A. ratio of the area of CD3+ IA to the whole area of tumor cells; B. counts of tumor cells in IAs; C. ratio of HLA+/tumor cells in IAs; D. ratio of CD3+/tumor cells in IAs; E. ratio of CD8+PD1+/tumor cells in IAs; F. ratio of CD20+/tumor cells in IAs; G. ratio of CD4+FOXP3+/tumor cells in IAs. Horizontal line with asterisk shows statistically significant difference. H. Heat map of the two exemplar tumor samples showing the level of CD3+ T cell infiltration in the tumor in the IAs in each individual FOV from 2 patient samples. The color scales indicate the ratios of T cell counts per tumor cells.
Fig 5
Fig 5. Correlogram demonstrating correlation between ratios of cell counts within each FOV within the Infiltration Areas (IAs).
Pearson r coefficient between the number of cell counts in IAs were computed across all FOVs from 4 tumor samples. The value of correlation coefficient is shown in each box and represented by the color in increasing order: blue, white, pink, red. Question marks correspond to cases with insufficient data. Correlations that are not statistically significant are X-ed out.
Fig 6
Fig 6. Cell neighborhood analysis algorithm (CNAA).
The map on the left demonstrates an example of a single neighborhood of a cell (purple triangle). X and Y coordinates are shown in microns and the diameter of the neighborhood is 50 microns in diameter. Green diamonds represent positions of HLA1+ tumor cells and red asterisks represent positions of CD3+ cells in the neighborhood. The MxIF image of the same neighborhood is shown on the left. Red: CD3 marker; Green: HLA-1; Blue color: S100B.
Fig 7
Fig 7. Distance between tumor and T cells.
Distances between CD3+ cells and HLA+ tumor cells (red triangles) and HLA- tumor cells (black triangles) in the neighborhoods of CD3+ cells within IAs (A and B) and outside of IAs (C and D). A and C represents tumor samples with non-brisk TILs, and B and D represent tumor samples with brisk TILS. Each pair of red and black triangles connected by a line represent average distances for a single FOV shown on X–axis. Green squares represent the value of the difference between the two distances. Dotted lines represent average values of corresponding values (red, black and green) across all FOVs.
Fig 8
Fig 8. Ratios of different cell subtypes in the infiltration areas (IAs).
Boxplots showing the range of the ratios of counts of different cell sub-types to the counts of tumor cells across all FOVs in the neighborhoods of CD3+ cells in the IAs (A) or in the neighborhoods of HLA+ tumor cells in the IAs (B). Each box plot represents the range of ratios across all FOVs for each tumor sample. A. Ratio of HLA+ tumor cells/all tumor cells, ratio of CD3+/tumor cells, ratio of CD4+FOXP3+/tumor cells, ratio of CD8+PD1+/tumor cells, ratio of CD20+/tumor cells in the neighborhoods centered by CD3+ T cells in IAs were shown. B. Ratios of HLA+ tumor cells/tumor cells, ratio of CD3+/tumor cells, ratio of CD4+FOXP3+/tumor cells, ratio of CD8+PD1+/tumor cells, ratio of CD20+/tumor cells in the neighborhoods of centered by HLA+ cells in the IAs were shown.
Fig 9
Fig 9. Spatial analysis of tumor-immune cells in melanoma TME.
Heat map summarizes the results of the three type of spatial analysis- direct cell counts, cell aggregates analysis and cell neighborhood analysis between brisk vs. non-brisk TILs TME. Red boxes represent increased numbers and gray boxes–decreased numbers; pink boxes represent no change of the cell counts.

Similar articles

Cited by

References

    1. Schadendorf D, Hodi FS, Robert C, Weber JS, Margolin K, Hamid O, et al. Pooled Analysis of Long-Term Survival Data From Phase II and Phase III Trials of Ipilimumab in Unresectable or Metastatic Melanoma. J Clin Oncol. 2015;33(17):1889–1894. 10.1200/JCO.2014.56.2736 - DOI - PMC - PubMed
    1. Postow MA, Callahan MK, Wolchok JD. Immune Checkpoint Blockade in Cancer Therapy.J Clin Oncol. 2015;33(17):1974–1982. 10.1200/JCO.2014.59.4358 - DOI - PMC - PubMed
    1. Robert C, Ribas A, Wolchok JD, Hodi FS, Hamid O, Kefford R, et al. Anti-programmed-death-receptor-1 treatment with pembrolizumab in ipilimumab-refractory advanced melanoma: a randomised dose-comparison cohort of a phase 1 trial. Lancet. 2014;384(9948):1109–1117. 10.1016/S0140-6736(14)60958-2 - DOI - PubMed
    1. Hodi FS, O'Day SJ, McDermott DF, Weber RW, Sosman JA, Haanen JB, et al. Improved survival with ipilimumab in patients with metastatic melanoma. N Engl J Med. 2010;363(8):711–723. 10.1056/NEJMoa1003466 - DOI - PMC - PubMed
    1. Postow MA, Chesney J, Pavlick AC, Robert C, Grossmann K, McDermott D, et al. Nivolumab and ipilimumab versus ipilimumab in untreated melanoma. N Engl J Med. 2015;372(21):2006–2017. 10.1056/NEJMoa1414428 - DOI - PMC - PubMed

Publication types

Substances